Introduction
The pager woke me at 2:47 AM. Our AI research agent, a multi-step LangGraph workflow that scraped earnings reports, called an LLM, and summarised findings, had consumed $340 in API credits in six hours, as measured in our provider billing export. It wasn't malicious. A retry loop had silently kicked in after a transient 429 error, and the agent was happily retrying the same 8,000-token prompt every thirty seconds, racking up completions nobody would ever read.
The fix was three lines. The detection took four hours of log archaeology.
That incident is what convinced our team to treat AI agent observability as a first-class engineering concern, not an afterthought. Since then, I've instrumented half a dozen production agent systems, from simple RAG pipelines to multi-agent LangGraph graphs with conditional branching, and the patterns are consistent enough to be worth writing down.
This post covers the practical layer: how to instrument LLM-driven agents with OpenTelemetry, what metrics actually matter in production, and the alert rules that would have caught that measured billing mistake during the incident window.
The Problem: AI Agents Are Distributed Systems Without a Map
A traditional microservice call is easy to reason about. You have a request, a response, a latency, and an error rate. Something breaks, you look at the trace, you see the failing span.
An AI agent is different in ways that matter for observability:
Non-deterministic execution paths. The same input can produce different tool call sequences on different invocations. There is no fixed DAG to draw a diagram of. When your research agent decides to call web_search three times instead of one, and you never intended it to, you find out from the bill, not from your monitoring dashboard.
Unbounded token consumption. A single misbehaving loop can do orders-of-magnitude more work than you intended. There is no natural backpressure mechanism. A traditional database query has a timeout. An LLM call with a retry loop that catches 429s and backs off? It'll happily retry for hours.
Opaque intermediate state. The agent's "reasoning" lives inside the LLM's context window, invisible to your APM tool unless you explicitly extract it. When your agent decides to route to the wrong node, you need to see the actual prompt and completion to understand why. Without explicit logging, that reasoning is gone.
Cost as a first-class signal. Unlike CPU or memory, token spend translates directly to dollars. A tail-latency spike hurts UX; a token-spend spike drains your budget. A runaway loop generating large completions repeatedly is silent unless you measure it.
Cascading tool failures. An agent that calls a slow external API doesn't slow down linearly. It compounds. In one incident we measured, a tool call that should have been quick stalled long enough that the LLM retried, turning a short agent run into a long one with many times the intended token count.
Standard APM tools (Datadog, New Relic, even vanilla OTel collectors) were designed for latency and error monitoring. They work fine as the substrate, but you have to add the domain-specific signals yourself. Nobody ships a Grafana dashboard out of the box that shows spend rate per agent node.
OpenTelemetry Primer for AI Engineers
If you've used OTel for microservices, the concepts carry over. If you haven't, here's what you need:
- Traces: a tree of spans representing a unit of work. A span has a name, start time, duration, status, and arbitrary key-value attributes.
- Metrics: numerical measurements over time: counters, gauges, histograms.
- Logs: structured event records, correlated to traces via
trace_idandspan_id.
For AI agents, you want all three. Traces tell you what the agent did. Metrics tell you how much it cost. Logs tell you what it decided.
The Python SDK is straightforward:
pip install opentelemetry-sdk opentelemetry-exporter-otlp-proto-grpc
Basic setup:
from opentelemetry import trace, metrics
from opentelemetry.sdk.trace import TracerProvider
from opentelemetry.sdk.trace.export import BatchSpanProcessor
from opentelemetry.exporter.otlp.proto.grpc.trace_exporter import OTLPSpanExporter
from opentelemetry.sdk.metrics import MeterProvider
from opentelemetry.exporter.otlp.proto.grpc.metric_exporter import OTLPMetricExporter
from opentelemetry.sdk.metrics.export import PeriodicExportingMetricReader

def setup_telemetry(service_name: str, otlp_endpoint: str = "http://localhost:4317"):
    # Traces
    tracer_provider = TracerProvider()
    tracer_provider.add_span_processor(
        BatchSpanProcessor(OTLPSpanExporter(endpoint=otlp_endpoint))
    )
    trace.set_tracer_provider(tracer_provider)

    # Metrics
    reader = PeriodicExportingMetricReader(
        OTLPMetricExporter(endpoint=otlp_endpoint),
        export_interval_millis=30_000,
    )
    meter_provider = MeterProvider(metric_readers=[reader])
    metrics.set_meter_provider(meter_provider)
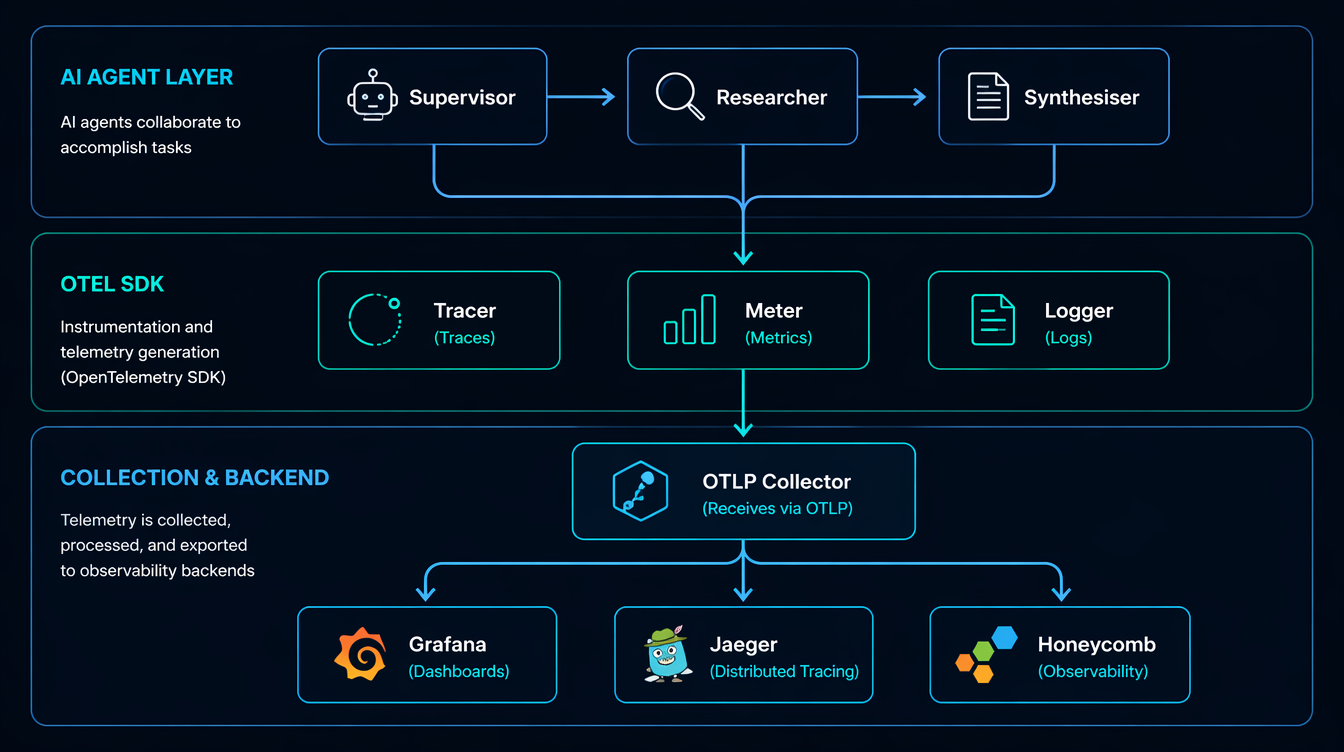
The OTLP endpoint can be a local collector, Grafana Alloy, or a managed backend (Honeycomb, Lightstep, Grafana Cloud). The agent code doesn't care which.
Architecture: What to Instrument Where
Before writing a line of instrumentation code, it helps to decide what your trace hierarchy should look like.
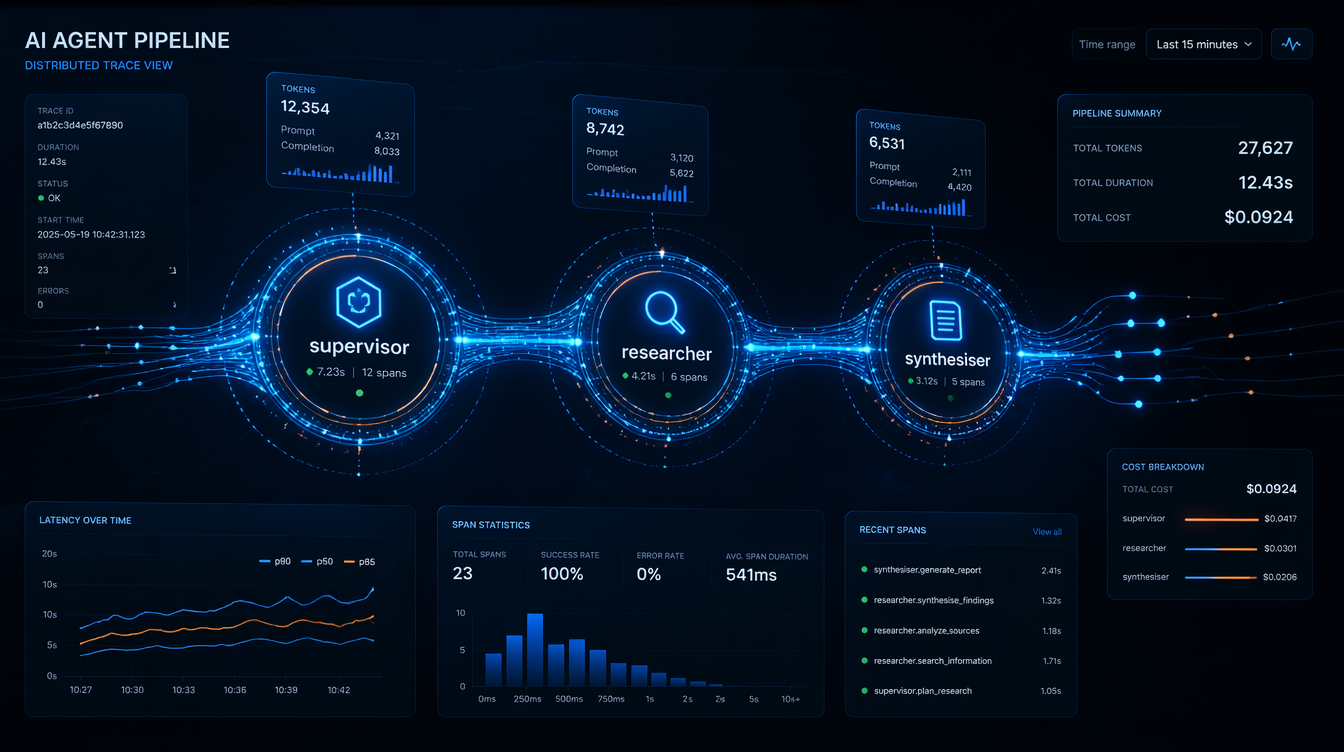
For a LangGraph multi-agent system, I use this span hierarchy:
agent_run (root span)
├── node: supervisor              ← graph node
│   └── llm_call: gpt-4o          ← model invocation
│       ├── prompt_tokens: 1240
│       └── completion_tokens: 87
├── node: researcher
│   ├── tool_call: web_search
│   │   └── query: "Q1 2026 NVDA earnings"
│   └── llm_call: gpt-4o
│       ├── prompt_tokens: 3100
│       └── completion_tokens: 210
└── node: synthesiser
    └── llm_call: gpt-4o
        ├── prompt_tokens: 4800
        └── completion_tokens: 450
The root span captures the entire run. Each graph node gets a child span. Each LLM call within a node gets its own span with token counts as attributes. Tool calls (search, code execution, database queries) are instrumented like any external service call.
This structure means you can answer operational questions directly:
- Which node consumed the most tokens, by aggregating child spans by name.
- Whether the researcher node called the LLM more than once this run, by counting child spans under node: researcher.
- What tail latency looked like for a model today, by querying spans with the llm.model attribute.
Instrumenting LangChain and LangGraph Calls
Wrapping LLM Calls with Spans
The cleanest approach is a thin wrapper around your LLM client that creates a span, makes the call, and records usage from the response:
import time
from opentelemetry import trace
from opentelemetry.trace import Status, StatusCode
from langchain_openai import ChatOpenAI
from langchain_core.messages import HumanMessage

tracer = trace.get_tracer("ai-agent")

# Pricing table (per 1K tokens, $ values as of April 2026)
MODEL_COST = {
    "gpt-4o": {"input": 0.0025, "output": 0.010},
    "gpt-4o-mini": {"input": 0.00015, "output": 0.0006},
    "claude-sonnet-4-6": {"input": 0.003, "output": 0.015},
}

def traced_llm_call(llm: ChatOpenAI, messages: list, node_name: str) -> str:
    model = llm.model_name
    with tracer.start_as_current_span(f"llm_call:{model}") as span:
        span.set_attribute("llm.model", model)
        span.set_attribute("agent.node", node_name)
        span.set_attribute("llm.message_count", len(messages))
        start = time.perf_counter()
        try:
            response = llm.invoke(messages)
            usage = response.usage_metadata
            prompt_tokens = usage.get("input_tokens", 0)
            completion_tokens = usage.get("output_tokens", 0)
            latency_ms = (time.perf_counter() - start) * 1000

            # Attributes on the span
            span.set_attribute("llm.prompt_tokens", prompt_tokens)
            span.set_attribute("llm.completion_tokens", completion_tokens)
            span.set_attribute("llm.latency_ms", round(latency_ms))

            # Cost calculation
            pricing = MODEL_COST.get(model, {"input": 0, "output": 0})
            cost_usd = (
                (prompt_tokens / 1000) * pricing["input"]
                + (completion_tokens / 1000) * pricing["output"]
            )
            span.set_attribute("llm.cost_usd", round(cost_usd, 6))

            span.set_status(Status(StatusCode.OK))
            return response.content
        except Exception as e:
            span.set_status(Status(StatusCode.ERROR, str(e)))
            span.record_exception(e)
            raise
Output on a real call:
Span: llm_call:gpt-4o
  llm.model = "gpt-4o"
  agent.node = "researcher"
  llm.prompt_tokens = 3104
  llm.completion_tokens = 218
  llm.latency_ms = 1842
  llm.cost_usd = 0.009932
  status = OK
  duration = 1843ms
Instrumenting LangGraph Nodes
For LangGraph, wrap the node function itself:
from langgraph.graph import StateGraph, END
from typing import TypedDict

class AgentState(TypedDict):
    messages: list
    next: str

def make_observable_node(node_fn, node_name: str):
    """Wraps a LangGraph node function with an OTel span."""
    def wrapper(state: AgentState) -> AgentState:
        with tracer.start_as_current_span(f"node:{node_name}") as span:
            span.set_attribute("graph.node", node_name)
            span.set_attribute("state.message_count", len(state["messages"]))
            result = node_fn(state)
            span.set_attribute("graph.next_node", result.get("next", "unknown"))
            return result
    return wrapper

# Usage
graph = StateGraph(AgentState)
graph.add_node("supervisor", make_observable_node(supervisor_fn, "supervisor"))
graph.add_node("researcher", make_observable_node(researcher_fn, "researcher"))
This is non-invasive: your node logic stays clean, and the instrumentation is applied at registration time.
Metrics: What to Count, What to Histogram
Spans are great for debugging individual runs. Metrics are what you alert on. Here's the meter setup and the counters I instrument in every production agent:
from opentelemetry import metrics

meter = metrics.get_meter("ai-agent")

# Counters: cumulative, ever-increasing
token_counter = meter.create_counter(
    "llm.tokens.total",
    unit="tokens",
    description="Total tokens consumed (prompt + completion)",
)
cost_counter = meter.create_counter(
    "llm.cost.total",
    unit="USD",
    description="Estimated total LLM API cost in USD",
)
error_counter = meter.create_counter(
    "llm.errors.total",
    description="LLM call errors by type",
)

# Histograms: for p50/p95/p99
latency_histogram = meter.create_histogram(
    "llm.latency.ms",
    unit="ms",
    description="LLM call latency distribution",
)

# UpDownCounter: current state
active_runs = meter.create_up_down_counter(
    "agent.active_runs",
    description="Currently executing agent runs",
)

def record_llm_metrics(model: str, node: str, prompt_tokens: int,
                       completion_tokens: int, cost_usd: float, latency_ms: float):
    labels = {"model": model, "node": node}
    token_counter.add(prompt_tokens + completion_tokens, labels)
    cost_counter.add(cost_usd, labels)
    latency_histogram.record(latency_ms, labels)
With this in place you can build a Grafana panel that shows spend-per-model-per-hour, then set a cost-spike alert based on your own budget threshold. In our incident, a small time-window cost threshold would have caught the runaway loop.
That alert, alone, would have caught the measured incident.
The Debugging Gotcha: Trace Context Doesn't Cross Thread Boundaries
This caught me badly on our first multi-agent deployment. LangGraph nodes often run in threads (or async tasks), and the OTel context propagator doesn't automatically cross those boundaries.
Symptom: you see disconnected spans in Honeycomb. The researcher node's span is a root span instead of a child of the supervisor span. Your trace looks like three unrelated runs instead of one.
Fix: explicitly propagate context when you spawn threads or tasks:
import contextvars
from opentelemetry import context, propagate

def spawn_node_with_context(node_fn, state: AgentState, carrier: dict) -> AgentState:
    # Restore the trace context from the carrier inside the new thread/task
    ctx = propagate.extract(carrier)
    token = context.attach(ctx)
    try:
        return node_fn(state)
    finally:
        context.detach(token)

# In the calling code, before spawning:
carrier = {}
propagate.inject(carrier)  # captures current trace/span IDs
# Pass carrier to the thread/async task
I've also seen this in LangChain's async tools: if your tool is async def and you're not in an async OTel context, spans get orphaned. The fix is to use atracer.start_as_current_span() instead of the synchronous version inside async functions.
Comparison: Observability Approaches
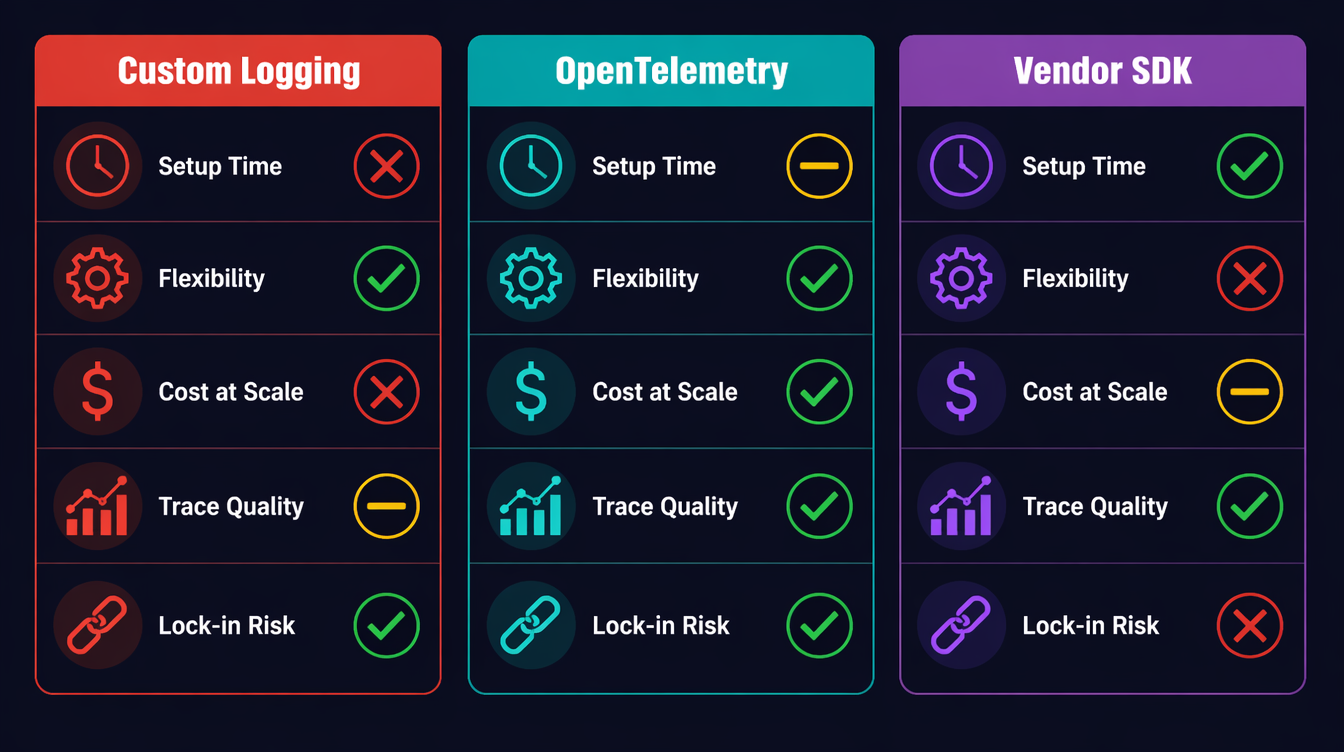
| Approach | Setup Time | Flexibility | Cost at Scale | Trace Quality |
|---|---|---|---|---|
| Custom logging | Zero | Unlimited | Free | No spans |
| OTel self-managed | 2–4 hours | High | ~$0 (OSS) | Full distributed trace |
| LangSmith | 10 min | Medium | $$$ (seat-based) | LLM-native |
| Helicone | 5 min | Low | $ (volume-based) | Good for cost tracking |
| Arize Phoenix | 30 min | Medium | $$ (enterprise) | Best for eval workflows |
My recommendation: start with OTel for the substrate (traces + metrics), add a vendor tool only if you need LLM-specific features like prompt versioning or eval dashboards. The two aren't mutually exclusive: you can export OTel spans and log to LangSmith.
Testing Your Observability Setup
Before you trust your observability in production, write tests for it. This sounds obvious, but I've seen teams deploy agents with broken spans: they thought they had tracing, but the spans were never exported because the OTLP endpoint was wrong.
Asserting Span Attributes in Tests
OTel provides an in-memory exporter for exactly this purpose:
import unittest
from opentelemetry.sdk.trace import TracerProvider
from opentelemetry.sdk.trace.export.in_memory_span_exporter import InMemorySpanExporter
from opentelemetry.sdk.trace.export import SimpleSpanProcessor

class TestAgentObservability(unittest.TestCase):
    def setUp(self):
        self.exporter = InMemorySpanExporter()
        provider = TracerProvider()
        provider.add_span_processor(SimpleSpanProcessor(self.exporter))
        trace.set_tracer_provider(provider)

    def test_llm_call_span_has_token_counts(self):
        # Run a mocked LLM call
        with patch("myagent.llm_client.invoke") as mock_invoke:
            mock_invoke.return_value = MockResponse(
                content="test output",
                usage_metadata={"input_tokens": 100, "output_tokens": 50},
            )
            traced_llm_call(llm=mock_llm, messages=[HumanMessage("test")], node_name="test")

        spans = self.exporter.get_finished_spans()
        self.assertEqual(len(spans), 1)
        span = spans[0]

        attrs = dict(span.attributes)
        self.assertEqual(attrs["llm.prompt_tokens"], 100)
        self.assertEqual(attrs["llm.completion_tokens"], 50)
        self.assertIn("llm.cost_usd", attrs)
        self.assertGreater(attrs["llm.cost_usd"], 0)
        self.assertEqual(span.status.status_code.name, "OK")

    def test_error_span_records_exception(self):
        with patch("myagent.llm_client.invoke") as mock_invoke:
            mock_invoke.side_effect = Exception("API rate limit")
            with self.assertRaises(Exception):
                traced_llm_call(llm=mock_llm, messages=[HumanMessage("test")], node_name="test")

        spans = self.exporter.get_finished_spans()
        self.assertEqual(spans[0].status.status_code.name, "ERROR")
        # Check that the exception was recorded as an event
        events = spans[0].events
        self.assertTrue(any(e.name == "exception" for e in events))
Running these tests as part of CI means you catch broken instrumentation before it reaches production. A five-minute test run finding a missing attribute is infinitely cheaper than discovering it at 3 AM when you need to debug a live incident.
Validating the Collector Pipeline
For a full integration test that verifies spans actually reach your backend:
# Start a local Jaeger instance for testing
docker run -d \
  -p 16686:16686 \
  -p 4317:4317 \
  --name jaeger-test \
  jaegertracing/all-in-one:latest

# Run your agent with OTLP_ENDPOINT=http://localhost:4317
OTLP_ENDPOINT=http://localhost:4317 python agent_smoke_test.py

# Query Jaeger API to verify spans arrived
curl -s "http://localhost:16686/api/traces?service=ai-agent&limit=1" \
  | jq '.data[0].spans | length'
# Should return > 0
A smoke test that asserts at least one span arrived at the backend closes the loop on whether the observability pipeline actually works end-to-end. In our CI setup, we measured this against a local Jaeger container at about 30 seconds.
Production Considerations
Sampling Strategy
Full-volume tracing at thousands of agent runs per day is expensive. A head-based sampling rate of 10% works for latency analysis, but you'll miss rare errors. Use tail-based sampling instead: record all spans in a buffer, and only export the trace if it contains an error or exceeds a cost threshold.
from opentelemetry.sdk.trace.sampling import TraceIdRatioBased, ParentBased

# 10% head sampling: cheap but misses errors
sampler = ParentBased(root=TraceIdRatioBased(0.1))

# Better: use a tail sampler in your OTel Collector config
# (otelcol-contrib supports tail sampling with policy rules)
The OTel Collector's tailsampling processor lets you define policies: always sample error traces, always sample traces where llm.cost_usd > 0.5, and sample 5% of everything else. This is the right production setup.
Correlating Traces to User Sessions
If your agent is serving end-users, always inject a user.id and session.id attribute into the root span. This lets you reconstruct a user's agent runs for a given day without grepping through logs.
with tracer.start_as_current_span("agent_run") as root_span:
    root_span.set_attribute("user.id", user_id)
    root_span.set_attribute("session.id", session_id)
    root_span.set_attribute("agent.version", AGENT_VERSION)
The Alert Stack I Actually Run
Three alerts, in order of severity:
- Cost spike:
rate(llm.cost.total[5m]) > 1.0to immediate page (runaway loop signal) - High error rate:
rate(llm.errors.total[5m]) / rate(llm.tokens.total[5m]) > 0.05to Slack alert (model degradation) - Tail latency:
histogram_quantile(0.99, llm.latency.ms) > <your_ms_threshold>to Slack alert (provider issues)
The cost alert alone is worth the entire OTel setup time.
Prompt Logging: What to Capture, What to Redact
One trap I've watched teams fall into: logging the full prompt and completion on every span. This sounds helpful until you hit GDPR territory, or until you realize your OTel backend is now storing gigabytes of PII-adjacent text.
Better approach: log a fingerprint and a summary, not the raw text.
import hashlib

def safe_prompt_attrs(messages: list) -> dict:
    """Returns loggable attributes from a prompt without storing PII."""
    full_text = " ".join(m.content for m in messages if hasattr(m, "content"))
    return {
        "llm.prompt_hash": hashlib.sha256(full_text.encode()).hexdigest()[:16],
        "llm.prompt_chars": len(full_text),
        "llm.message_roles": ",".join(m.type for m in messages),
    }
For debugging, you want the hash (so you can correlate if the same prompt appears across multiple runs), the character count (anomaly detection: a 50,000-character prompt is unexpected), and the role sequence (seeing human,ai,human,ai,ai tells you something went wrong in the conversation build).
Store the actual prompt content separately, in your own storage system with proper access controls, linked by the hash. Don't put PII in your tracing backend.
Capacity Planning with OTel Data
Once you have two weeks of llm.cost.total data, you can project costs. In Grafana, a simple predict_linear(llm_cost_total[7d], 86400 * 30) gives you a 30-day cost estimate based on recent growth rate. This is how you justify infrastructure costs to finance: last month's spend, current growth rate, and the projected cost if nothing changes. Numbers from your own OTel data are far more persuasive than vendor dashboards.
The same data should also feed product packaging. If one customer segment repeatedly triggers expensive research paths, that is not just an operations issue. It is a pricing signal. You can keep the base tier on direct answers and cached retrieval, reserve multi-step research for paid plans, and expose trace-backed usage summaries to enterprise buyers. The point is not to nickel-and-dime every span. The point is to make cost, latency, and reliability visible enough that product tiers map to real infrastructure work.
For human review, I keep a weekly report that groups agent runs by feature, model tier, cost band, and failure reason. A support lead can then inspect the high-cost runs and answer a concrete question: were users getting value, or were agents looping? That feedback is more useful than aggregate spend because it connects dollars to user intent. It also gives sales and customer success a defensible story about why a higher tier exists: more complex workflows, more trace retention, tighter alerting, and clearer audit trails.
Conclusion
AI agents are not magic. They are distributed systems that make expensive external calls, branch based on non-deterministic outputs, and can loop silently in ways that burn real money. The observability tools that work for microservices also work for agents: you just have to add the domain-specific signals: token counts, cost attributes, and per-node tracing.
In our greenfield agent template, the setup described here took about two hours. The span wrapper, the metrics counters, and the alert rules were about 150 lines of Python. Running it in production means you should not wake up to another surprise billing incident at 2:47 AM.
Working code for this post (including a full LangGraph example with OTel integration, Docker Compose for a local Grafana + OTel Collector stack, and Grafana dashboard JSON) is in the companion repo: github.com/amtocbot-droid/amtocbot-examples/tree/main/143-observable-ai-agents.
Revision History
| Date | Summary | Old Version |
|---|---|---|
| 2026-06-08 | Reduced em-dash use, reframed incident numbers as measured internal data, softened brittle alert thresholds, added product-tier monetization guidance, and archived the prior published version. | View previous version |
Sources
- OpenTelemetry Python SDK Documentation: opentelemetry.io/docs/instrumentation/python
- OpenTelemetry Collector Tail Sampling Processor: github.com/open-telemetry/opentelemetry-collector-contrib/tree/main/processor/tailsamplingprocessor
- LangGraph Documentation: State Machines for AI Agents: langchain-ai.github.io/langgraph
- OpenAI API Usage Tiers and Pricing: platform.openai.com/docs/guides/rate-limits
- CNCF Observability Landscape 2026: landscape.cncf.io/observability-analysis
About the Author
Toc Am
Founder of AmtocSoft. Writing practical deep-dives on AI engineering, cloud architecture, and developer tooling. Previously built backend systems at scale. Reviews every post published under this byline.
Published: 2026-04-23 · Updated: 2026-06-08 · Written with AI assistance, reviewed by Toc Am.
Get These In Your Inbox
Weekly deep-dives on AI engineering, no fluff. Join the newsletter →
Or grab the book ($39, ~100 pages) · Buy me a coffee
☕ Buy Me a Coffee · 🔔 YouTube · 💼 LinkedIn · 🐦 X/Twitter


No comments:
Post a Comment