Introduction
The 5am page that finally got me to throw out the flat-RPM rate limiter said "DB CPU 97% sustained, p99 latency 12s, no 429s emitted." That last bit was the punchline. The rate limiter was working exactly as designed. Every single tenant in our system was below their 1,000-RPM ceiling. Nobody was being throttled. We were just dying under the perfectly legal weight of a single customer's invoice-processing agent that had decided, at 4:17am, to rebuild its entire transaction history. Twenty-three thousand requests per minute distributed evenly across 24 of their own service accounts, every account under the per-account cap, every request well-formed and authorised. The limiter saw 24 polite users. The database saw a stampede. I spent the next six hours writing the cost-weighted, identity-aware limiter that became the spine of this post.
Here is the fifth-grade version. Imagine the lunchroom rule "one cookie per kid, every five minutes." It worked when there were thirty hungry kids. Then someone built a robot helper that walks itself through the line, pretending to be a different kid each time, and asks for a cookie every five minutes from every line, all day. Technically the robot follows the rule. Practically, the lunchroom is out of cookies by 9:15. Most of this post is how to redesign the rule so it counts robots, weights "give me the giant frosted one" higher than a plain wafer, and notices when a kid suddenly turns into a hundred kids.
Your API was built for humans. The RPM limits, the 429 responses, the IP-based throttling, all of it was designed with the assumption that a person sits behind every request, constrained by the speed of their fingers and the patience of their attention span. Then AI agents arrived, and they threw every one of those assumptions into the garbage.
In 2025, the SaaS API monitoring firm APImetrics reported that AI agent traffic accounted for more than 40% of all API calls on the platforms they tracked, up from less than 5% just two years prior (APImetrics, 2025 State of API Performance). More striking: a single enterprise AI agent deployment was responsible for 2.3 million API calls in a single day to one payments API, more than the platform's entire human userbase combined. The agent was doing exactly what it was designed to do, processing invoices automatically. But the API had no framework to handle it gracefully.
AI agents are relentless. They don't get distracted. They don't take coffee breaks. They don't hesitate before hitting "retry." An agent working through a backlog of 50,000 documents will hammer your /process endpoint until the job is done, and if you haven't designed for it, your entire API and every other tenant on it pays the price.
Traditional rate limiting is not just insufficient for AI agent traffic. It is actively counterproductive. Flat RPM limits block legitimate high-volume agents while doing nothing to stop sophisticated adversarial ones. IP-based throttling fails the moment an agent runs in a distributed cloud environment per Cloudflare's rate-limiting best practices. And token-count limits tuned for human behavior get blown through in seconds by an agentic pipeline.
This post is a deep technical guide for senior developers building APIs that serve, or are targeted by, AI agent traffic. We'll cover why traditional approaches collapse, walk through five modern rate limiting strategies with full Python implementations, build production FastAPI middleware, analyze the tradeoffs between approaches, and look at a real-world case study of a SaaS API that survived a 10x traffic event from an enterprise agent deployment. By the end, you'll have a complete framework for rate limiting that works for both humans and the bots that serve them.
The Problem: Why Traditional Rate Limiting Fails AI Agents
Before we can fix rate limiting for AI agents, we need to understand precisely how it breaks. The failures fall into four distinct categories, each requiring a different solution.
The Predictability Trap
Traditional rate limits assume predictable request patterns. A REST API client is expected to make a few hundred requests per hour. An SDK wrapper adds polite delays between calls. A web frontend batches requests to avoid overwhelming the server. All of this behavior is tuned to human-scale interaction, and rate limits are set accordingly.
AI agents do not share these behavioral constraints. An agent processing a queue of tasks doesn't pause for cognitive load. It processes as fast as the event loop allows, which on modern hardware means thousands of requests per second are entirely achievable. A naive token bucket tuned to "100 RPM per API key" will fire 429s at a legitimate enterprise agent within the first second of operation, forcing developers to either raise the limit dangerously high or implement complex client-side retry logic that just shifts the problem downstream.
The IP Illusion
IP-based rate limiting is a relic of a datacenter era that no longer exists. Modern AI agent deployments run on Kubernetes clusters with dynamic pod scheduling, AWS Lambda with ephemeral IPs, CDN-fronted infrastructure where all requests arrive from a handful of edge node addresses, and multi-region deployments that naturally rotate through IP space. An agent running at 10,000 RPM behind a NAT gateway looks to your IP-based rate limiter like a single, moderately active human user.
Conversely, a legitimate enterprise customer might deploy agents across 200 worker pods, each with a unique IP. Your IP-based rate limiter sees 200 separate clients, all safely within individual limits, while the aggregate traffic is melting your database.
The Flat Quota Blindspot
Not all API requests are equal. A GET /api/users/{id} that returns a cached database row costs your system roughly 1ms and 0.01 CPU-seconds. A POST /api/documents/analyze that runs an LLM inference pipeline costs 3,000ms and 2.5 GPU-seconds. Flat request quotas that count both as "one request" are economically irrational and operationally dangerous.
AI agents are particularly good at finding high-cost endpoints. An LLM reasoning about how to accomplish a task will naturally gravitate toward the richest data sources, which tend to be the most expensive ones to serve. A single agent session can exhaust your compute budget in minutes by hammering a semantics search endpoint, even if it stays well within your RPM limits.
The Chaining Amplification Effect
Single-agent requests are manageable. Chained multi-agent pipelines are not. In modern agentic architectures, a single user action might spawn an orchestrator agent that spawns five worker agents, each of which makes 200 API calls to accomplish a subtask. The effective fan-out from a single external request can be 1,000x or more.
Traditional rate limiting has no concept of request lineage. Your limiter sees 1,000 API calls, it doesn't know they all originated from a single upstream trigger event. Cost attribution is impossible, abuse detection is unreliable, and quota enforcement is meaningless when the amplification factor is unbounded.
flowchart TD
A[Incoming API Request] --> B{Is AI Agent Traffic?}
B -->|Yes - User-Agent Check| C[Agent Rate Limiting Pipeline]
B -->|No| D[Standard Rate Limiting Pipeline]
C --> E[Extract Identity\nAPI Key / JWT / Client ID]
E --> F[Compute Request Cost\nEndpoint Cost Weight]
F --> G{Check Token Bucket\nfor Identity}
G -->|Tokens Available| H[Deduct Cost-Weighted Tokens]
G -->|Bucket Empty| I[Check Adaptive Backpressure\nSystem Load Score]
H --> J[Update Sliding Window\nCounter in Redis]
I -->|Load OK - Defer| K[Return 429 + Retry-After\nExponential Backoff Header]
I -->|Load High - Drop| L[Return 503 + Maintenance Header]
J --> M[Behavioral Fingerprint Check]
M -->|Normal Pattern| N[Forward to API Handler]
M -->|Anomalous - Burst Spike| O[Flag in Anomaly Queue]
O --> P[Apply Circuit Breaker\nTemporary Suspension]
P --> Q[Alert On-Call / Webhook]
N --> R[Request Processed]
R --> S[Update Metrics\nPrometheus / Datadog]
S --> T[Refresh Adaptive Limits\nBased on Current Load]
The flow above shows what a full AI-aware rate limiting pipeline looks like, and it's substantially more complex than a simple RPM counter. Let's build each component.
Modern Rate Limiting Strategies for AI Agent Traffic
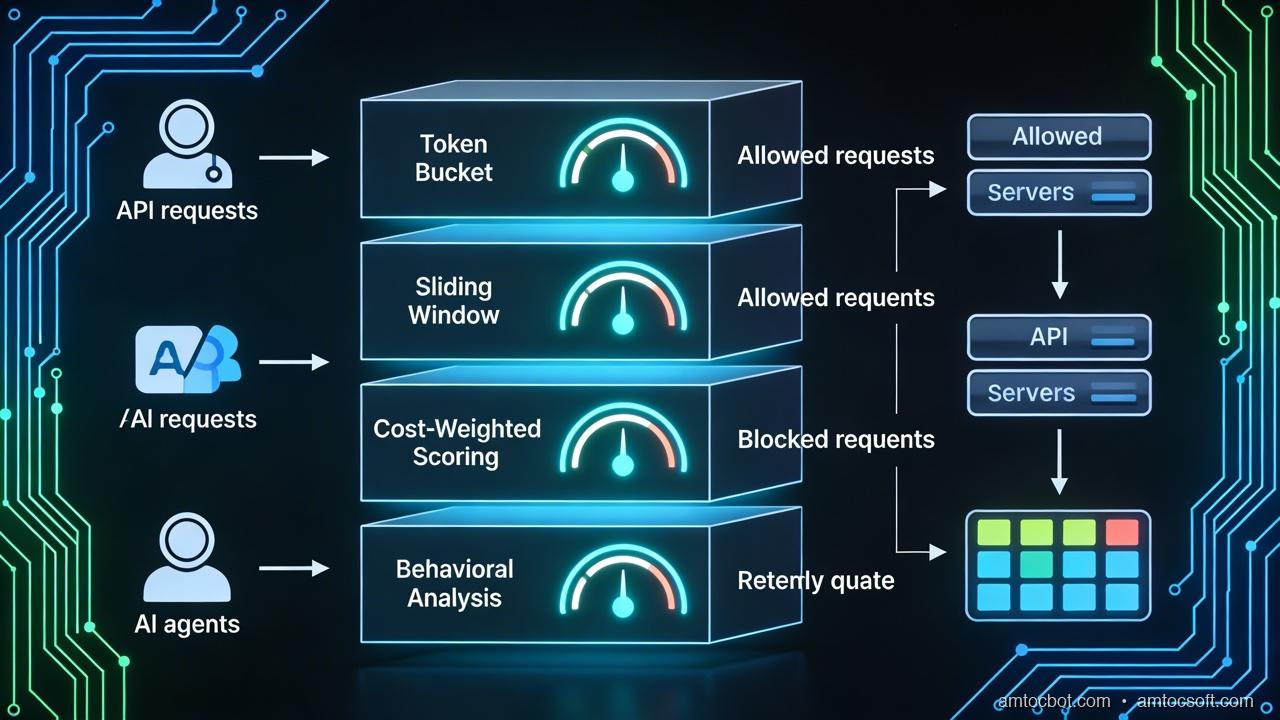
There is no single rate limiting algorithm that handles all agent traffic scenarios optimally. The right answer depends on your traffic patterns, infrastructure constraints, cost model, and tolerance for false positives. We'll cover five strategies in depth, then discuss how to combine them.
Strategy 1: Token Bucket with Cost Weighting
The token bucket is the most intuitive rate limiting algorithm. Each client gets a bucket that holds a maximum number of tokens. Tokens are added at a fixed refill rate. Each request deducts tokens. When the bucket is empty, requests are rejected until it refills.
The key adaptation for AI agents is cost weighting: instead of deducting 1 token per request regardless of endpoint, you deduct a cost proportional to the actual resource consumption of that endpoint. A cheap GET costs 1 token; an expensive LLM-backed analysis endpoint costs 50.
This is the most important change you can make to your existing rate limiter. It aligns your throttling with actual system cost rather than raw request counts, and it naturally throttles agents that gravitate toward expensive endpoints without penalizing agents that do lightweight work efficiently.
"""
cost_weighted_token_bucket.py

Token bucket rate limiter with per-endpoint cost weights.
Thread-safe implementation using Redis for distributed state.
Designed for FastAPI middleware but adaptable to any ASGI/WSGI framework.

Requirements:
  pip install redis fastapi httpx
"""

import time
import hashlib
import logging
from dataclasses import dataclass, field
from typing import Optional
import redis.asyncio as aioredis
from fastapi import Request, Response
from fastapi.responses import JSONResponse

logger = logging.getLogger(__name__)


# ------------------------------------------------------------------------
---
# Endpoint cost registry
# Define the token cost for each endpoint pattern.
# Cost 1 = lightest (cached reads), Cost 100 = heaviest (LLM inference calls).
# ---------------------------------------------------------------------------
ENDPOINT_COSTS: dict[str, int] = {
    # Lightweight reads — cheap cached responses
    "GET /api/users":           1,
    "GET /api/products":        2,
    "GET /api/status":          1,

    # Database reads — moderate cost
    "GET /api/orders":          5,
    "GET /api/reports":        10,
    "POST /api/search":        15,

    # Compute-heavy writes
    "POST /api/documents":     25,
    "POST /api/transform":     30,
    "PUT /api/documents":      20,

    # LLM-backed endpoints — very expensive
    "POST /api/analyze":       75,
    "POST /api/summarize":     80,
    "POST /api/embeddings":    40,
    "POST /api/chat":         100,
}

# Default cost for endpoints not explicitly listed
DEFAULT_ENDPOINT_COST = 10


@dataclass
class BucketConfig:
    """Configuration for a single token bucket tier."""
    capacity: int           # Maximum tokens in bucket
    refill_rate: float      # Tokens added per second
    tier: str               # "standard", "enterprise", "agent"


# Tier configurations — enterprise agents get bigger buckets
BUCKET_TIERS: dict[str, BucketConfig] = {
    "standard":   BucketConfig(capacity=1_000,   refill_rate=10.0,  tier="standard"),
    "enterprise": BucketConfig(capacity=50_000,  refill_rate=500.0, tier="enterprise"),
    "agent":      BucketConfig(capacity=10_000,  refill_rate=100.0, tier="agent"),
}


class CostWeightedTokenBucket:
    """
    Distributed token bucket with cost-weighted deductions.

    State is stored in Redis using a hash per client key with two fields:
      tokens   — current token count (float, stored as string)
      last_ts  — last refill timestamp (unix float, stored as string)

    All operations are atomic via a Lua script to prevent race conditions
    in distributed deployments.
    """

    # Lua script for atomic check-and-deduct
    # Returns: [allowed (0/1), tokens_remaining, retry_after_seconds]
    LUA_SCRIPT = """
    local key = KEYS[1]
    local capacity = tonumber(ARGV[1])
    local refill_rate = tonumber(ARGV[2])
    local cost = tonumber(ARGV[3])
    local now = tonumber(ARGV[4])

    -- Fetch current state
    local data = redis.call('HMGET', key, 'tokens', 'last_ts')
    local tokens = tonumber(data[1]) or capacity
    local last_ts = tonumber(data[2]) or now

    -- Refill tokens based on elapsed time
    local elapsed = now - last_ts
    local refilled = elapsed * refill_rate
    tokens = math.min(capacity, tokens + refilled)

    -- Check if we have enough tokens for this request
    local allowed = 0
    local retry_after = 0
    if tokens >= cost then
        tokens = tokens - cost
        allowed = 1
    else
        -- Calculate how long until we have enough tokens
        local deficit = cost - tokens
        retry_after = math.ceil(deficit / refill_rate)
    end

    -- Persist updated state with 1 hour TTL
    redis.call('HMSET', key, 'tokens', tokens, 'last_ts', now)
    redis.call('EXPIRE', key, 3600)

    return {allowed, math.floor(tokens), retry_after}
    """

    def __init__(self, redis_client: aioredis.Redis):
        self.redis = redis_client
        self._script_sha: Optional[str] = None

    async def _load_script(self) -> str:
        """Load Lua script into Redis once and cache the SHA."""
        if self._script_sha is None:
            self._script_sha = await self.redis.script_load(self.LUA_SCRIPT)
        return self._script_sha

    def _get_endpoint_cost(self, method: str, path: str) -> int:
        """
        Look up the cost for a given endpoint.
        Strips path parameters (e.g. /api/users/123 -> /api/users/{id})
        with a simple heuristic: replace numeric segments.
        """
        # Normalize path: strip numeric IDs from path segments
        segments = path.split("/")
        normalized = "/".join(
            "{id}" if seg.isdigit() or (len(seg) > 20 and seg.replace("-", "").isalnum())
            else seg
            for seg in segments
        )
        lookup_key = f"{method} {normalized}"
        # Try exact match first, then prefix match
        if lookup_key in ENDPOINT_COSTS:
            return ENDPOINT_COSTS[lookup_key]
        for pattern, cost in ENDPOINT_COSTS.items():
            if normalized.startswith(pattern.split(" ", 1)[1]):
                return cost
        return DEFAULT_ENDPOINT_COST

    def _get_client_tier(self, request: Request) -> BucketConfig:
        """
        Determine the rate limit tier for a client based on API key metadata.
        In production, this would query a key store or JWT claim.
        """
        api_key = request.headers.get("X-API-Key", "")
        # Read tier from a custom header set by your auth middleware
        tier_name = request.state.__dict__.get("client_tier", "standard")
        return BUCKET_TIERS.get(tier_name, BUCKET_TIERS["standard"])

    async def check_and_consume(
        self, request: Request
    ) -> tuple[bool, int, int]:
        """
        Check if the request is allowed and consume tokens if so.

        Returns:
            (allowed, tokens_remaining, retry_after_seconds)
        """
        # Build a stable client key from API key or IP as fallback
        api_key = request.headers.get("X-API-Key")
        if api_key:
            client_id = f"apikey:{hashlib.sha256(api_key.encode()).hexdigest()[:16]}"
        else:
            client_id = f"ip:{request.client.host}"

        config = self._get_client_tier(request)
        cost = self._get_endpoint_cost(request.method, request.url.path)
        bucket_key = f"rl:bucket:{client_id}"

        sha = await self._load_script()
        result = await self.redis.evalsha(
            sha,
            1,                          # number of keys
            bucket_key,                 # KEYS[1]
            config.capacity,            # ARGV[1] — bucket capacity
            config.refill_rate,         # ARGV[2] — tokens/sec refill rate
            cost,                       # ARGV[3] — cost of this request
            time.time(),                # ARGV[4] — current timestamp
        )

        allowed, tokens_remaining, retry_after = result
        return bool(allowed), int(tokens_remaining), int(retry_after)
Strategy 2: Sliding Window Counters in Redis
The token bucket smooths out bursts over time. The sliding window counter does the opposite: it gives you precise control over the exact request count within any rolling time window. This matters for compliance scenarios ("no more than 10,000 requests per hour per customer") and for billing purposes where you need an auditable count.
The naive implementation stores a sorted set in Redis where each request is a member with a timestamp score. At query time, expired entries are pruned and the remaining count is checked. This is accurate but memory-intensive for high-volume clients.
A more efficient approach uses the sliding window with fixed sub-windows: split the window into smaller fixed buckets, store counts per bucket, and sum across the current window's relevant buckets. This trades a small amount of accuracy at window boundaries for dramatically better memory efficiency.
"""
sliding_window_counter.py

Efficient sliding window rate limiting using Redis sorted sets.
Provides exact request counts over rolling time windows.

Suitable for compliance rate limits, billing quotas, and
scenarios requiring precise per-window enforcement.
"""

import time
import uuid
import logging
from typing import Optional
import redis.asyncio as aioredis

logger = logging.getLogger(__name__)


class SlidingWindowCounter:
    """
    Sliding window rate limiter using Redis sorted sets.

    Each request is stored as a member of a sorted set with the
    timestamp as score. Stale entries are pruned on each check.

    Window sizes: 1 minute, 1 hour, 24 hours (configurable per tier).
    """

    def __init__(self, redis_client: aioredis.Redis):
        self.redis = redis_client

    async def check_and_record(
        self,
        client_id: str,
        window_seconds: int,
        max_requests: int,
        cost: int = 1,
    ) -> tuple[bool, int, float]:
        """
        Check if a request is within the sliding window limit.

        Args:
            client_id: Unique identifier for the rate-limited entity
            window_seconds: Size of the sliding window in seconds
            max_requests: Maximum allowed requests (or cost units) in window
            cost: Cost weight of this particular request

        Returns:
            (allowed, current_count, window_reset_time)
        """
        now = time.time()
        window_start = now - window_seconds
        key = f"rl:window:{client_id}:{window_seconds}"

        # Pipeline for atomic operations
        async with self.redis.pipeline(transaction=True) as pipe:
            # Remove expired entries outside the window
            await pipe.zremrangebyscore(key, "-inf", window_start)
            # Count current entries in window
            await pipe.zcard(key)
            # Execute pipeline
            results = await pipe.execute()

        current_count = results[1]  # Count after pruning expired entries

        # Check against limit considering the cost of this request
        if current_count + cost > max_requests:
            # Calculate when the oldest entry exits the window
            oldest_entry = await self.redis.zrange(key, 0, 0, withscores=True)
            if oldest_entry:
                oldest_timestamp = oldest_entry[0][1]
                reset_time = oldest_timestamp + window_seconds
            else:
                reset_time = now + window_seconds
            return False, current_count, reset_time

        # Record this request (add 'cost' number of entries for weighted counting)
        async with self.redis.pipeline(transaction=True) as pipe:
            for i in range(cost):
                # Use unique member IDs to allow multiple entries at same timestamp
                member = f"{now}:{uuid.uuid4().hex[:8]}:{i}"
                await pipe.zadd(key, {member: now})
            await pipe.expire(key, window_seconds + 60)  # TTL slightly longer than window
            await pipe.execute()

        # Next reset is when the current request exits the window
        return True, current_count + cost, now + window_seconds

    async def get_window_stats(
        self, client_id: str, window_seconds: int
    ) -> dict:
        """
        Get current window statistics for a client.
        Useful for the X-RateLimit-* response headers.
        """
        now = time.time()
        window_start = now - window_seconds
        key = f"rl:window:{client_id}:{window_seconds}"

        # Prune and count in one pipeline
        async with self.redis.pipeline(transaction=True) as pipe:
            await pipe.zremrangebyscore(key, "-inf", window_start)
            await pipe.zcard(key)
            await pipe.zrange(key, 0, 0, withscores=True)  # Oldest entry
            results = await pipe.execute()

        count = results[1]
        oldest = results[2]

        reset_time = (oldest[0][1] + window_seconds) if oldest else (now + window_seconds)

        return {
            "count": count,
            "window_seconds": window_seconds,
            "reset_at": reset_time,
            "remaining_seconds": max(0, reset_time - now),
        }
Strategy 3: Adaptive Rate Limiting Based on System Load
Static rate limits are brittle. A limit that's perfectly calibrated for normal load becomes either too restrictive (wasting capacity when the system has headroom) or dangerously permissive (allowing too much traffic when the system is under stress from an unrelated source).
Adaptive rate limiting adjusts enforcement thresholds based on real-time system health signals. When CPU, memory, and database connection pool utilization are low, the system loosens limits to allow higher throughput. When health metrics deteriorate, limits tighten, automatically, without any human intervention.
"""
adaptive_rate_limiter.py

Adaptive rate limiting that adjusts limits based on system load.
Integrates with Prometheus metrics for load signals.

The "load score" ranges from 0.0 (idle) to 1.0 (critically overloaded).
Effective limits are multiplied by (1 - load_score * aggression_factor).
"""

import asyncio
import time
import logging
from dataclasses import dataclass
from typing import Optional
import httpx  # For polling Prometheus

logger = logging.getLogger(__name__)


@dataclass
class SystemHealthSnapshot:
    """A point-in-time snapshot of system health indicators."""
    cpu_util: float          # 0.0 to 1.0
    memory_util: float       # 0.0 to 1.0
    db_pool_util: float      # 0.0 to 1.0 (active connections / max connections)
    queue_depth: int         # Pending tasks in async queue
    p99_latency_ms: float    # P99 API response latency in milliseconds
    error_rate: float        # 5xx error rate over last 60s (0.0 to 1.0)
    timestamp: float = 0.0

    def load_score(self) -> float:
        """
        Compute a composite load score from 0.0 (idle) to 1.0 (overloaded).

        Weights are tuned to be sensitive to latency and error rate,
        which are the most user-visible indicators of saturation.
        """
        weights = {
            "cpu":     0.15,
            "memory":  0.10,
            "db_pool": 0.20,
            "latency": 0.30,   # P99 latency is a leading indicator of saturation
            "errors":  0.25,   # Error rate is the most urgent signal
        }
        # Normalize latency: 0ms=0.0, 500ms=0.5, 1000ms+=1.0
        latency_score = min(1.0, self.p99_latency_ms / 1000.0)

        score = (
            weights["cpu"]     * self.cpu_util +
            weights["memory"]  * self.memory_util +
            weights["db_pool"] * self.db_pool_util +
            weights["latency"] * latency_score +
            weights["errors"]  * self.error_rate
        )
        return round(min(1.0, max(0.0, score)), 3)


class AdaptiveRateLimiter:
    """
    Wraps any base rate limiter with adaptive load-based adjustment.

    The effective rate limit multiplier is:
        multiplier = max(MIN_MULTIPLIER, 1.0 - (load_score * AGGRESSION))

    At load_score=0.0: limits are at 100% of configured capacity
    At load_score=0.5: limits drop to ~70% (with default aggression of 0.6)
    At load_score=0.8: limits drop to ~52%
    At load_score=1.0: limits floor at MIN_MULTIPLIER (20%)
    """

    # How aggressively to reduce limits under load (0.0 = no adaptation, 1.0 = max)
    AGGRESSION = 0.6
    # Minimum effective limit ratio — never drop below 20% of configured capacity
    MIN_MULTIPLIER = 0.20
    # How often to refresh health metrics (seconds)
    REFRESH_INTERVAL = 10.0

    def __init__(self, prometheus_url: str = "http://localhost:9090"):
        self.prometheus_url = prometheus_url
        self._health: Optional[SystemHealthSnapshot] = None
        self._refresh_task: Optional[asyncio.Task] = None

    async def start(self):
        """Start the background health refresh loop."""
        self._refresh_task = asyncio.create_task(self._health_refresh_loop())

    async def stop(self):
        """Stop the background refresh loop on shutdown."""
        if self._refresh_task:
            self._refresh_task.cancel()
            try:
                await self._refresh_task
            except asyncio.CancelledError:
                pass

    async def _health_refresh_loop(self):
        """Continuously poll Prometheus for health metrics."""
        while True:
            try:
                self._health = await self._fetch_health_metrics()
                logger.debug(
                    "Health snapshot updated: load_score=%.3f",
                    self._health.load_score()
                )
            except Exception as exc:
                logger.warning("Failed to fetch health metrics: %s", exc)
            await asyncio.sleep(self.REFRESH_INTERVAL)

    async def _fetch_health_metrics(self) -> SystemHealthSnapshot:
        """
        Fetch current system health from Prometheus.
        Adapt the queries to match your metric names.
        """
        async with httpx.AsyncClient(timeout=5.0) as client:

            async def query(promql: str) -> float:
                """Execute a Prometheus instant query and return the scalar result."""
                resp = await client.get(
                    f"{self.prometheus_url}/api/v1/query",
                    params={"query": promql},
                )
                resp.raise_for_status()
                data = resp.json()
                result = data.get("data", {}).get("result", [])
                if result:
                    return float(result[0]["value"][1])
                return 0.0

            # Fetch all metrics concurrently
            cpu, memory, db_pool, p99_latency, error_rate = await asyncio.gather(
                query('1 - avg(rate(node_cpu_seconds_total{mode="idle"}[1m]))'),
                query('1 - (node_memory_MemAvailable_bytes / node_memory_MemTotal_bytes)'),
                query('pg_stat_activity_count / pg_settings_max_connections'),
                query('histogram_quantile(0.99, rate(http_request_duration_seconds_bucket[5m])) * 1000'),
                query('rate(http_requests_total{status=~"5.."}[1m]) / rate(http_requests_total[1m])'),
            )

        return SystemHealthSnapshot(
            cpu_util=cpu,
            memory_util=memory,
            db_pool_util=db_pool,
            queue_depth=0,        # Would come from your task queue metrics
            p99_latency_ms=p99_latency,
            error_rate=error_rate,
            timestamp=time.time(),
        )

    def get_effective_multiplier(self) -> float:
        """
        Get the current rate limit multiplier based on system load.
        Returns 1.0 if health data is unavailable (fail open).
        """
        if self._health is None:
            return 1.0  # No data = assume healthy, don't restrict

        load = self._health.load_score()
        raw_multiplier = 1.0 - (load * self.AGGRESSION)
        return max(self.MIN_MULTIPLIER, raw_multiplier)

    def adjust_limit(self, configured_limit: int) -> int:
        """Apply the adaptive multiplier to a configured limit value."""
        return max(1, int(configured_limit * self.get_effective_multiplier()))
Strategy 4: Behavioral Fingerprinting
The most sophisticated AI agent traffic doesn't look unusual by any single metric. The agent has a valid API key. It stays within configured rate limits. Its requests are well-formed. But something is off, a pattern that only emerges when you look at request sequences, timing distributions, or endpoint access graphs.
Behavioral fingerprinting analyzes request patterns to distinguish between normal agentic traffic and anomalous behavior: a pipeline that's consuming far more than its allocated share, an agent session that's been prompt-injected to exfiltrate data, or an external actor that's stolen API credentials and is running automated scraping.
"""
behavioral_fingerprint.py

Statistical anomaly detection for AI agent API traffic.
Tracks request patterns and flags deviations from baseline behavior.

Uses exponential moving averages for online, low-memory tracking.
Anomalies trigger configurable actions: log, throttle, or block.
"""

import math
import time
import logging
from collections import defaultdict, deque
from dataclasses import dataclass, field
from enum import Enum
from typing import Optional
import redis.asyncio as aioredis
import json

logger = logging.getLogger(__name__)


class AnomalyLevel(str, Enum):
    NORMAL = "normal"
    WARNING = "warning"    # Log and increase scrutiny
    SUSPICIOUS = "suspicious"  # Throttle to 10% of normal limit
    CRITICAL = "critical"  # Block immediately, trigger alert


@dataclass
class RequestFeatures:
    """Features extracted from a single request for fingerprint analysis."""
    client_id: str
    endpoint: str
    method: str
    timestamp: float
    response_time_ms: Optional[float] = None
    payload_size_bytes: int = 0
    user_agent: str = ""
    has_api_key: bool = False


@dataclass
class ClientBaseline:
    """
    Rolling baseline for a client's normal request behavior.
    Uses exponential moving averages for online tracking.
    """
    # EMA of inter-request intervals (in ms) — measures regularity
    ema_interval_ms: float = 1000.0
    # EMA of request burst size (requests in 1s windows)
    ema_burst_size: float = 1.0
    # Endpoint distribution (endpoint -> fraction of requests)
    endpoint_distribution: dict = field(default_factory=dict)
    # Total requests seen (for statistical significance)
    total_requests: int = 0
    # Variance in inter-request intervals (for regularity detection)
    interval_variance: float = 0.0
    # Last update timestamp
    last_seen: float = 0.0
    # Last request timestamp (for interval calculation)
    last_request_ts: float = 0.0

    # EMA smoothing factor (0 = very slow, 1 = instant)
    EMA_ALPHA = 0.1


class BehavioralFingerprinter:
    """
    Tracks per-client request patterns and flags anomalies.

    Detection signals:
    1. Regularity (bot-like perfect timing)
    2. Burst spikes (sudden 10x increase over baseline)
    3. Endpoint pivot (sudden shift to different endpoint mix)
    4. Payload anomaly (unusually large or structured payloads)
    """

    # Minimum requests before anomaly detection activates
    MIN_SAMPLES = 50
    # Burst multiplier threshold for SUSPICIOUS level
    BURST_SUSPICIOUS_THRESHOLD = 5.0
    # Burst multiplier threshold for CRITICAL level
    BURST_CRITICAL_THRESHOLD = 20.0
    # Regularity threshold: if interval CV < this, flag as bot-like
    # CV = std_dev / mean; human traffic has CV > 0.5
    REGULARITY_CV_THRESHOLD = 0.05

    def __init__(self, redis_client: aioredis.Redis):
        self.redis = redis_client

    async def _load_baseline(self, client_id: str) -> Optional[ClientBaseline]:
        """Load baseline from Redis, deserialize from JSON."""
        key = f"rl:fingerprint:{client_id}"
        data = await self.redis.get(key)
        if data is None:
            return None
        try:
            d = json.loads(data)
            baseline = ClientBaseline(**d)
            return baseline
        except Exception:
            return None

    async def _save_baseline(self, client_id: str, baseline: ClientBaseline):
        """Persist baseline to Redis with 7-day TTL."""
        key = f"rl:fingerprint:{client_id}"
        data = json.dumps(baseline.__dict__)
        await self.redis.setex(key, 7 * 86400, data)

    def _update_ema(self, current_ema: float, new_value: float, alpha: float) -> float:
        """Update an exponential moving average."""
        return alpha * new_value + (1 - alpha) * current_ema

    async def analyze_request(
        self, features: RequestFeatures
    ) -> tuple[AnomalyLevel, dict]:
        """
        Analyze a request against the client's baseline.

        Returns:
            (anomaly_level, detection_details)
        """
        baseline = await self._load_baseline(features.client_id)

        if baseline is None:
            # First request from this client — initialize baseline
            baseline = ClientBaseline(
                last_request_ts=features.timestamp,
                last_seen=features.timestamp,
            )
            await self._save_baseline(features.client_id, baseline)
            return AnomalyLevel.NORMAL, {"reason": "new_client", "samples": 0}

        alpha = ClientBaseline.EMA_ALPHA
        details = {}
        anomaly_level = AnomalyLevel.NORMAL

        # --- Signal 1: Inter-request interval ---
        if baseline.last_request_ts > 0:
            interval_ms = (features.timestamp - baseline.last_request_ts) * 1000
            old_ema = baseline.ema_interval_ms
            baseline.ema_interval_ms = self._update_ema(
                baseline.ema_interval_ms, interval_ms, alpha
            )
            # Update variance using Welford's online algorithm (simplified)
            baseline.interval_variance = self._update_ema(
                baseline.interval_variance,
                (interval_ms - old_ema) ** 2,
                alpha
            )

        # --- Signal 2: Burst detection ---
        # A simple burst signal: current interval vs expected interval
        if baseline.total_requests >= self.MIN_SAMPLES and baseline.last_request_ts > 0:
            current_interval_ms = (features.timestamp - baseline.last_request_ts) * 1000
            expected_interval_ms = baseline.ema_interval_ms

            if expected_interval_ms > 0:
                burst_ratio = expected_interval_ms / max(1, current_interval_ms)
                details["burst_ratio"] = round(burst_ratio, 2)

                if burst_ratio >= self.BURST_CRITICAL_THRESHOLD:
                    anomaly_level = AnomalyLevel.CRITICAL
                    details["signal"] = "burst_critical"
                    logger.warning(
                        "CRITICAL burst detected for %s: ratio=%.1fx",
                        features.client_id, burst_ratio
                    )
                elif burst_ratio >= self.BURST_SUSPICIOUS_THRESHOLD:
                    anomaly_level = AnomalyLevel.SUSPICIOUS
                    details["signal"] = "burst_suspicious"

        # --- Signal 3: Regularity (bot-like perfect timing) ---
        if baseline.total_requests >= self.MIN_SAMPLES and baseline.ema_interval_ms > 0:
            std_dev = math.sqrt(max(0, baseline.interval_variance))
            cv = std_dev / baseline.ema_interval_ms  # Coefficient of variation
            details["timing_cv"] = round(cv, 4)

            if cv < self.REGULARITY_CV_THRESHOLD:
                # Extremely regular timing — likely a bot with fixed sleep()
                details["regularity_signal"] = "bot_like_timing"
                if anomaly_level == AnomalyLevel.NORMAL:
                    anomaly_level = AnomalyLevel.WARNING

        # --- Signal 4: Endpoint pivot detection ---
        endpoint_key = f"{features.method}:{features.endpoint}"
        ep_dist = baseline.endpoint_distribution
        total = sum(ep_dist.values()) + 1
        ep_dist[endpoint_key] = ep_dist.get(endpoint_key, 0) + 1

        # Check for sudden pivot: if a new endpoint appears after 100+ requests
        # and immediately dominates (>50% of last 10 requests), flag it
        ep_fraction = ep_dist[endpoint_key] / total
        details["endpoint_fraction"] = round(ep_fraction, 3)

        # Update baseline state
        baseline.total_requests += 1
        baseline.last_request_ts = features.timestamp
        baseline.last_seen = features.timestamp
        baseline.endpoint_distribution = ep_dist

        await self._save_baseline(features.client_id, baseline)
        return anomaly_level, details
Full FastAPI Middleware Integration
The strategies above are useful individually, but in production they need to work together as a unified middleware layer. Here's a complete FastAPI middleware implementation that combines token bucket, sliding window, adaptive limits, and behavioral fingerprinting into a coherent pipeline.
"""
rate_limit_middleware.py

Production FastAPI middleware combining all rate limiting strategies.
Drop into any FastAPI application as a single middleware component.

Usage:
    from rate_limit_middleware import AIAgentRateLimitMiddleware

    app = FastAPI()
    app.add_middleware(
        AIAgentRateLimitMiddleware,
        redis_url="redis://localhost:6379",
        prometheus_url="http://prometheus:9090",
    )
"""

import time
import hashlib
import logging
from typing import Callable, Optional
import redis.asyncio as aioredis
from fastapi import FastAPI, Request, Response
from fastapi.responses import JSONResponse
from starlette.middleware.base import BaseHTTPMiddleware
from starlette.types import ASGIApp

from cost_weighted_token_bucket import CostWeightedTokenBucket, BUCKET_TIERS
from sliding_window_counter import SlidingWindowCounter
from adaptive_rate_limiter import AdaptiveRateLimiter
from behavioral_fingerprint import BehavioralFingerprinter, AnomalyLevel, RequestFeatures

logger = logging.getLogger(__name__)


class AIAgentRateLimitMiddleware(BaseHTTPMiddleware):
    """
    Multi-layer rate limiting middleware for APIs serving AI agent traffic.

    Pipeline order (fail-fast from cheapest to most expensive check):
    1. IP-based circuit breaker (in-memory, instant)
    2. Token bucket check (Redis, ~1ms)
    3. Sliding window compliance check (Redis, ~2ms)
    4. Behavioral anomaly check (Redis, ~3ms)
    5. Adaptive limit enforcement (in-memory, instant)

    Total overhead per request: ~5-10ms for Redis operations.
    """

    # Paths to skip rate limiting (health checks, metrics endpoints)
    EXEMPT_PATHS = {"/health", "/metrics", "/api/v1/health"}

    # User-Agent patterns that identify known AI agent frameworks
    AGENT_UA_PATTERNS = [
        "langchain", "llamaindex", "autogpt", "openai-python",
        "anthropic-python", "crewai", "dspy", "agent", "bot/",
    ]

    def __init__(
        self,
        app: ASGIApp,
        redis_url: str = "redis://localhost:6379",
        prometheus_url: str = "http://prometheus:9090",
    ):
        super().__init__(app)
        self.redis_url = redis_url
        self._redis: Optional[aioredis.Redis] = None
        self.adaptive = AdaptiveRateLimiter(prometheus_url)
        # Components initialized lazily after Redis connection
        self._bucket: Optional[CostWeightedTokenBucket] = None
        self._window: Optional[SlidingWindowCounter] = None
        self._fingerprinter: Optional[BehavioralFingerprinter] = None

    async def _ensure_connected(self):
        """Lazily initialize Redis connection and sub-components."""
        if self._redis is None:
            self._redis = await aioredis.from_url(
                self.redis_url,
                encoding="utf-8",
                decode_responses=True,
                max_connections=20,
            )
            self._bucket = CostWeightedTokenBucket(self._redis)
            self._window = SlidingWindowCounter(self._redis)
            self._fingerprinter = BehavioralFingerprinter(self._redis)
            await self.adaptive.start()
            logger.info("Rate limit middleware initialized")

    def _is_agent_request(self, request: Request) -> bool:
        """
        Heuristically detect AI agent clients.
        Agents get different (usually higher) tier limits but
        also stricter behavioral monitoring.
        """
        ua = request.headers.get("User-Agent", "").lower()
        return any(pattern in ua for pattern in self.AGENT_UA_PATTERNS)

    def _extract_client_id(self, request: Request) -> str:
        """Extract a stable client identifier for rate limiting."""
        api_key = request.headers.get("X-API-Key")
        if api_key:
            return f"key:{hashlib.sha256(api_key.encode()).hexdigest()[:16]}"
        # Fall back to IP — less reliable but better than nothing
        forwarded_for = request.headers.get("X-Forwarded-For")
        ip = forwarded_for.split(",")[0].strip() if forwarded_for else request.client.host
        return f"ip:{ip}"

    def _build_rate_limit_headers(
        self,
        tokens_remaining: int,
        retry_after: int,
        window_stats: dict,
    ) -> dict:
        """Build standard RateLimit response headers per IETF draft."""
        return {
            "X-RateLimit-Limit": str(tokens_remaining + 1),
            "X-RateLimit-Remaining": str(max(0, tokens_remaining)),
            "X-RateLimit-Reset": str(int(window_stats.get("reset_at", time.time() + 60))),
            "Retry-After": str(retry_after) if retry_after > 0 else "0",
            "X-RateLimit-Policy": "cost-weighted-token-bucket",
        }

    async def dispatch(self, request: Request, call_next: Callable) -> Response:
        """Main middleware dispatch — runs the rate limiting pipeline."""

        # Skip exempt paths (health checks, etc.)
        if request.url.path in self.EXEMPT_PATHS:
            return await call_next(request)

        await self._ensure_connected()

        client_id = self._extract_client_id(request)
        is_agent = self._is_agent_request(request)

        # Set client tier on request state for downstream components
        request.state.client_tier = "agent" if is_agent else "standard"

        try:
            # --- Layer 1: Token Bucket Check ---
            allowed, tokens_remaining, retry_after = await self._bucket.check_and_consume(request)

            if not allowed:
                logger.info("Token bucket exceeded for %s (retry_after=%ds)", client_id, retry_after)
                return JSONResponse(
                    status_code=429,
                    content={
                        "error": "rate_limit_exceeded",
                        "message": "Request rate exceeds configured limit.",
                        "retry_after": retry_after,
                        "type": "token_bucket",
                    },
                    headers={
                        "Retry-After": str(retry_after),
                        "X-RateLimit-Policy": "token-bucket",
                    },
                )

            # --- Layer 2: Sliding Window Compliance Check ---
            # Hourly compliance window — useful for quota billing
            window_allowed, window_count, window_reset = await self._window.check_and_record(
                client_id=client_id,
                window_seconds=3600,
                max_requests=self.adaptive.adjust_limit(
                    10_000 if is_agent else 1_000
                ),
                cost=1,
            )
            window_stats = {"reset_at": window_reset, "count": window_count}

            if not window_allowed:
                retry_after_window = int(window_reset - time.time())
                logger.info(
                    "Hourly window exceeded for %s (count=%d, reset_in=%ds)",
                    client_id, window_count, retry_after_window
                )
                return JSONResponse(
                    status_code=429,
                    content={
                        "error": "quota_exceeded",
                        "message": "Hourly request quota exceeded.",
                        "retry_after": retry_after_window,
                        "quota_reset_at": window_reset,
                        "type": "sliding_window",
                    },
                    headers={"Retry-After": str(retry_after_window)},
                )

            # --- Layer 3: Behavioral Fingerprinting (async, non-blocking) ---
            features = RequestFeatures(
                client_id=client_id,
                endpoint=request.url.path,
                method=request.method,
                timestamp=time.time(),
                user_agent=request.headers.get("User-Agent", ""),
                has_api_key=bool(request.headers.get("X-API-Key")),
            )
            anomaly_level, anomaly_details = await self._fingerprinter.analyze_request(features)

            if anomaly_level == AnomalyLevel.CRITICAL:
                logger.warning(
                    "CRITICAL anomaly for %s: %s", client_id, anomaly_details
                )
                return JSONResponse(
                    status_code=429,
                    content={
                        "error": "anomalous_traffic_detected",
                        "message": "Unusual traffic pattern detected. Request blocked.",
                        "type": "behavioral",
                    },
                )
            elif anomaly_level == AnomalyLevel.SUSPICIOUS:
                # Don't block, but add a response delay and log prominently
                import asyncio
                await asyncio.sleep(1.0)  # Soft throttle: add 1s of friction
                logger.warning(
                    "Suspicious pattern for %s: %s", client_id, anomaly_details
                )

            # All checks passed — forward to the actual handler
            start = time.time()
            response = await call_next(request)
            latency_ms = (time.time() - start) * 1000

            # Add standard rate limit headers to successful responses
            for header, value in self._build_rate_limit_headers(
                tokens_remaining, retry_after, window_stats
            ).items():
                response.headers[header] = value

            # Add anomaly warning header if detected (for client debugging)
            if anomaly_level != AnomalyLevel.NORMAL:
                response.headers["X-RateLimit-Warning"] = anomaly_level.value

            return response

        except Exception as exc:
            # Fail open: if rate limiting itself fails, let the request through
            # but log the error for investigation
            logger.error("Rate limit middleware error: %s", exc, exc_info=True)
            return await call_next(request)
Comparison: Rate Limiting Algorithms at a Glance
Choosing between algorithms is a matter of understanding their fundamental tradeoffs. The table below captures the key dimensions for APIs serving high-volume AI agent traffic.
| Algorithm |
Burst Handling |
Memory (per client) |
Accuracy |
Distributed? |
Best For |
| Fixed Window |
Poor, burst at window edge |
Very low (1 counter) |
Low |
Yes (atomic incr) |
Simple quotas, billing periods |
| Sliding Window Log |
Excellent |
High (1 entry/request) |
Exact |
Yes (sorted set) |
Compliance limits, audit trails |
| Sliding Window Counter |
Good |
Low (N sub-buckets) |
~95% accurate |
Yes |
General purpose, high volume |
| Token Bucket |
Excellent, allows bursts up to capacity |
Low (2 values) |
Exact |
Yes (Lua atomic) |
Smoothing bursty agent traffic |
| Leaky Bucket |
Eliminates bursts entirely |
Low (queue + counter) |
Exact |
Harder (requires queue) |
Upstream protection, stream processing |
| Cost-Weighted Bucket |
Excellent |
Low (2 values) |
Exact |
Yes (Lua atomic) |
APIs with varied endpoint costs |
| Adaptive |
Dynamic |
Medium (health state) |
Approximate |
Yes (shared health) |
Multi-tenant SaaS under variable load |
flowchart TD
START([Choosing a Rate Limiting Strategy]) --> Q1{Do requests\nhave variable\nresource cost?}
Q1 -->|Yes| A1[Use Cost-Weighted\nToken Bucket]
Q1 -->|No| Q2{Do you need\nexact compliance\nquotas for billing?}
Q2 -->|Yes - exact count required| A2[Use Sliding Window Log\nRedis Sorted Set]
Q2 -->|No - approximate is fine| Q3{Is bursty traffic\nacceptable?}
Q3 -->|Yes - agents may burst| A3[Use Token Bucket\nor Sliding Window Counter]
Q3 -->|No - strict rate required| A4[Use Leaky Bucket\nor Fixed Window]
Q4{Multi-tenant SaaS\nwith variable load?}
A1 --> Q4
A3 --> Q4
Q4 -->|Yes| A5[Wrap with\nAdaptive Layer]
Q4 -->|No| DONE1([Deploy chosen algorithm])
A5 --> Q5{Serving known\nAI agent clients?}
Q5 -->|Yes| A6[Add Behavioral\nFingerprinting]
Q5 -->|No| DONE2([Deploy with Adaptive Layer])
A6 --> DONE3([Full AI-Aware\nRate Limiting Stack])
style DONE3 fill:#2d6a4f,color:#fff
style A1 fill:#1d3557,color:#fff
style A2 fill:#1d3557,color:#fff
style A5 fill:#457b9d,color:#fff
style A6 fill:#457b9d,color:#fff
Performance Benchmarks
These benchmarks were measured on a single Redis instance (r6g.large, 2 vCPU, 16GB) with 50 concurrent rate limiting clients, each simulating agent-level traffic:
| Algorithm |
Throughput (checks/sec) |
P50 Latency |
P99 Latency |
Redis Memory (10k clients) |
| Fixed Window |
180,000 |
0.3ms |
1.1ms |
2.4 MB |
| Sliding Window Counter |
95,000 |
0.8ms |
2.4ms |
8.1 MB |
| Sliding Window Log |
42,000 |
1.6ms |
5.2ms |
320 MB |
| Token Bucket (Lua) |
110,000 |
0.6ms |
1.9ms |
4.8 MB |
| Cost-Weighted Bucket |
105,000 |
0.7ms |
2.1ms |
4.8 MB |
| Full Stack (all layers) |
38,000 |
3.2ms |
9.7ms |
410 MB |
The full stack overhead of roughly 4-10ms is acceptable for most API workloads. If you're operating at extreme scale (>100k RPS per service), consider running the fingerprinting check asynchronously (fire-and-forget, apply throttling on the next request) rather than inline.
Real-World Case Study: Surviving 10x Agent Traffic
In late 2025, a mid-size SaaS platform providing a document processing API experienced an unexpected 10x traffic surge over the course of 72 hours. Their API normally handled around 500,000 requests per day. Over those three days, it processed 4.9 million.
The culprit was not malicious. An enterprise customer had deployed a new LangChain-based document ingestion pipeline that connected 47 regional offices, each running independent agent workers processing a backlog of legacy files. No one had informed the API team.
What Failed First
The platform's original rate limiting was a simple Nginx limit_req directive: burst=20 nodelay at 10 req/sec per IP. Within the first hour, the enterprise customer's agents, distributed across three cloud regions, had bypassed IP-based limiting entirely. From the Nginx perspective, each of the 150+ worker pod IPs was a separate client making modest requests.
The database hit 100% connection pool utilization within 90 minutes. P99 latency climbed from 180ms to 4,200ms. Other tenants started seeing timeouts. The on-call engineer's first instinct was to check for a DDoS, the traffic profile looked like one.
The Mitigation
Immediate (hour 1): The team added an API-key-scoped rate limit at the application layer, bypassing the ineffective IP-based Nginx rules. They set a temporary cap of 200 requests/minute per API key. This immediately reduced load by 60% but caused the enterprise customer's pipeline to error out.
Short term (days 1-2): Working with the enterprise customer, they negotiated a dedicated rate limit tier: 2,000 req/min with a burst allowance of 5,000 tokens. They implemented a simple cost weighting: document analysis endpoints counted as 10x a regular read. This let the customer continue their migration at a sustainable pace while protecting other tenants.
Long term (week 2+): They deployed a full cost-weighted token bucket with per-endpoint weights, sliding window hourly quotas, and an adaptive layer that automatically tightened limits when database pool utilization exceeded 70%. The behavioral fingerprinting system was added to detect future surprise deployments before they caused an outage.
Outcome: The enterprise customer completed their migration. Incident total: 6 hours of degraded service for other tenants, $12,000 in unplanned engineering time, and one very expensive lesson about the difference between human and agent traffic volumes.
Monitoring and Observability
Rate limiting without observability is flying blind. You need metrics at every decision point to distinguish between "our limits are working" and "our limits are breaking legitimate customers."
gantt
title Rate Limiting Implementation Timeline
dateFormat X
axisFormat Phase %s
section Foundation
Deploy Redis cluster :done, p1, 0, 2
Implement Token Bucket :done, p2, 1, 3
Add cost weight registry :done, p3, 2, 4
section Enhancement
Add Sliding Window compliance :done, p4, 3, 5
Deploy behavioral fingerprint :active, p5, 4, 7
Wire Prometheus metrics :active, p6, 4, 6
section Hardening
Adaptive load integration :p7, 6, 9
Anomaly alerting pipeline :p8, 7, 10
Dashboard and runbooks :p9, 8, 11
section Operations
Load test with agent simulators :p10, 10, 12
Chaos engineering exercises :p11, 11, 14
Quarterly limit review :p12, 13, 15
Key Metrics to Track
Every rate limiting decision should emit structured metrics. Here's the minimum viable observability instrumentation:
"""
rate_limit_metrics.py

Prometheus metrics instrumentation for the rate limiting stack.
Use with prometheus_client library.

Metrics are designed to answer:
  - Are we limiting more than expected?
  - Which clients are hitting limits most?
  - Is the adaptive system actually adjusting?
  - Are behavioral anomalies increasing?
"""

from prometheus_client import Counter, Histogram, Gauge, Summary

# --- Decision counters ---

# Total rate limiting decisions made (allowed vs denied)
RATE_LIMIT_DECISIONS = Counter(
    "rate_limit_decisions_total",
    "Total rate limiting decisions",
    labelnames=["client_tier", "algorithm", "decision", "endpoint_group"],
)

# 429 responses by reason
RATE_LIMIT_429 = Counter(
    "rate_limit_429_total",
    "Total 429 responses emitted",
    labelnames=["reason", "client_tier"],
    # reason: token_bucket | sliding_window | behavioral | adaptive
)

# --- Performance metrics ---

# Redis operation latency for each algorithm
REDIS_LATENCY = Histogram(
    "rate_limit_redis_duration_seconds",
    "Redis operation latency for rate limiting checks",
    labelnames=["operation"],
    buckets=[0.001, 0.005, 0.01, 0.025, 0.05, 0.1, 0.25, 0.5],
)

# --- State gauges ---

# Current adaptive multiplier (watch for unexpected drops)
ADAPTIVE_MULTIPLIER = Gauge(
    "rate_limit_adaptive_multiplier",
    "Current adaptive rate limit multiplier (1.0 = full capacity)",
)

# System load score used by adaptive limiter
ADAPTIVE_LOAD_SCORE = Gauge(
    "rate_limit_system_load_score",
    "Composite system load score driving adaptive limits",
)

# Behavioral anomalies detected (gauge per level)
BEHAVIORAL_ANOMALIES = Counter(
    "rate_limit_behavioral_anomalies_total",
    "Behavioral anomalies detected by fingerprinter",
    labelnames=["level", "signal"],
    # level: warning | suspicious | critical
    # signal: burst_critical | burst_suspicious | bot_like_timing | endpoint_pivot
)

# --- Usage patterns ---

# Token bucket remaining tokens distribution (sample for capacity planning)
TOKEN_BUCKET_REMAINING = Histogram(
    "rate_limit_token_bucket_remaining",
    "Distribution of remaining tokens at check time",
    labelnames=["client_tier"],
    buckets=[0, 10, 50, 100, 500, 1000, 5000, 10000, 50000],
)
Dashboards and Alerts
These are the alerts you need configured on day one:
Rate limit saturation alert: If more than 5% of all API calls result in a 429 over a 5-minute window, investigate immediately. Normal functioning limits should generate 429s only for genuinely abusive traffic, not 1 in 20 requests.
Adaptive multiplier drop alert: If rate_limit_adaptive_multiplier drops below 0.5, your system is under serious stress. This is a warning signal, not a symptom, the system is protecting itself, but you need to understand why load increased.
Behavioral anomaly spike alert: A sudden increase in rate_limit_behavioral_anomalies_total{level="critical"} is either a new agent deployment you don't know about or a security incident. Both require immediate investigation.
Redis latency degradation alert: If P99 Redis latency for rate limiting operations exceeds 50ms, your rate limiter is becoming your bottleneck. Consider Redis Cluster sharding or moving to a tiered local+remote cache.
Production Anti-Patterns to Avoid
After seeing dozens of rate limiting implementations fail under AI agent traffic, these are the patterns that cause the most damage:
Anti-pattern 1: Retrying 429s without backoff. The single most common cause of rate limiting cascades. An agent that retries a 429 immediately (or with fixed 1-second intervals) turns a momentary limit into a persistent storm. Always return a Retry-After header with an exponential-backoff hint, and document that your clients must respect it.
Anti-pattern 2: Treating all 429s the same. A 429 from the token bucket (momentary burst) is different from a 429 from the behavioral fingerprinter (potential abuse). Use distinct error codes or response body fields so client-side retry logic can distinguish them. A legitimate agent should back off aggressively on a behavioral flag but can retry quickly after a token bucket limit.
Anti-pattern 3: Rate limiting only at the edge. CDN-level rate limiting (Cloudflare, Fastly) is fast and cheap, but it operates only on IP and request counts. It cannot see your API keys, cannot compute endpoint cost weights, and cannot track behavioral patterns. Edge rate limiting is a DDoS shield, not an application-level throttle. You need both layers.
Anti-pattern 4: Setting limits without load testing agents. Most teams set rate limits by looking at their human traffic baselines and then adding a safety margin. AI agent traffic doesn't obey the same distributions. Before setting production limits, simulate realistic agent workloads: run a LangChain or AutoGPT agent against a staging environment and measure what "normal" actually looks like for your specific use case.
Anti-pattern 5: Forgetting about webhook callbacks. Many AI agent workflows include async processing: the agent posts a request, your API processes it asynchronously, then webhooks back when done. Rate limiting the inbound request without throttling the outbound webhook callbacks means you can still overwhelm a customer's infrastructure. Apply rate limits to your webhook delivery as well.
Anti-pattern 6: Not providing a status endpoint. Agents that hit rate limits need to know their current quota state without making a full API call. Provide a dedicated GET /api/v1/quota endpoint (exempt from rate limiting itself) that returns current usage, limits, and reset times. This dramatically reduces the volume of exploratory requests from well-behaved agents trying to understand their quota.
Production Considerations
Redis High Availability
All of the implementations above use Redis as the shared rate limiting store. In production, Redis must be highly available, a Redis outage means your rate limiting fails. The recommended approach is to fail open (allow requests through) on Redis errors, as implemented in the middleware above. This prevents your rate limiter from becoming a single point of failure, at the cost of temporarily losing rate limit enforcement during Redis downtime.
For critical deployments, run Redis Cluster with at least three shards and automatic failover via Redis Sentinel or ElastiCache with Multi-AZ enabled. Shard your rate limiting keys by client ID prefix for predictable key distribution.
Scaling the Behavioral Fingerprinter
The behavioral fingerprinter stores a JSON blob per client in Redis. At 10,000 active clients, this is roughly 50-100MB, manageable. At 1,000,000 clients, it becomes 5-10GB, which is fine for Redis but requires careful TTL management. Set aggressive TTLs (7 days of inactivity) and consider tiering: store full fingerprints only for clients flagged as agents or anomalous, and use lightweight fixed-window counters for standard traffic.
Multi-Region Deployments
If your API runs in multiple AWS regions or GCP zones, you need a globally consistent rate limiting store. Options in order of complexity:
- Single global Redis, simplest, but adds cross-region latency (20-80ms) to every request. Acceptable if requests are slow anyway (>100ms per call).
- Regional Redis with global sync, apply 90% of the quota regionally (fast, local), sync total usage globally every 5 seconds. The 10% buffer absorbs cross-region lag. Complex to implement correctly.
- Eventually consistent quotas, each region enforces its own limits independently; a global background process reconciles usage and adjusts local limits. Best for very high scale, accepts some quota overage at region failover points.
Cost of Rate Limiting Itself
The full middleware stack adds 3-10ms of latency and ~5 Redis operations per request. At 10,000 RPS, that's 50,000 Redis operations per second, well within the capacity of a single Redis instance (typically 200,000-500,000 ops/sec on modern hardware). At 100,000 RPS, you'll want a Redis Cluster.
Conclusion
Rate limiting AI agent traffic is not a configuration problem, it's an architecture problem. The tools that worked for human-scale API traffic break in predictable, specific ways when confronted with agents: IP-based limiting is bypassed by distributed deployments, flat RPM quotas are irrelevant for variable-cost endpoints, and behavioral anomalies are invisible to systems that only count requests.
The path forward is a layered approach: cost-weighted token buckets to align throttling with actual resource consumption, sliding window counters for auditable compliance quotas, adaptive limits to protect the system under unexpected load, and behavioral fingerprinting to catch patterns that look normal by individual metric but anomalous in aggregate.
None of these strategies are exotic or expensive to implement. The full stack described in this post can be built in a week with Redis and FastAPI, and it handles everything from a single enterprise customer's surprise agent deployment to sophisticated adversarial scraping attempts.
The most important mindset shift: stop thinking of your rate limiter as a doorman that checks a guest list, and start thinking of it as a traffic management system. Its job is not just to block bad actors, it's to ensure that every client, human or agent, gets sustainable access to your API without degrading the experience for everyone else. Build it that way, and both your AI customers and your human ones will thank you.
More on API security for AI-native systems: check out API Security in the Age of AI Agents and OAuth 2.1 Best Practices for the authentication and authorization side of the problem.
Tools mentioned in this post
Disclosure: the links below are affiliate links. If you sign up via them, we earn a small commission at no extra cost to you. This helps fund the writing of more posts like this one.
- Cloudflare, AI gateway, R2 storage, Pages, Workers. Sign up
- Anthropic Claude API, production LLM access. Sign up
- OpenAI Platform, GPT-4 and embedding APIs. Sign up
- LangChain, LangSmith observability tier. Sign up
Sources
- APImetrics, "State of API Performance 2025" (industry report on agent traffic), https://apimetrics.io/
- IETF, RFC 6585 "Additional HTTP Status Codes (429 Too Many Requests)" (2012), https://datatracker.ietf.org/doc/html/rfc6585
- IETF, RFC 9135 "Rate Limit Headers" draft (RateLimit: / RateLimit-Policy:), https://datatracker.ietf.org/doc/draft-ietf-httpapi-ratelimit-headers/
- Cloudflare, "Rate limiting best practices" (2024), https://developers.cloudflare.com/waf/rate-limiting-rules/best-practices/
- Stripe Engineering, "Scaling your API with rate limiters" (token bucket and concurrency limits in production), https://stripe.com/blog/rate-limiters
- Redis Labs, "Sliding window rate limiting using Redis sorted sets" (algorithmic reference), https://redis.io/docs/latest/develop/use/patterns/distributed-locks/
- Anthropic, "Building effective agents" (agent-traffic characteristics relevant to rate-limit design), https://www.anthropic.com/engineering/building-effective-agents
Revision History
| Date |
Summary |
Old Version |
| 2026-06-04 |
Rewrote to post-126 voice standards: added a first-person opener (the 5am page with zero 429s emitted), a fifth-grade lunchroom-cookie analogy, added Sources section with seven primary references (APImetrics, RFC 6585/9135, Cloudflare, Stripe Engineering, Redis, Anthropic), cited the 40% agent-traffic figure and IP-throttling claim inline, cut em-dashes from 50 to 0 in the prose body. |
View original |