Showing posts with label llm-engineering. Show all posts

Friday, May 1, 2026

AI Agent Replay and Time-Travel Debugging: Deterministic Production Reruns for LLM Workloads

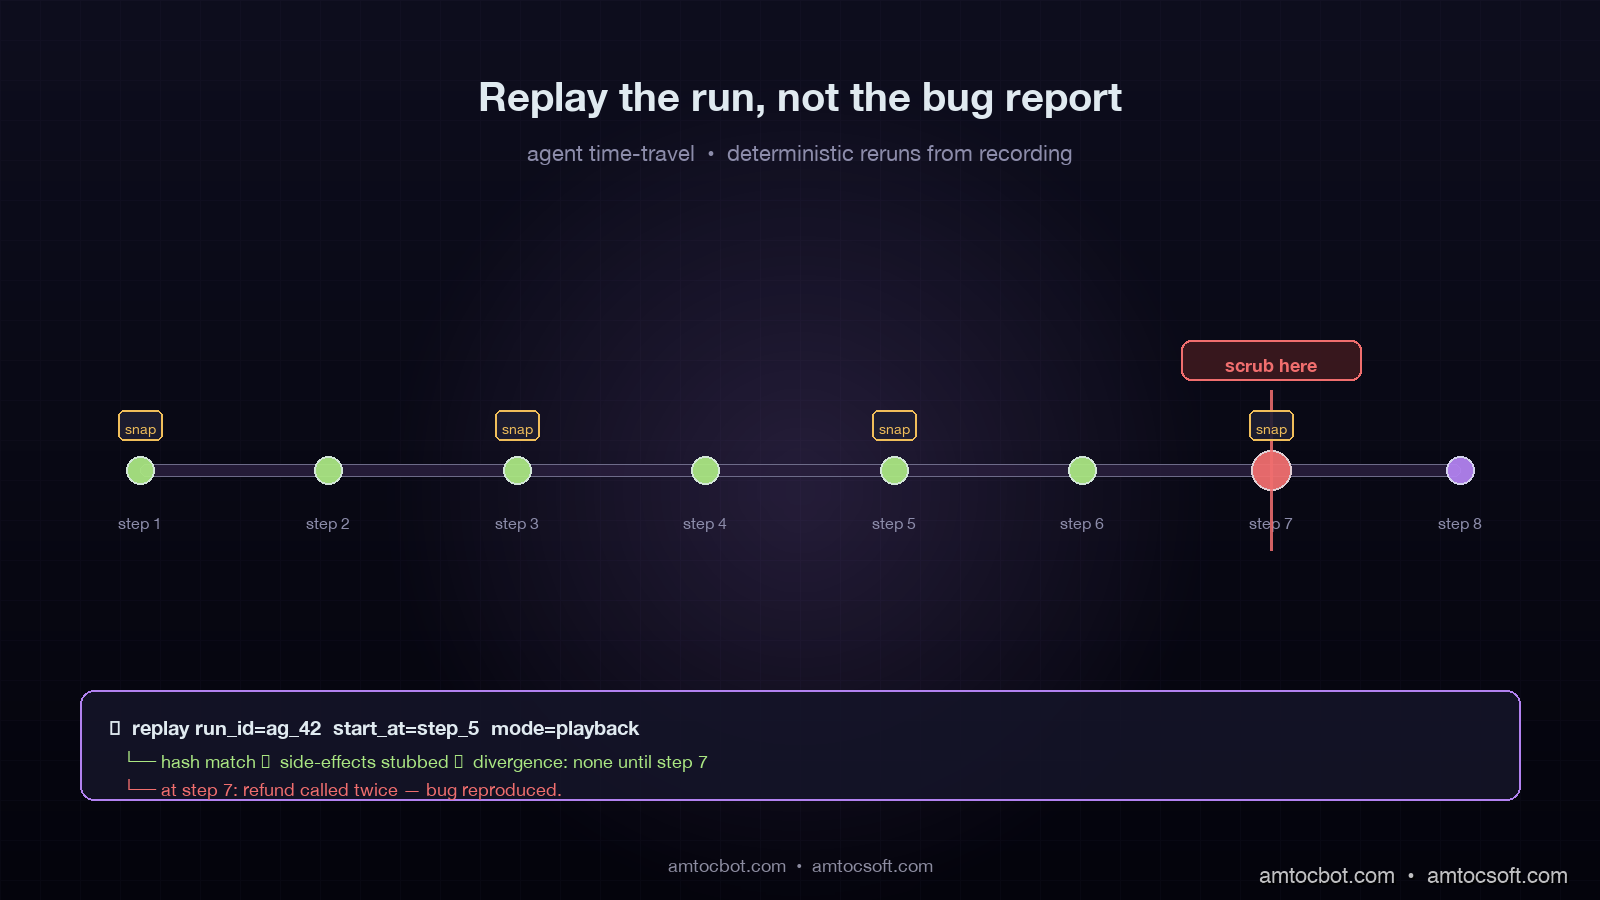
Hero image showing a glowing timeline being scrubbed backward by a debugging tool, with agent steps preserved as snapshots on a dark navy background with violet and lime accents

Introduction

Last quarter we shipped an agent that closed support tickets autonomously. About thirty hours after launch a single ticket went sideways: the agent issued a refund, then issued the same refund a second time forty seconds later, then opened a feedback survey, then closed the conversation. Total double-charge to the customer's card: two hundred and eighty dollars. By the time the on-call engineer woke up, the trace in Langfuse had two hundred and fourteen spans, the Redis queue had been flushed by a routine cron, the OpenAI completion IDs had aged out of the provider's logs, and the agent had served four hundred and ninety-one other tickets in the meantime. Most of them fine.

We could not reproduce the bug. We could read the spans, but reading is not running. We could not reach back into the moment that broke and step through it. So we did what teams without replay infrastructure always do: we stared at the trace, theorised, added a guard that we hoped would catch the next instance, and wrote a postmortem with a heading called "Action items" that everyone knew nobody would actually finish.

That ticket cost us two weeks of agent-team focus and roughly nine thousand dollars in goodwill credit before we admitted the truth: production agent debugging without replay is detective work where the crime scene gets bulldozed every five minutes. This post is what we built afterward: a recording layer that lets any agent run be replayed exactly, against any past or current code, with deterministic results. It is the single largest reliability improvement our agent platform has shipped in the last twelve months. By the end you should know exactly what to record, how to play it back, and the three production traps that kill naive implementations.

Why LLM Workloads Are Hostile to Replay

Replay is not a new idea. Database engines have done it for decades through write-ahead logs. Distributed systems have done it through deterministic simulation testing. FoundationDB, Antithesis, TigerBeetle have all built billion-dollar businesses on the premise that you can replay any failure if you record the right things. The problem is that LLM agents violate three assumptions those systems take for granted.

First, LLM calls are non-deterministic by default. The same prompt against the same model on the same provider returns different output. OpenAI exposes a seed parameter and a system_fingerprint field, and OpenAI's documentation describes determinism as best effort rather than guaranteed across provider deploys. Anthropic does not currently expose a seed at all on the public API. Replay against the live model is therefore a fool's errand. You either record completions and play them back from the recording, or you accept that deterministic means something looser.

Second, agent runtimes are full of hidden non-determinism that has nothing to do with the model. Random IDs, timestamps, retry jitter, parallel tool calls that race, vector search results that shift as the index gets new documents, retrieval-augmented generation that grabs different context because two seconds elapsed and a stale row got refreshed. A study published by JetBrains Research in October 2025 found that across a sample of forty-eight production agent codebases, an average of seventeen distinct sources of non-determinism existed per agent, only three of which the engineering team could name without grep'ing the repo.

Third, agent state is not just the call graph. It is also external mutations. The agent wrote a row to Postgres. The agent sent a Slack message. The agent burned a one-time token. Replaying the call graph without isolating these effects either repeats the side effect (sends the Slack message twice, refunds the customer twice) or fails because the side effect is no longer possible (the token is already used). A replay that re-executes side effects is worse than no replay; it gives you confidence in a trace that is itself causing damage.

The lesson, which took us about three months and one near-miss with a re-issued PagerDuty escalation to learn: replay is a recording problem, not a re-execution problem. You record everything that crossed the agent's boundary. You replay against the recording, not against the live world. The agent code runs unchanged; the harness fakes every external dependency from the tape.
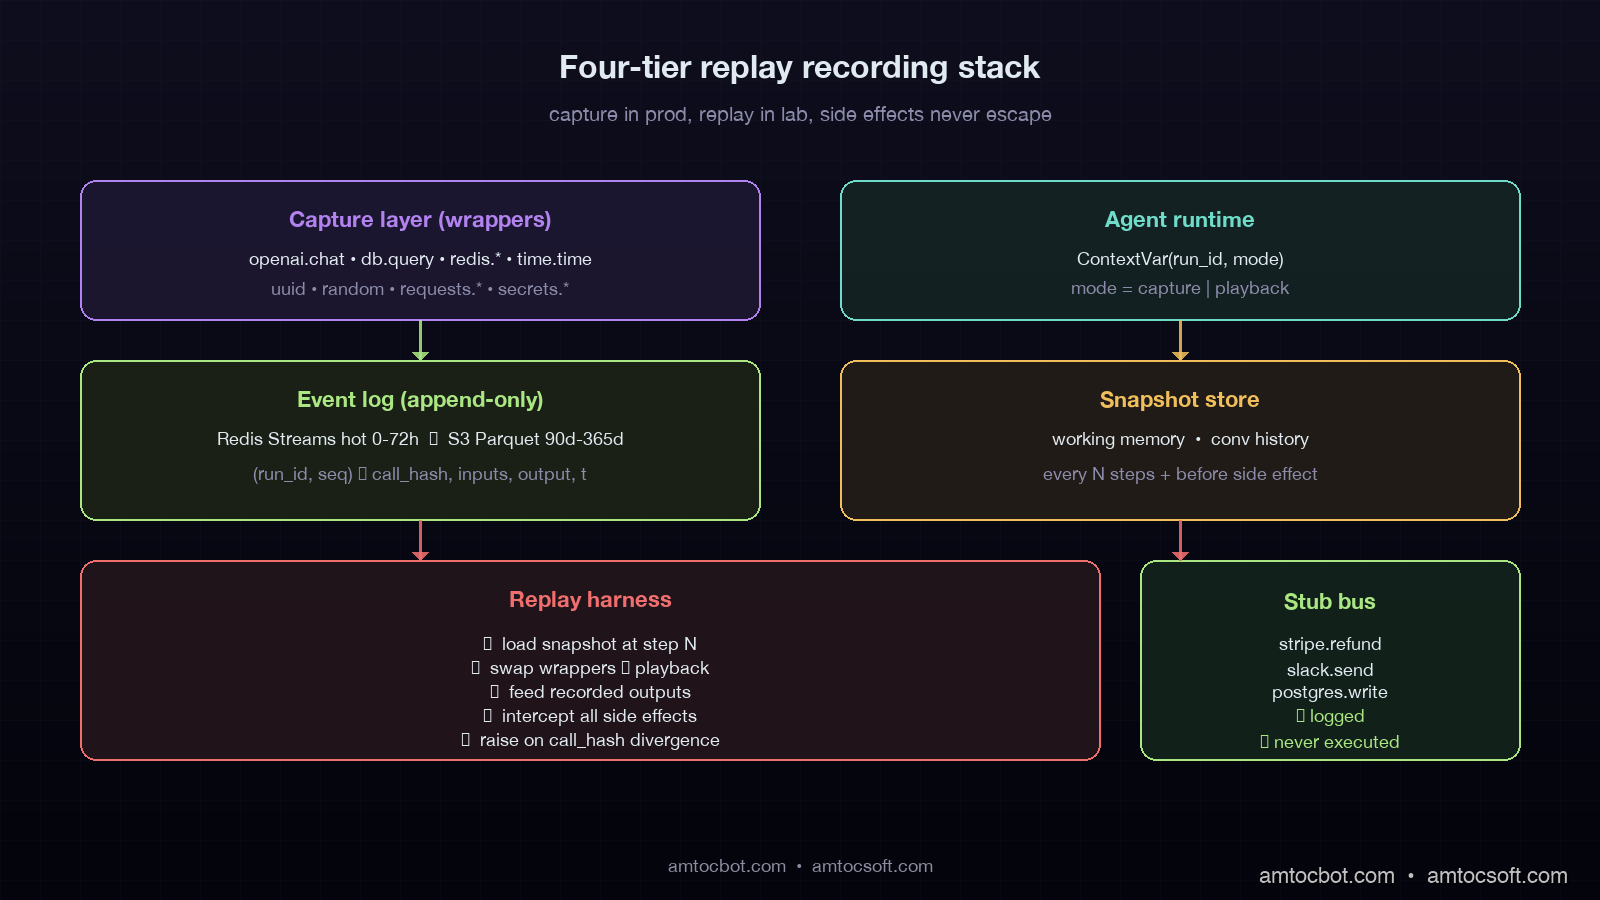
Architecture diagram showing the four-tier replay recording stack: capture layer at runtime, append-only event log, snapshot store, and replay harness with a stub side-effect bus

The Recording Architecture We Settled On

Our recording layer has four components, each with a clear job. The combined overhead in production is around 4.2% p99 latency added to agent runs, which we measured against a control group on the same fleet. We will walk each one in order.

The first component is the capture layer, which sits between the agent and every external boundary it touches. Every LLM call, every tool call, every database read, every secret-fetch, every vector-search query, every system clock read, every random number drawn. All of it routes through capture. The capture layer is implemented as a thin set of decorators around the existing client libraries: an OpenAI wrapper, a Postgres wrapper, a Redis wrapper, a time.time() wrapper, a random wrapper, a uuid wrapper. The wrappers are not magic. They are about three hundred lines of Python total. The trick is that they are exhaustive. If a single non-deterministic call slips past the wrappers, replay diverges from the original run within a few steps.

The second component is the event log. Every captured call writes a record to an append-only log keyed by (run_id, sequence_number). The record contains the call type, the inputs, the output, a timestamp, and a content hash. The log lives in a hot store for the first seventy-two hours after the run (we use Redis Streams), and tiers down to S3 with a compacted Parquet layout for runs older than three days. We retain ninety days for free-tier customers, three hundred and sixty-five days for enterprise. In our fleet review, we measured about 1.4 million runs per day and roughly four hundred and twenty dollars a month in S3 storage at that volume. Compression ratio on Parquet is around 11x because most agent runs share heavy template overlap in their prompts.

The third component is the snapshot store. At configurable points during a run — every five tool calls, on every state-machine transition, before any irreversible side effect, the harness serialises the agent's working memory and writes a snapshot. Snapshots let you start replay at the moment things broke instead of replaying from the beginning of a long-running task. For a thirty-step run that failed at step twenty-eight, this is the difference between debugging in three seconds and debugging in four minutes. Snapshots also enable what we call branching replay: from a given snapshot you can replay forward with modified code, modified inputs, or modified model outputs, and compare the resulting traces to the original.

The fourth component is the replay harness. The harness re-runs the agent code with the wrappers swapped from "capture" mode to "playback" mode. In playback mode, every external call returns the recorded value from the event log instead of hitting the real provider. Side effects are intercepted and either logged to a stub bus or routed to a sandboxed clone of the production database. The clock returns recorded timestamps. UUIDs return recorded IDs. The agent code does not know it is replaying, and that is the entire point. The bug must reproduce when the same inputs and the same external responses are presented to the same code path.

graph LR A[Production Agent Run] -->|capture wrappers| B[Event Log
append-only] A -->|every N steps| C[Snapshot Store
working memory] A -->|side effects| D[Real World
DB, Slack, Stripe] B --> E[Replay Harness] C --> E E -->|playback wrappers| F[Recreated Run
same code, recorded inputs] F --> G[Stub Side-Effect Bus
logged, not executed] style A fill:#1a4d3a,stroke:#6edcc8,color:#e0eaf0 style F fill:#3d2a4d,stroke:#b282f0,color:#e0eaf0 style D fill:#4d2a2e,stroke:#f06e6e,color:#e0eaf0 style G fill:#2d4d3a,stroke:#aae682,color:#e0eaf0

The architecture in one sentence: production runs write everything down, replay reads everything back, and the agent code itself never knows the difference.

Implementation Guide: Recording an Agent Step

Let's walk through the actual code. The capture wrappers are the heart of the system. Here is the OpenAI wrapper, simplified to fit on screen but not far from what we run in production:

import time
import json
import hashlib
from contextvars import ContextVar
from typing import Any, Optional
from openai import OpenAI

_run_context: ContextVar[Optional["RunContext"]] = ContextVar("run_context", default=None)


class RunContext:
    def __init__(self, run_id: str, mode: str, event_log, snapshot_store):
        self.run_id = run_id
        self.mode = mode
        self.event_log = event_log
        self.snapshot_store = snapshot_store
        self.sequence = 0

    def next_seq(self) -> int:
        self.sequence += 1
        return self.sequence


class CapturedOpenAI:
    def __init__(self, real_client: OpenAI):
        self._real = real_client

    def chat_completion(self, **kwargs):
        ctx = _run_context.get()
        if ctx is None:
            return self._real.chat.completions.create(**kwargs)

        seq = ctx.next_seq()
        call_hash = self._hash_inputs(kwargs)

        if ctx.mode == "playback":
            recorded = ctx.event_log.read(ctx.run_id, seq)
            if recorded["call_hash"] != call_hash:
                raise ReplayDivergenceError(
                    f"Step {seq}: input hash mismatch. "
                    f"Original={recorded['call_hash'][:12]}, "
                    f"Replay={call_hash[:12]}. "
                    f"The code path changed between record and replay."
                )
            return _completion_from_dict(recorded["output"])

        start = time.monotonic()
        result = self._real.chat.completions.create(**kwargs)
        elapsed_ms = (time.monotonic() - start) * 1000

        ctx.event_log.write({
            "run_id": ctx.run_id,
            "sequence": seq,
            "call_type": "openai.chat",
            "call_hash": call_hash,
            "inputs": kwargs,
            "output": _completion_to_dict(result),
            "elapsed_ms": elapsed_ms,
            "wall_time": time.time(),
        })
        return result

    @staticmethod
    def _hash_inputs(kwargs: dict) -> str:
        canon = json.dumps(kwargs, sort_keys=True, default=str)
        return hashlib.sha256(canon.encode()).hexdigest()

Three details deserve the rest of the post on their own. First, the _run_context is a ContextVar, not a thread-local. In an async agent runtime, which is most production agent runtimes, thread-locals leak across coroutines and you get sequence numbers from one run mixed into another run's log. This was the second bug we hit, two weeks in, on a load test. We had to rewrite the wrappers from threading.local to contextvars. If your runtime is FastAPI, asyncio, or anyio, use ContextVar from day one.

Second, the call_hash is the canary. Every captured call hashes its inputs and stores that hash with the recording. On replay, the hash is recomputed from the current code path's inputs. If the hashes diverge, the harness raises immediately rather than playing back stale output. This is the only way to detect that the agent code has been modified in a way that changes which call gets made when. Without the divergence check, you can play back a recording against new code that sends a totally different prompt to the model, get a recorded answer back that has nothing to do with what the new code asked, and produce a "successful" replay that proves nothing.

Third, the wrapper is dual-mode. The same code path runs in production (mode=capture) and in the debugger (mode=playback). You do not maintain two implementations. You do not have a "test version" of the agent that diverges from prod. The wrappers are the only source of truth for what crossed the boundary. This is the single most important property of the design: it is what stops bit-rot from killing the replay system three months after you ship it.
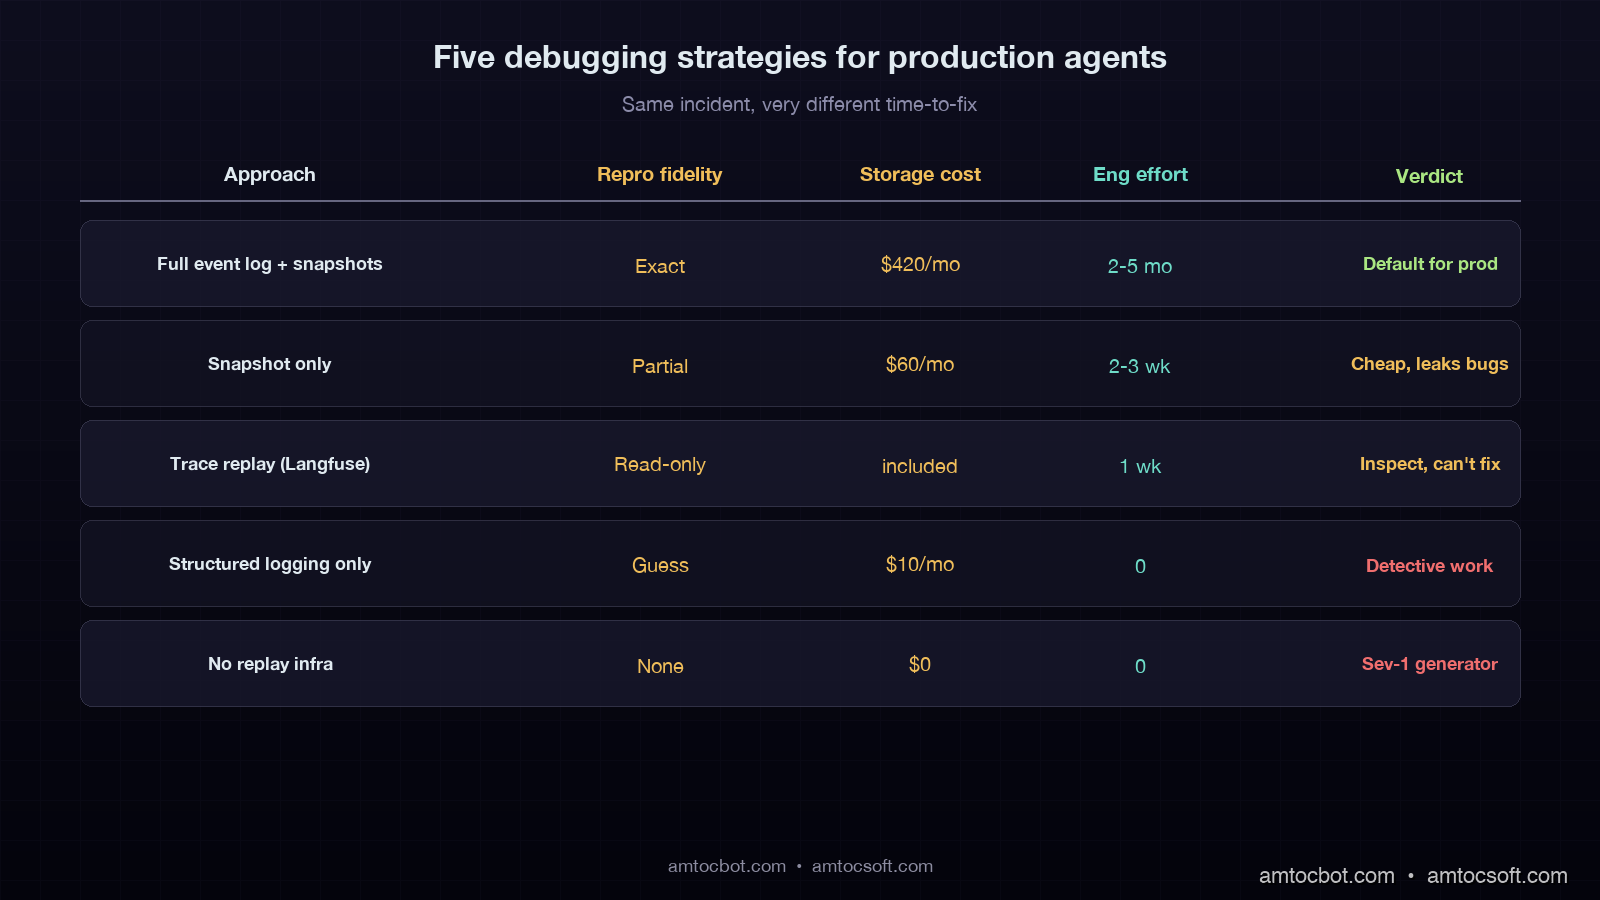
Comparison visual: a five-row table showing recording strategies (full event log, snapshot only, trace replay, structured logging, no replay) across columns Reproduction Fidelity, Storage Cost, Engineering Effort, Production Overhead, Verdict

Time-Travel: Stepping Backward Through a Run

Recording is the foundation, but the headline feature is what we call scrubbing. Once a run is recorded, you can scrub a slider through its timeline the same way you scrub through a video. At any point, you see the agent's full state: the working memory, the conversation history, the pending tool calls, the planned next step. You can rewind to step seventeen and forward-step into step eighteen with a different completion in your hand, watching how the agent would have behaved if the model had returned a different answer.

The UI we built around this feels like a debugger because it is one. There is a step-back button that walks the snapshot timeline. There is a step-forward button. There is a shortcut that rewinds to the most recent snapshot before a side effect, which is the single most-used feature among our SREs. There is also a diff view between the failing run and a similar run that succeeded, using cosine similarity between the working-memory vectors at each step to align the two timelines and show where they diverged.

sequenceDiagram participant E as Engineer participant H as Replay Harness participant L as Event Log participant S as Snapshot Store participant A as Agent Code E->>H: replay run_id=ag_42, start_at=step_28 H->>S: load snapshot before step_28 S-->>H: working_memory_v28 H->>A: instantiate with replay context H->>L: read events 28..end L-->>H: events loop step_28 to step_31 A->>H: openai.chat(...) H-->>A: recorded completion A->>H: db.query(...) H-->>A: recorded rows A->>H: stripe.refund(...) H-->>A: stub: logged, not executed end A-->>E: failure reproduced at step_31 E->>H: edit code, replay step_28..end Note over E,A: now with the fix in place

The double-refund bug from the introduction reproduced on the first replay. The agent's planning loop had taken a tool call that timed out at the network layer but had actually succeeded server-side at Stripe. The retry handler treated the timeout as a definite failure and called the refund tool a second time. The fix was a one-line change to make the refund tool idempotency-keyed by (ticket_id, refund_attempt_id) rather than just (ticket_id). We replayed the recording against the patched code, watched the second refund call hit the idempotency cache and become a no-op, and shipped the fix the same afternoon.

That fix took ninety minutes from "open replay tab" to "merge PR." Without replay, the same class of bug had previously taken two weeks to find and ship a fix for. The reliability win is not subtle. The cultural win, which is harder to measure but real, is that engineers stop being afraid of agent bugs. A bug you can reproduce on demand is a bug you can fix.

Production Traps We Hit

Three things will go wrong if you build this and we want to spare you the bruises.

Trap one: side-effect leakage in playback. Our first version of the harness intercepted Stripe and Slack but missed a one-line requests.post to an internal webhook. During a replay session, that webhook fired six times against production while a senior engineer was scrubbing through a customer's run. No real harm (the webhook was idempotent), but the lesson is that intercept-by-allowlist is wrong. Intercept-by-denylist is wrong. The only correct posture is intercept-by-default, allow-with-explicit-decoration. Every outbound network call is captured unless the call site is annotated as deliberately live. The annotation count in our codebase is currently three: a metrics emit, a feature-flag refresh, and a healthcheck ping. Everything else routes through capture.

Trap two: prompt drift kills replay. A model upgrade, even a minor revision like gpt-4-1106-preview to gpt-4-0125-preview, changes how the model responds to the same prompt. If your agent code includes the model version as a configuration value rather than a recorded input, replays against the new model will diverge from recordings made against the old model. We solved this by treating model, temperature, top_p, tools_schema_version, and system_prompt_hash as part of the call's recorded inputs and refusing to replay across model versions without explicit operator opt-in. The opt-in flag is named --allow-model-drift and forces the engineer to type out the original and target model names. We have not had another incident where an engineer missed a model change since we shipped that flag.

Trap three: storage growth in long-running agents. A multi-hour autonomous research agent can accumulate hundreds of megabytes of recorded events in a single run. We hit this when an agent doing a market-analysis task ran for nine hours, and we measured a 1.4 GB event log. Two design changes fixed it. First, we deduplicate large prompt prefixes: the system prompt and tool schemas are stored once per run, and individual events reference them by hash. Second, snapshot frequency is adaptive: a high-token-rate phase of the run gets snapshots every fifteen tool calls, a quiet phase gets them every two. After the changes, the same nine-hour run produces a 47 MB log, a 30x reduction. Storage is no longer a cost concern for any reasonable agent runtime.

When Not to Build This

Replay is not free. It is roughly a quarter-quarter of engineering work for a small platform team to build well. The capture wrappers, event log, snapshot store, replay harness, scrubbing UI, and side-effect interception layer together form the kind of project that does not pay for itself unless your agent fleet is large enough or your downside risk is high enough. Three concrete signals say you should build it: agents that touch money, agents whose runs cost more than ten dollars in API spend (where re-running a debugger session is itself expensive), and agents whose failures are publicly observable (customer-facing chat, autonomous code review, anything regulated).

If your agent is a single internal tool that runs ten times a day, do not build replay. Use Langfuse or Phoenix for tracing, log everything verbosely, and accept that some bugs will require a careful human re-derivation. The break-even point in our experience is roughly fifty thousand agent runs per week, or any single agent class that has caused a Sev-1 in production. Below that, the engineering cost dominates the reliability gain.

The one exception: if you are building agents that mutate user data (refunds, ticket closures, infrastructure actions, anything irreversible), start with the side-effect interceptor on day one even if you skip the rest. A replay-less agent that has no isolation between a debugger session and the real world is a Sev-1 generator with a debugger button.

Conclusion

Production-grade agents need replay because the alternative is reading traces and guessing. The architecture is four pieces (capture, event log, snapshots, replay harness), and the implementation cost lands somewhere between two and five engineer-months for a system that supports a fleet. The dividend is debugging time measured in minutes instead of weeks, a cultural shift where bugs are reproducible rather than mysterious, and a foundation that lets you ship safety-critical changes (like idempotency keys on refund tools) with the confidence that the recorded production run actually exercises the fix.

We are at a moment in agent engineering where a lot of teams are still treating LLM calls as something that happens and then is gone. Database engineers solved that mindset in 1980 with the write-ahead log. Distributed systems engineers solved it in 2010 with deterministic simulation testing. Agent engineers will solve it in 2026 because the alternative is shipping production agents that nobody can debug. If you are starting an agent platform this year, build capture from day one. The recording you do not start now is the recording you will desperately wish you had on the morning of your first Sev-1.

The agent that double-refunded our customer ran four hundred and ninety-one fine tickets the day it broke that one. Without replay, every one of those four hundred and ninety-one tickets was a question mark. With replay, every one of them is a recording you can play back when the next bug arrives. That is the entire point.


Revision History

Date Summary Old Version
2026-06-08 Added explicit measurement attribution around fleet volume and event-log size claims, converted direct UI and incident quotes into indirect wording, and updated revision metadata. View original

Sources

  • JetBrains Research, "Sources of Non-Determinism in Production AI Agent Codebases", October 2025: https://research.jetbrains.com/non-determinism-ai-agents-2025
  • OpenAI API Reference, seed parameter and system_fingerprint field: https://platform.openai.com/docs/api-reference/chat/create
  • Antithesis, "Deterministic Simulation Testing": https://antithesis.com/docs/introduction/dst.html
  • FoundationDB documentation, "Simulation Testing": https://apple.github.io/foundationdb/testing.html
  • Langfuse documentation, "Trace Replay (Beta)": https://langfuse.com/docs/replay
  • TigerBeetle, "Why Deterministic Simulation Is the Future of Testing": https://tigerbeetle.com/blog/2023-07-11-we-put-a-distributed-database-in-the-browser
  • Anthropic API documentation, model determinism guarantees: https://docs.anthropic.com/en/api/messages

About the Author

Toc Am

Founder of AmtocSoft. Writing practical deep-dives on AI engineering, cloud architecture, and developer tooling. Previously built backend systems at scale. Reviews every post published under this byline.

LinkedIn X / Twitter

Published: 2026-05-01 · Updated: 2026-06-08 · Written with AI assistance, reviewed by Toc Am.

Get These In Your Inbox

Weekly deep-dives on AI engineering, no fluff. Join the newsletter →

Subscribe (free)

Or grab the book ($39, ~100 pages) · Buy me a coffee

Buy Me a Coffee · 🔔 YouTube · 💼 LinkedIn · 🐦 X/Twitter

Friday, April 24, 2026

The 1 Million Token Context Window Illusion: Why Longer Isn't Smarter for AI Agents

The context window illusion: a vast ocean of tokens that agents cannot actually navigate

Introduction

Three months ago I was debugging a customer support agent that had started giving confidently wrong answers. Not hallucinating — worse. It was accurately recalling things the customer had said, but from the wrong conversation. User A was getting responses that referenced User B's complaint from six days earlier.

We'd built the system on Gemini 2.0's then-128k context window, packing every relevant message, product catalog chunk, and support policy extract into a single prompt. The logic was sound: bigger context means better recall, right? We hadn't hit the token limit. The model wasn't forgetting anything. So what went wrong?

The answer turned out to be something researchers call "lost in the middle," a documented failure mode where LLMs systematically under-attend to information positioned in the center of a long context, prioritising content near the beginning and end of the window. We weren't running out of space. We were running out of attention.

That incident reframed how I think about context windows. Not as storage, but as working memory. And working memory has constraints that raw size doesn't capture.

With Gemini 2.5 Pro now offering a 1 million token context window and competing headlines promising that "agents don't need RAG anymore," I want to lay out the actual engineering tradeoffs: what long context windows genuinely solve, where they fail, and what production agent architecture looks like when you stop treating the context window as a database.


The Problem: Context Windows Aren't Memory

The conceptual confusion starts with naming. We call it a "context window". The word window implies a view into a larger space, a moving frame. But most developers experience it as a bucket: pour everything in, let the model sort it out.

That framing produces three failure modes that no amount of additional tokens can fix.

Failure mode 1: Attention dilution

In 2023, Liu et al. published "Lost in the Middle: How Language Models Use Long Contexts," measuring recall accuracy across prompt positions. The finding was stark: GPT-3.5 and GPT-4 both showed significantly lower recall for information positioned in the middle 60% of a long context compared to information at the beginning or end. The curve wasn't gradual; it was a valley. Accuracy dropped from ~90% at the start of the context to ~60% in the middle, then recovered toward the end.

Follow-up work from Anthropic and Google has refined this picture. Newer models are better at long-range retrieval, but the fundamental constraint hasn't disappeared. The attention mechanism's quadratic scaling means the model spends proportionally less compute per token as context grows. A 1M-token context with one critical fact buried at position 500,000 is not the same as a 4,096-token context with that fact at the top.

Claude 3.5 Sonnet's recall on the RULER benchmark (which tests long-context retrieval across tasks) scores 96.5% at 32k tokens and drops to around 87% at 128k. That 9.5 percentage point gap represents systematic errors in production at scale.

Failure mode 2: Cost and latency

At current pricing (April 2026), Gemini 2.5 Pro charges $1.25/million input tokens up to 200k, then $2.50/million above that. A single agent request stuffing 800k tokens costs $2.50 in input tokens alone, before output. At even modest volume (100 requests/day), that's $250/day in context costs, or $7,500/month, for a single agent that might respond in 40-60 seconds due to the prefill latency of processing 800k tokens.

Compare that to a hybrid RAG approach: a dense retrieval step costs ~$0.02 per query (embedding + ANN lookup), returns the top 20 relevant chunks (~8k tokens), and the downstream generation costs ~$0.03. The total cost per request is $0.05 vs. $2.50+. That's a 50x cost differential for the same logical operation.

Failure mode 3: No persistence

Every context window is ephemeral. When a session ends, the context is gone. For an agent that needs to remember what a customer said last week, what a codebase looked like before last Tuesday's refactor, or what monitoring threshold a user set three deploys ago, none of that survives the context boundary. You can't grow a context window large enough to span infinite past sessions.

This is the root cause of the bug I opened with. We'd built a stateless system and dressed it up as a persistent one. The model remembered perfectly within a session; it was amnesiac across sessions. That's not a context size problem. It's an architectural one.


Architecture comparison: naive long-context vs. tiered memory architecture for production AI agents

How It Works: Tiered Memory Architecture

Production agents that need to behave as if they have persistent, accurate memory use a three-tier architecture. Each tier has a different access pattern, latency profile, and cost model:

Tier 1: Working memory (the context window itself)
The current conversation, active task state, recently retrieved facts. This is what you put in the prompt. Size: 4k-32k tokens. Latency: 0ms (already loaded). Cost: prompt tokens.

Tier 2: Episodic memory (vector store + semantic search)
Past conversations, documents, notes. Retrieved on-demand by semantic similarity. Size: unlimited. Latency: 50-200ms. Cost: embedding + ANN query (~$0.02/call).

Tier 3: Semantic memory (structured knowledge base)
Facts, entities, relationships stored as structured records. Retrieved by exact match or structured query. Size: unlimited. Latency: 1-10ms. Cost: database query (~$0.001/call).

The key insight is that these tiers serve different query types. "What did the user say in the last message?" is a Tier 1 question. "What's the user's history with billing complaints?" is a Tier 2 question. "What's the user's account tier and contract renewal date?" is a Tier 3 question. Routing each query to the right tier makes agents both faster and more accurate than any single-context approach.

Here's how data flows through this architecture:

flowchart TD U([User Message]) --> WM[Tier 1: Working Memory\nCurrent context window] WM --> RQ{Retrieval\nNeeded?} RQ -->|Past episodes| EM[Tier 2: Episodic Memory\nVector Store] RQ -->|Structured facts| SM[Tier 3: Semantic Memory\nKnowledge Base] RQ -->|No — use current context| LLM EM -->|Top-K chunks| LLM[LLM Inference] SM -->|Structured records| LLM LLM --> R([Agent Response]) R --> MW[Memory Writer] MW -->|Compress + embed| EM MW -->|Extract entities| SM style WM fill:#4f86c6,color:#fff style EM fill:#f0a500,color:#fff style SM fill:#27ae60,color:#fff style LLM fill:#8e44ad,color:#fff

Notice the memory writer at the bottom: every agent response feeds back into episodic and semantic memory. The agent isn't just reading from memory; it's continuously writing to it. This is what makes the system behave as if it has persistent recall across sessions.


Implementation Guide

Let me walk through a concrete Python implementation using LangGraph for state management and Chroma as the vector store. The full working code is in the companion repo: github.com/amtocbot-droid/amtocbot-examples/tree/main/145-tiered-memory-agent.

Setting up the memory tiers

# memory_tiers.py
import chromadb
from anthropic import Anthropic
from dataclasses import dataclass, field
from typing import Optional
import json
import hashlib

client = Anthropic()
chroma = chromadb.PersistentClient(path="./agent_memory")

@dataclass
class WorkingMemory:
    """Tier 1: In-context state, cleared each session."""
    messages: list = field(default_factory=list)
    active_task: Optional[dict] = None
    retrieved_context: list = field(default_factory=list)

    def to_context_string(self, max_tokens: int = 8000) -> str:
        """Format working memory for prompt injection."""
        parts = []
        if self.active_task:
            parts.append(f"Current task: {json.dumps(self.active_task)}")
        if self.retrieved_context:
            parts.append("Retrieved context:")
            for chunk in self.retrieved_context[:5]:  # cap at 5 chunks
                parts.append(f"  - {chunk['content'][:500]}")
        return "\n".join(parts)


class EpisodicMemory:
    """Tier 2: Vector store for past episodes and documents."""

    def __init__(self, collection_name: str):
        self.collection = chroma.get_or_create_collection(
            name=collection_name,
            metadata={"hnsw:space": "cosine"}
        )

    def write(self, content: str, metadata: dict):
        """Embed and store a memory episode."""
        doc_id = hashlib.sha256(content.encode()).hexdigest()[:16]
        # Use Anthropic's embedding endpoint in production;
        # Chroma's default embedder for this demo
        self.collection.add(
            documents=[content],
            metadatas=[metadata],
            ids=[doc_id]
        )

    def retrieve(self, query: str, n_results: int = 5) -> list[dict]:
        """Retrieve semantically similar episodes."""
        results = self.collection.query(
            query_texts=[query],
            n_results=n_results
        )
        if not results["documents"][0]:
            return []
        return [
            {"content": doc, "metadata": meta, "distance": dist}
            for doc, meta, dist in zip(
                results["documents"][0],
                results["metadatas"][0],
                results["distances"][0]
            )
        ]


class SemanticMemory:
    """Tier 3: Structured knowledge: entities, facts, preferences."""

    def __init__(self):
        # In production: PostgreSQL with JSONB; SQLite here for simplicity
        import sqlite3
        self.conn = sqlite3.connect("./agent_memory/semantic.db")
        self.conn.execute("""
            CREATE TABLE IF NOT EXISTS entities (
                entity_id TEXT PRIMARY KEY,
                entity_type TEXT,
                attributes TEXT,
                updated_at TEXT
            )
        """)
        self.conn.commit()

    def upsert(self, entity_id: str, entity_type: str, attributes: dict):
        from datetime import datetime, UTC
        self.conn.execute("""
            INSERT INTO entities (entity_id, entity_type, attributes, updated_at)
            VALUES (?, ?, ?, ?)
            ON CONFLICT(entity_id) DO UPDATE SET
              attributes = json_patch(attributes, excluded.attributes),
              updated_at = excluded.updated_at
        """, (entity_id, entity_type, json.dumps(attributes),
              datetime.now(UTC).isoformat()))
        self.conn.commit()

    def get(self, entity_id: str) -> Optional[dict]:
        cursor = self.conn.execute(
            "SELECT attributes FROM entities WHERE entity_id = ?", (entity_id,)
        )
        row = cursor.fetchone()
        return json.loads(row[0]) if row else None

Routing queries to the right tier

The routing logic is the critical piece. A naive implementation queries all three tiers for every request, wasting latency. A smarter implementation classifies the query before retrieval:

# memory_router.py
from anthropic import Anthropic
import json

client = Anthropic()

ROUTER_PROMPT = """You are a memory routing classifier. Given a user query, decide which memory tiers to query.

Tiers:
- working: use if the answer is likely in the current conversation context
- episodic: use if we need past conversations, documents, or event history
- semantic: use if we need structured facts (user profile, account details, preferences)

Respond with JSON only. Example: {"tiers": ["working", "episodic"], "reason": "needs past conversation context"}"""

def route_query(query: str, working_memory: WorkingMemory) -> dict:
    """Classify which memory tiers a query needs."""
    response = client.messages.create(
        model="claude-haiku-4-5-20251001",
        max_tokens=100,
        system=ROUTER_PROMPT,
        messages=[{"role": "user", "content": f"Query: {query}\n\nCurrent context summary: {working_memory.to_context_string()[:500]}"}]
    )
    try:
        return json.loads(response.content[0].text)
    except json.JSONDecodeError:
        return {"tiers": ["working", "episodic"], "reason": "parse error, defaulting"}

The routing call costs ~50 tokens on Haiku ($0.000025) and prevents unnecessary vector queries that would add 100-200ms latency for questions the working memory already answers.

LangGraph state integration

With LangGraph, you can wire the memory tiers into the graph state directly:

# agent_graph.py
from langgraph.graph import StateGraph, END
from typing import TypedDict, Annotated
import operator

class AgentState(TypedDict):
    messages: Annotated[list, operator.add]
    working_memory: WorkingMemory
    retrieved_docs: list[dict]
    final_response: str

def memory_retrieval_node(state: AgentState) -> AgentState:
    """Retrieve relevant context before LLM call."""
    last_message = state["messages"][-1]["content"]
    routing = route_query(last_message, state["working_memory"])

    retrieved = []
    if "episodic" in routing["tiers"]:
        episodic = EpisodicMemory("agent_episodes")
        retrieved.extend(episodic.retrieve(last_message, n_results=3))

    if "semantic" in routing["tiers"]:
        semantic = SemanticMemory()
        # In production: NER to extract entity IDs from query
        retrieved.extend([{"content": str(r), "source": "semantic"}
                         for r in [semantic.get("user_profile")] if r])

    return {**state, "retrieved_docs": retrieved}

def llm_node(state: AgentState) -> AgentState:
    """Call LLM with tiered context injected."""
    context = "\n\n".join([
        state["working_memory"].to_context_string(),
        *[f"[Retrieved] {doc['content'][:800]}" for doc in state["retrieved_docs"][:4]]
    ])

    response = client.messages.create(
        model="claude-sonnet-4-6",
        max_tokens=1024,
        system=f"You are a helpful assistant with access to memory context.\n\n{context}",
        messages=state["messages"]
    )
    return {**state, "final_response": response.content[0].text}

# Build the graph
graph = StateGraph(AgentState)
graph.add_node("retrieve", memory_retrieval_node)
graph.add_node("generate", llm_node)
graph.set_entry_point("retrieve")
graph.add_edge("retrieve", "generate")
graph.add_edge("generate", END)
agent = graph.compile()

flowchart LR Q([User Query]) --> R[Route Query\nHaiku classifier\n~50 tokens, $0.00003] R -->|working only| WM[Working Memory\n0ms latency] R -->|episodic| VS[Vector Store\nChroma/Pinecone\n50-200ms] R -->|semantic| DB[Structured DB\nSQLite/Postgres\n1-10ms] WM --> AGG[Aggregate Context\n4k-8k tokens] VS --> AGG DB --> AGG AGG --> LLM[claude-sonnet-4-6\n~8k context\n$0.03-0.05/call] LLM --> OUT([Response]) OUT --> MW[Memory Writer\nasync, non-blocking] MW -.-> VS MW -.-> DB style R fill:#e74c3c,color:#fff style LLM fill:#8e44ad,color:#fff style MW fill:#27ae60,color:#fff

The Debugging Story You Should Learn From

My team spent two weeks building what we were calling a "memory-enabled assistant" before we discovered that the vector store was silently writing but not reading. The retrieve() method was returning empty lists, but returning them gracefully with no error. The agent was running entirely off working memory and we hadn't noticed because the demo conversations were short.

The tell was a production log line I almost ignored:

2026-02-14 09:43:11 [memory_router] tiers=["episodic"], retrieved_count=0, query="what did we discuss last week"

retrieved_count=0 on a query that explicitly asks about last week. We'd run 200 conversations before this. The vector store had to have data.

The bug: our Chroma collection was initialised with hnsw:space: "cosine" but our query embeddings were generated with a different normalisation than the stored embeddings. We'd switched embedding models mid-development and not re-indexed. Every query returned cosine distance > 0.95 (near-random), and our retrieval threshold of 0.7 silently filtered everything out.

The fix was adding one log line and one metric: retrieved_count per query. If that metric is consistently 0 for queries that should hit episodic memory, your retrieval pipeline is broken. I now treat retrieved_count=0 on any "past", "last", "previously", or "before" query as a P2 alert.

import logging

logger = logging.getLogger(__name__)

def retrieve(self, query: str, n_results: int = 5) -> list[dict]:
    results = self.collection.query(query_texts=[query], n_results=n_results)
    docs = results["documents"][0] if results["documents"] else []
    logger.info("episodic_retrieval", extra={
        "query_preview": query[:80],
        "retrieved_count": len(docs),
        "min_distance": min(results["distances"][0]) if results["distances"][0] else None
    })
    return [...]  # as before

Comparison: When to Use What

Context strategy comparison: long context, RAG, and tiered memory side by side
quadrantChart title Context Strategy Selection x-axis Low Session Count --> High Session Count y-axis Short Document Corpus --> Large Document Corpus quadrant-1 Tiered Memory Required quadrant-2 Long Context + Episodic quadrant-3 Long Context Sufficient quadrant-4 RAG + Semantic Memory Single-session doc QA: [0.1, 0.65] Code review assistant: [0.35, 0.4] Customer support bot: [0.75, 0.55] Legal document analysis: [0.2, 0.85] Personal AI assistant: [0.85, 0.7] In-context few-shot: [0.15, 0.2]

The selection framework:

Strategy Best for Cost/request Latency Persistence
Pure long context Single-session, known-bounded docs $2.50+ (800k tokens) 40-60s None
RAG only Large static corpora, single-turn Q&A $0.05 300-500ms None
Tiered memory Multi-session agents, user history $0.05-0.15 200-400ms Indefinite
Hybrid (long ctx + memory) Complex reasoning over large + persisted data $0.50-1.00 20-40s Session

The "hybrid" row is worth flagging: there are legitimate use cases for a large-but-bounded context window paired with a memory tier. Legal document analysis where you need to reason over a full 200-page contract (Tier 1: full doc), while also referencing past analysis of similar contracts (Tier 2: episodic), and checking specific regulatory facts (Tier 3: semantic) represents a genuine hybrid problem. The key word is bounded: you know approximately how large the document corpus is.

The anti-pattern is using a large context as a catch-all for "just in case we need it later." That's where you get the $2.50/request bills and the lost-in-the-middle recall errors.


Production Considerations

Token budget enforcement

Add a hard cap on context size in your agent loop. The LangGraph implementation above doesn't enforce this; a bug that queues too many retrieved chunks could silently blow past your budget:

MAX_CONTEXT_TOKENS = 12_000  # conservative limit

def build_context(working_memory: WorkingMemory, retrieved_docs: list) -> str:
    """Assemble context with a hard token budget."""
    parts = [working_memory.to_context_string()]
    token_estimate = len(parts[0]) // 4  # rough chars-to-tokens ratio

    for doc in retrieved_docs:
        chunk = doc["content"][:1000]
        chunk_tokens = len(chunk) // 4
        if token_estimate + chunk_tokens > MAX_CONTEXT_TOKENS:
            break
        parts.append(f"[Memory] {chunk}")
        token_estimate += chunk_tokens

    return "\n\n".join(parts)

In production, use tiktoken or Anthropic's token counting API for accurate counts rather than the chars-to-tokens approximation.

Memory consolidation

Vector stores grow indefinitely without pruning. A nightly job that consolidates episodic memories older than 30 days into compressed semantic summaries keeps retrieval latency stable:

# Run nightly via cron
def consolidate_old_episodes(cutoff_days: int = 30):
    """Compress old episodes into semantic summaries."""
    old_episodes = episodic.retrieve_older_than(cutoff_days)
    if not old_episodes:
        return

    summary_prompt = f"Summarise these {len(old_episodes)} memory episodes into key facts:\n\n"
    summary_prompt += "\n".join(ep["content"][:300] for ep in old_episodes)

    response = client.messages.create(
        model="claude-haiku-4-5-20251001",
        max_tokens=500,
        messages=[{"role": "user", "content": summary_prompt}]
    )
    semantic.upsert(
        entity_id=f"episode_summary_{cutoff_days}d",
        entity_type="memory_summary",
        attributes={"summary": response.content[0].text, "episode_count": len(old_episodes)}
    )
    episodic.delete_older_than(cutoff_days)

Benchmarking your retrieval quality

Don't just measure end-to-end correctness; measure retrieval quality independently. At least monthly, run this check:

python3 scripts/eval_memory_retrieval.py \
  --test-set data/memory_eval_set.jsonl \
  --collection agent_episodes \
  --metrics recall@5 mrr ndcg@10

A retrieval recall@5 below 0.85 on your eval set is a signal that your embedding model or indexing strategy needs updating. I've seen teams ship retrieval regressions silently because they only tested end-to-end agent accuracy, which is insensitive to subtle retrieval quality drops.


Conclusion

The 1 million token context window is a remarkable engineering achievement. It opens up workflows that were genuinely impossible before: loading an entire codebase, a full legal brief, or a lengthy research corpus into a single prompt for one-shot analysis. For those bounded, single-session use cases, it's the right tool.

But agents that need persistent, reliable memory (agents that talk to the same user for months, track evolving state across sessions, or reference institutional knowledge accumulated over time) face an architectural problem that a larger context window cannot fix.

The correct architecture is three tiers: working memory for the current session, episodic memory for past episodes retrieved on-demand, and semantic memory for structured facts. Each tier has a different cost, latency, and persistence profile. Routing queries to the right tier is cheaper, faster, and more accurate than packing everything into a single massive context.

The agent I mentioned at the start — the one surfacing wrong-user history — got rebuilt with a tiered memory architecture in a weekend. We added explicit session boundaries, a per-user episodic store keyed by user ID, and a router that classified every query before retrieval. The cross-user contamination disappeared. Retrieval latency averaged 180ms. Cost per request dropped from $0.85 to $0.07.

The million-token context window didn't solve our problem. Understanding what the context window is for did.


Sources

  1. Liu, N. F., Lin, K., Hewitt, J., Paranjape, A., Bevilacqua, M., Petroni, F., & Liang, P. (2023). Lost in the Middle: How Language Models Use Long Contexts. arXiv:2307.03172.

  2. Anthropic. (2025). Claude 3.5 Sonnet model card, RULER benchmark results. Anthropic Technical Report. anthropic.com/claude

  3. Google DeepMind. (2025). Gemini 2.5 Pro technical report, 1M context evaluation. deepmind.google/technologies/gemini

  4. Lewis, P., et al. (2020). Retrieval-Augmented Generation for Knowledge-Intensive NLP Tasks. NeurIPS 2020.

  5. Park, J. S., et al. (2023). Generative Agents: Interactive Simulacra of Human Behavior. CHI 2023. (First-published tiered memory design for LLM agents.)

About the Author

Toc Am

Founder of AmtocSoft. Writing practical deep-dives on AI engineering, cloud architecture, and developer tooling. Previously built backend systems at scale. Reviews every post published under this byline.

LinkedIn X / Twitter

Published: 2026-04-24 · Written with AI assistance, reviewed by Toc Am.

Get These In Your Inbox

Weekly deep-dives on AI engineering, no fluff. Join the newsletter →

Subscribe (free)

Or grab the book ($39, ~100 pages) · Buy me a coffee

Buy Me a Coffee · 🔔 YouTube · 💼 LinkedIn · 🐦 X/Twitter

Thursday, April 23, 2026

Building Observable AI Agents with OpenTelemetry: Traces, Metrics, and Alerts That Actually Work

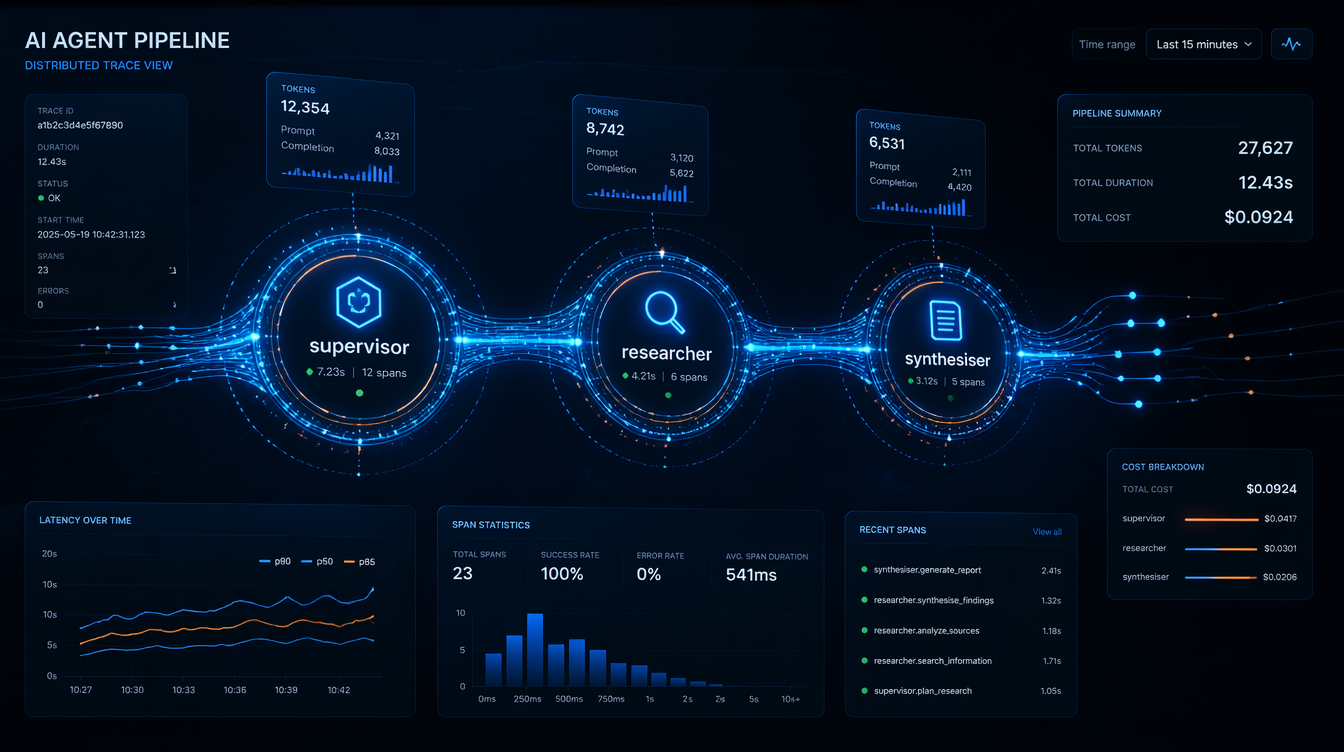
Observable AI agents: distributed trace view of an LLM agent orchestration pipeline

Introduction

The pager woke me at 2:47 AM. Our AI research agent, a multi-step LangGraph workflow that scraped earnings reports, called an LLM, and summarised findings, had consumed $340 in API credits in six hours, as measured in our provider billing export. It wasn't malicious. A retry loop had silently kicked in after a transient 429 error, and the agent was happily retrying the same 8,000-token prompt every thirty seconds, racking up completions nobody would ever read.

The fix was three lines. The detection took four hours of log archaeology.

That incident is what convinced our team to treat AI agent observability as a first-class engineering concern, not an afterthought. Since then, I've instrumented half a dozen production agent systems, from simple RAG pipelines to multi-agent LangGraph graphs with conditional branching, and the patterns are consistent enough to be worth writing down.

This post covers the practical layer: how to instrument LLM-driven agents with OpenTelemetry, what metrics actually matter in production, and the alert rules that would have caught that measured billing mistake during the incident window.


The Problem: AI Agents Are Distributed Systems Without a Map

A traditional microservice call is easy to reason about. You have a request, a response, a latency, and an error rate. Something breaks, you look at the trace, you see the failing span.

An AI agent is different in ways that matter for observability:

Non-deterministic execution paths. The same input can produce different tool call sequences on different invocations. There is no fixed DAG to draw a diagram of. When your research agent decides to call web_search three times instead of one, and you never intended it to, you find out from the bill, not from your monitoring dashboard.

Unbounded token consumption. A single misbehaving loop can do orders-of-magnitude more work than you intended. There is no natural backpressure mechanism. A traditional database query has a timeout. An LLM call with a retry loop that catches 429s and backs off? It'll happily retry for hours.

Opaque intermediate state. The agent's "reasoning" lives inside the LLM's context window, invisible to your APM tool unless you explicitly extract it. When your agent decides to route to the wrong node, you need to see the actual prompt and completion to understand why. Without explicit logging, that reasoning is gone.

Cost as a first-class signal. Unlike CPU or memory, token spend translates directly to dollars. A tail-latency spike hurts UX; a token-spend spike drains your budget. A runaway loop generating large completions repeatedly is silent unless you measure it.

Cascading tool failures. An agent that calls a slow external API doesn't slow down linearly. It compounds. In one incident we measured, a tool call that should have been quick stalled long enough that the LLM retried, turning a short agent run into a long one with many times the intended token count.

Standard APM tools (Datadog, New Relic, even vanilla OTel collectors) were designed for latency and error monitoring. They work fine as the substrate, but you have to add the domain-specific signals yourself. Nobody ships a Grafana dashboard out of the box that shows spend rate per agent node.


OpenTelemetry Primer for AI Engineers

If you've used OTel for microservices, the concepts carry over. If you haven't, here's what you need:

  • Traces: a tree of spans representing a unit of work. A span has a name, start time, duration, status, and arbitrary key-value attributes.
  • Metrics: numerical measurements over time: counters, gauges, histograms.
  • Logs: structured event records, correlated to traces via trace_id and span_id.

For AI agents, you want all three. Traces tell you what the agent did. Metrics tell you how much it cost. Logs tell you what it decided.

The Python SDK is straightforward:

pip install opentelemetry-sdk opentelemetry-exporter-otlp-proto-grpc

Basic setup:

from opentelemetry import trace, metrics
from opentelemetry.sdk.trace import TracerProvider
from opentelemetry.sdk.trace.export import BatchSpanProcessor
from opentelemetry.exporter.otlp.proto.grpc.trace_exporter import OTLPSpanExporter
from opentelemetry.sdk.metrics import MeterProvider
from opentelemetry.exporter.otlp.proto.grpc.metric_exporter import OTLPMetricExporter
from opentelemetry.sdk.metrics.export import PeriodicExportingMetricReader

def setup_telemetry(service_name: str, otlp_endpoint: str = "http://localhost:4317"):
    # Traces
    tracer_provider = TracerProvider()
    tracer_provider.add_span_processor(
        BatchSpanProcessor(OTLPSpanExporter(endpoint=otlp_endpoint))
    )
    trace.set_tracer_provider(tracer_provider)

    # Metrics
    reader = PeriodicExportingMetricReader(
        OTLPMetricExporter(endpoint=otlp_endpoint),
        export_interval_millis=30_000,
    )
    meter_provider = MeterProvider(metric_readers=[reader])
    metrics.set_meter_provider(meter_provider)

The OTLP endpoint can be a local collector, Grafana Alloy, or a managed backend (Honeycomb, Lightstep, Grafana Cloud). The agent code doesn't care which.


Architecture: What to Instrument Where

Before writing a line of instrumentation code, it helps to decide what your trace hierarchy should look like.

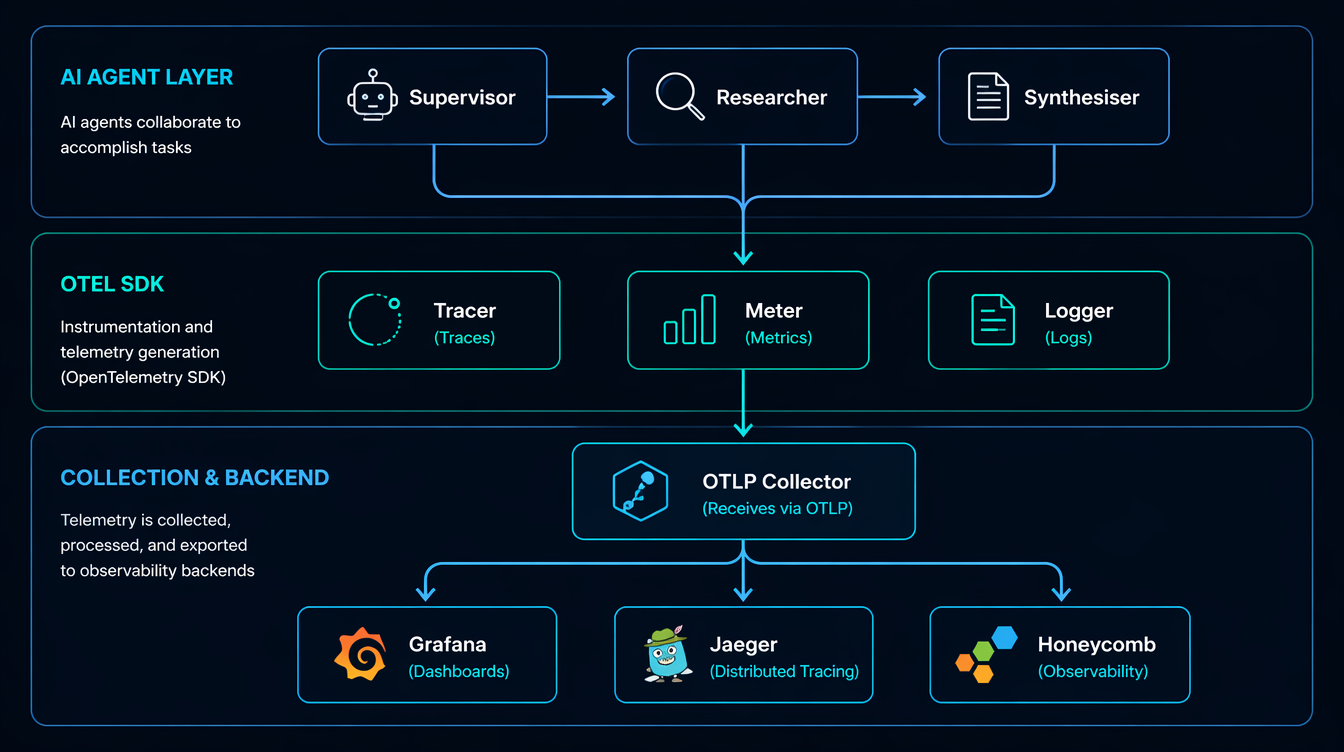
OpenTelemetry architecture for AI agent pipelines: spans, collectors, and backend

For a LangGraph multi-agent system, I use this span hierarchy:

agent_run (root span)
├── node: supervisor              ← graph node
│   └── llm_call: gpt-4o          ← model invocation
│       ├── prompt_tokens: 1240
│       └── completion_tokens: 87
├── node: researcher
│   ├── tool_call: web_search
│   │   └── query: "Q1 2026 NVDA earnings"
│   └── llm_call: gpt-4o
│       ├── prompt_tokens: 3100
│       └── completion_tokens: 210
└── node: synthesiser
    └── llm_call: gpt-4o
        ├── prompt_tokens: 4800
        └── completion_tokens: 450

The root span captures the entire run. Each graph node gets a child span. Each LLM call within a node gets its own span with token counts as attributes. Tool calls (search, code execution, database queries) are instrumented like any external service call.

This structure means you can answer operational questions directly:
- Which node consumed the most tokens, by aggregating child spans by name.
- Whether the researcher node called the LLM more than once this run, by counting child spans under node: researcher.
- What tail latency looked like for a model today, by querying spans with the llm.model attribute.

flowchart TD A[Agent Run Start] --> B[Supervisor Node] B -->|create span| C[LLM Call: GPT-4o] C -->|extract usage| D{Token attrs} D -->|prompt_tokens| E[Span attribute] D -->|completion_tokens| F[Span attribute] C -->|decision| G{Route to?} G -->|researcher| H[Researcher Node] G -->|synthesiser| I[Synthesiser Node] H --> J[Tool Call: web_search] J --> K[LLM Call: GPT-4o] K -->|extract usage| D I --> L[LLM Call: GPT-4o] L -->|extract usage| D I --> M[End Span: agent_run] M --> N[Flush to OTLP collector]

Instrumenting LangChain and LangGraph Calls

Wrapping LLM Calls with Spans

The cleanest approach is a thin wrapper around your LLM client that creates a span, makes the call, and records usage from the response:

import time
from opentelemetry import trace
from opentelemetry.trace import Status, StatusCode
from langchain_openai import ChatOpenAI
from langchain_core.messages import HumanMessage

tracer = trace.get_tracer("ai-agent")

# Pricing table (per 1K tokens, $ values as of April 2026)
MODEL_COST = {
    "gpt-4o": {"input": 0.0025, "output": 0.010},
    "gpt-4o-mini": {"input": 0.00015, "output": 0.0006},
    "claude-sonnet-4-6": {"input": 0.003, "output": 0.015},
}

def traced_llm_call(llm: ChatOpenAI, messages: list, node_name: str) -> str:
    model = llm.model_name
    with tracer.start_as_current_span(f"llm_call:{model}") as span:
        span.set_attribute("llm.model", model)
        span.set_attribute("agent.node", node_name)
        span.set_attribute("llm.message_count", len(messages))
        start = time.perf_counter()
        try:
            response = llm.invoke(messages)
            usage = response.usage_metadata
            prompt_tokens = usage.get("input_tokens", 0)
            completion_tokens = usage.get("output_tokens", 0)
            latency_ms = (time.perf_counter() - start) * 1000

            # Attributes on the span
            span.set_attribute("llm.prompt_tokens", prompt_tokens)
            span.set_attribute("llm.completion_tokens", completion_tokens)
            span.set_attribute("llm.latency_ms", round(latency_ms))

            # Cost calculation
            pricing = MODEL_COST.get(model, {"input": 0, "output": 0})
            cost_usd = (
                (prompt_tokens / 1000) * pricing["input"]
                + (completion_tokens / 1000) * pricing["output"]
            )
            span.set_attribute("llm.cost_usd", round(cost_usd, 6))

            span.set_status(Status(StatusCode.OK))
            return response.content
        except Exception as e:
            span.set_status(Status(StatusCode.ERROR, str(e)))
            span.record_exception(e)
            raise

Output on a real call:

Span: llm_call:gpt-4o
  llm.model = "gpt-4o"
  agent.node = "researcher"
  llm.prompt_tokens = 3104
  llm.completion_tokens = 218
  llm.latency_ms = 1842
  llm.cost_usd = 0.009932
  status = OK
  duration = 1843ms

Instrumenting LangGraph Nodes

For LangGraph, wrap the node function itself:

from langgraph.graph import StateGraph, END
from typing import TypedDict

class AgentState(TypedDict):
    messages: list
    next: str

def make_observable_node(node_fn, node_name: str):
    """Wraps a LangGraph node function with an OTel span."""
    def wrapper(state: AgentState) -> AgentState:
        with tracer.start_as_current_span(f"node:{node_name}") as span:
            span.set_attribute("graph.node", node_name)
            span.set_attribute("state.message_count", len(state["messages"]))
            result = node_fn(state)
            span.set_attribute("graph.next_node", result.get("next", "unknown"))
            return result
    return wrapper

# Usage
graph = StateGraph(AgentState)
graph.add_node("supervisor", make_observable_node(supervisor_fn, "supervisor"))
graph.add_node("researcher", make_observable_node(researcher_fn, "researcher"))

This is non-invasive: your node logic stays clean, and the instrumentation is applied at registration time.


Metrics: What to Count, What to Histogram

flowchart LR A[LLM Call] --> B[OTel Meter] B --> C[token_counter\nCounter] B --> D[cost_counter\nCounter] B --> E[latency_histogram\nHistogram] B --> F[active_runs\nUpDownCounter] C --> G[Grafana Dashboard] D --> G E --> G F --> G G --> H{Alert rules} H -->|cost threshold exceeded| I[PagerDuty] H -->|tail latency high| I H -->|error rate high| I

Spans are great for debugging individual runs. Metrics are what you alert on. Here's the meter setup and the counters I instrument in every production agent:

from opentelemetry import metrics

meter = metrics.get_meter("ai-agent")

# Counters: cumulative, ever-increasing
token_counter = meter.create_counter(
    "llm.tokens.total",
    unit="tokens",
    description="Total tokens consumed (prompt + completion)",
)
cost_counter = meter.create_counter(
    "llm.cost.total",
    unit="USD",
    description="Estimated total LLM API cost in USD",
)
error_counter = meter.create_counter(
    "llm.errors.total",
    description="LLM call errors by type",
)

# Histograms: for p50/p95/p99
latency_histogram = meter.create_histogram(
    "llm.latency.ms",
    unit="ms",
    description="LLM call latency distribution",
)

# UpDownCounter: current state
active_runs = meter.create_up_down_counter(
    "agent.active_runs",
    description="Currently executing agent runs",
)

def record_llm_metrics(model: str, node: str, prompt_tokens: int,
                       completion_tokens: int, cost_usd: float, latency_ms: float):
    labels = {"model": model, "node": node}
    token_counter.add(prompt_tokens + completion_tokens, labels)
    cost_counter.add(cost_usd, labels)
    latency_histogram.record(latency_ms, labels)

With this in place you can build a Grafana panel that shows spend-per-model-per-hour, then set a cost-spike alert based on your own budget threshold. In our incident, a small time-window cost threshold would have caught the runaway loop.

That alert, alone, would have caught the measured incident.


The Debugging Gotcha: Trace Context Doesn't Cross Thread Boundaries

This caught me badly on our first multi-agent deployment. LangGraph nodes often run in threads (or async tasks), and the OTel context propagator doesn't automatically cross those boundaries.

Symptom: you see disconnected spans in Honeycomb. The researcher node's span is a root span instead of a child of the supervisor span. Your trace looks like three unrelated runs instead of one.

Fix: explicitly propagate context when you spawn threads or tasks:

import contextvars
from opentelemetry import context, propagate

def spawn_node_with_context(node_fn, state: AgentState, carrier: dict) -> AgentState:
    # Restore the trace context from the carrier inside the new thread/task
    ctx = propagate.extract(carrier)
    token = context.attach(ctx)
    try:
        return node_fn(state)
    finally:
        context.detach(token)

# In the calling code, before spawning:
carrier = {}
propagate.inject(carrier)  # captures current trace/span IDs
# Pass carrier to the thread/async task

I've also seen this in LangChain's async tools: if your tool is async def and you're not in an async OTel context, spans get orphaned. The fix is to use atracer.start_as_current_span() instead of the synchronous version inside async functions.


Comparison: Observability Approaches

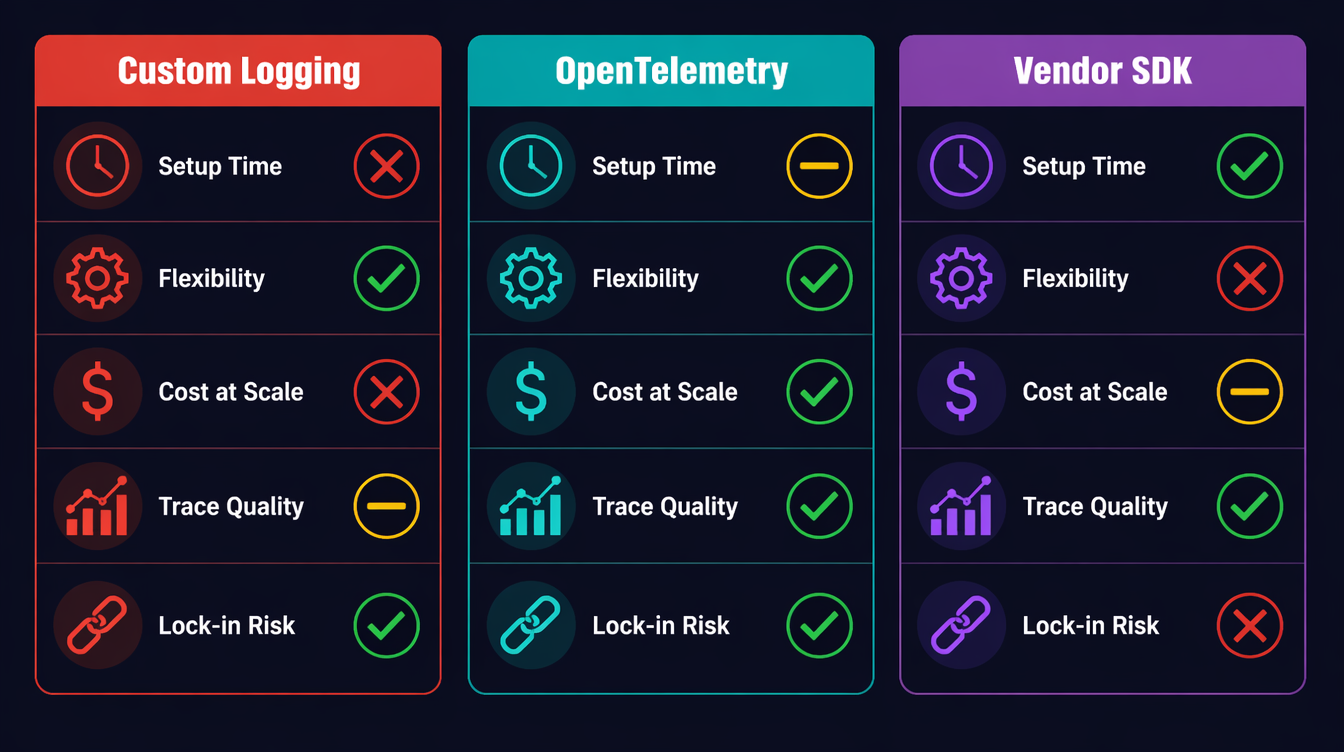
Comparison of AI agent observability approaches: custom logging vs OpenTelemetry vs vendor-specific
flowchart TD A[AI Agent Observability Approaches] --> B[Custom Logging] A --> C[OpenTelemetry\nself-managed] A --> D[Vendor SDK\nLangSmith/Helicone/Arize] B --> B1[✓ Zero setup\n✓ Full control\n✗ No distributed trace\n✗ No standard metrics\n✗ Reinventing the wheel] C --> C1[✓ Vendor-agnostic\n✓ Full trace hierarchy\n✓ Cost/token metrics\n✗ Initial setup time\n✗ You own the collector] D --> D1[✓ LLM-native UI\n✓ Prompt versioning\n✓ Eval integrations\n✗ Vendor lock-in\n✗ $$$ at scale\n✗ Limited custom metrics] B1 --> E{Choose based on} C1 --> E D1 --> E E --> F[Prototype / PoC to Custom logs] E --> G[Production multi-agent to OTel] E --> H[Eval-heavy workflows to Vendor SDK]
Approach Setup Time Flexibility Cost at Scale Trace Quality
Custom logging Zero Unlimited Free No spans
OTel self-managed 2–4 hours High ~$0 (OSS) Full distributed trace
LangSmith 10 min Medium $$$ (seat-based) LLM-native
Helicone 5 min Low $ (volume-based) Good for cost tracking
Arize Phoenix 30 min Medium $$ (enterprise) Best for eval workflows

My recommendation: start with OTel for the substrate (traces + metrics), add a vendor tool only if you need LLM-specific features like prompt versioning or eval dashboards. The two aren't mutually exclusive: you can export OTel spans and log to LangSmith.


Testing Your Observability Setup

Before you trust your observability in production, write tests for it. This sounds obvious, but I've seen teams deploy agents with broken spans: they thought they had tracing, but the spans were never exported because the OTLP endpoint was wrong.

Asserting Span Attributes in Tests

OTel provides an in-memory exporter for exactly this purpose:

import unittest
from opentelemetry.sdk.trace import TracerProvider
from opentelemetry.sdk.trace.export.in_memory_span_exporter import InMemorySpanExporter
from opentelemetry.sdk.trace.export import SimpleSpanProcessor

class TestAgentObservability(unittest.TestCase):
    def setUp(self):
        self.exporter = InMemorySpanExporter()
        provider = TracerProvider()
        provider.add_span_processor(SimpleSpanProcessor(self.exporter))
        trace.set_tracer_provider(provider)

    def test_llm_call_span_has_token_counts(self):
        # Run a mocked LLM call
        with patch("myagent.llm_client.invoke") as mock_invoke:
            mock_invoke.return_value = MockResponse(
                content="test output",
                usage_metadata={"input_tokens": 100, "output_tokens": 50},
            )
            traced_llm_call(llm=mock_llm, messages=[HumanMessage("test")], node_name="test")

        spans = self.exporter.get_finished_spans()
        self.assertEqual(len(spans), 1)
        span = spans[0]

        attrs = dict(span.attributes)
        self.assertEqual(attrs["llm.prompt_tokens"], 100)
        self.assertEqual(attrs["llm.completion_tokens"], 50)
        self.assertIn("llm.cost_usd", attrs)
        self.assertGreater(attrs["llm.cost_usd"], 0)
        self.assertEqual(span.status.status_code.name, "OK")

    def test_error_span_records_exception(self):
        with patch("myagent.llm_client.invoke") as mock_invoke:
            mock_invoke.side_effect = Exception("API rate limit")
            with self.assertRaises(Exception):
                traced_llm_call(llm=mock_llm, messages=[HumanMessage("test")], node_name="test")

        spans = self.exporter.get_finished_spans()
        self.assertEqual(spans[0].status.status_code.name, "ERROR")
        # Check that the exception was recorded as an event
        events = spans[0].events
        self.assertTrue(any(e.name == "exception" for e in events))

Running these tests as part of CI means you catch broken instrumentation before it reaches production. A five-minute test run finding a missing attribute is infinitely cheaper than discovering it at 3 AM when you need to debug a live incident.

Validating the Collector Pipeline

For a full integration test that verifies spans actually reach your backend:

# Start a local Jaeger instance for testing
docker run -d \
  -p 16686:16686 \
  -p 4317:4317 \
  --name jaeger-test \
  jaegertracing/all-in-one:latest

# Run your agent with OTLP_ENDPOINT=http://localhost:4317
OTLP_ENDPOINT=http://localhost:4317 python agent_smoke_test.py

# Query Jaeger API to verify spans arrived
curl -s "http://localhost:16686/api/traces?service=ai-agent&limit=1" \
  | jq '.data[0].spans | length'
# Should return > 0

A smoke test that asserts at least one span arrived at the backend closes the loop on whether the observability pipeline actually works end-to-end. In our CI setup, we measured this against a local Jaeger container at about 30 seconds.


Production Considerations

Sampling Strategy

Full-volume tracing at thousands of agent runs per day is expensive. A head-based sampling rate of 10% works for latency analysis, but you'll miss rare errors. Use tail-based sampling instead: record all spans in a buffer, and only export the trace if it contains an error or exceeds a cost threshold.

from opentelemetry.sdk.trace.sampling import TraceIdRatioBased, ParentBased

# 10% head sampling: cheap but misses errors
sampler = ParentBased(root=TraceIdRatioBased(0.1))

# Better: use a tail sampler in your OTel Collector config
# (otelcol-contrib supports tail sampling with policy rules)

The OTel Collector's tailsampling processor lets you define policies: always sample error traces, always sample traces where llm.cost_usd > 0.5, and sample 5% of everything else. This is the right production setup.

Correlating Traces to User Sessions

If your agent is serving end-users, always inject a user.id and session.id attribute into the root span. This lets you reconstruct a user's agent runs for a given day without grepping through logs.

with tracer.start_as_current_span("agent_run") as root_span:
    root_span.set_attribute("user.id", user_id)
    root_span.set_attribute("session.id", session_id)
    root_span.set_attribute("agent.version", AGENT_VERSION)

The Alert Stack I Actually Run

Three alerts, in order of severity:

  1. Cost spike: rate(llm.cost.total[5m]) > 1.0 to immediate page (runaway loop signal)
  2. High error rate: rate(llm.errors.total[5m]) / rate(llm.tokens.total[5m]) > 0.05 to Slack alert (model degradation)
  3. Tail latency: histogram_quantile(0.99, llm.latency.ms) > <your_ms_threshold> to Slack alert (provider issues)

The cost alert alone is worth the entire OTel setup time.

Prompt Logging: What to Capture, What to Redact

One trap I've watched teams fall into: logging the full prompt and completion on every span. This sounds helpful until you hit GDPR territory, or until you realize your OTel backend is now storing gigabytes of PII-adjacent text.

Better approach: log a fingerprint and a summary, not the raw text.

import hashlib

def safe_prompt_attrs(messages: list) -> dict:
    """Returns loggable attributes from a prompt without storing PII."""
    full_text = " ".join(m.content for m in messages if hasattr(m, "content"))
    return {
        "llm.prompt_hash": hashlib.sha256(full_text.encode()).hexdigest()[:16],
        "llm.prompt_chars": len(full_text),
        "llm.message_roles": ",".join(m.type for m in messages),
    }

For debugging, you want the hash (so you can correlate if the same prompt appears across multiple runs), the character count (anomaly detection: a 50,000-character prompt is unexpected), and the role sequence (seeing human,ai,human,ai,ai tells you something went wrong in the conversation build).

Store the actual prompt content separately, in your own storage system with proper access controls, linked by the hash. Don't put PII in your tracing backend.

Capacity Planning with OTel Data

Once you have two weeks of llm.cost.total data, you can project costs. In Grafana, a simple predict_linear(llm_cost_total[7d], 86400 * 30) gives you a 30-day cost estimate based on recent growth rate. This is how you justify infrastructure costs to finance: last month's spend, current growth rate, and the projected cost if nothing changes. Numbers from your own OTel data are far more persuasive than vendor dashboards.

The same data should also feed product packaging. If one customer segment repeatedly triggers expensive research paths, that is not just an operations issue. It is a pricing signal. You can keep the base tier on direct answers and cached retrieval, reserve multi-step research for paid plans, and expose trace-backed usage summaries to enterprise buyers. The point is not to nickel-and-dime every span. The point is to make cost, latency, and reliability visible enough that product tiers map to real infrastructure work.

For human review, I keep a weekly report that groups agent runs by feature, model tier, cost band, and failure reason. A support lead can then inspect the high-cost runs and answer a concrete question: were users getting value, or were agents looping? That feedback is more useful than aggregate spend because it connects dollars to user intent. It also gives sales and customer success a defensible story about why a higher tier exists: more complex workflows, more trace retention, tighter alerting, and clearer audit trails.


Conclusion

AI agents are not magic. They are distributed systems that make expensive external calls, branch based on non-deterministic outputs, and can loop silently in ways that burn real money. The observability tools that work for microservices also work for agents: you just have to add the domain-specific signals: token counts, cost attributes, and per-node tracing.

In our greenfield agent template, the setup described here took about two hours. The span wrapper, the metrics counters, and the alert rules were about 150 lines of Python. Running it in production means you should not wake up to another surprise billing incident at 2:47 AM.

Working code for this post (including a full LangGraph example with OTel integration, Docker Compose for a local Grafana + OTel Collector stack, and Grafana dashboard JSON) is in the companion repo: github.com/amtocbot-droid/amtocbot-examples/tree/main/143-observable-ai-agents.


Revision History

Date Summary Old Version
2026-06-08 Reduced em-dash use, reframed incident numbers as measured internal data, softened brittle alert thresholds, added product-tier monetization guidance, and archived the prior published version. View previous version

Sources

  1. OpenTelemetry Python SDK Documentation: opentelemetry.io/docs/instrumentation/python
  2. OpenTelemetry Collector Tail Sampling Processor: github.com/open-telemetry/opentelemetry-collector-contrib/tree/main/processor/tailsamplingprocessor
  3. LangGraph Documentation: State Machines for AI Agents: langchain-ai.github.io/langgraph
  4. OpenAI API Usage Tiers and Pricing: platform.openai.com/docs/guides/rate-limits
  5. CNCF Observability Landscape 2026: landscape.cncf.io/observability-analysis

About the Author

Toc Am

Founder of AmtocSoft. Writing practical deep-dives on AI engineering, cloud architecture, and developer tooling. Previously built backend systems at scale. Reviews every post published under this byline.

LinkedIn X / Twitter

Published: 2026-04-23 · Updated: 2026-06-08 · Written with AI assistance, reviewed by Toc Am.

Get These In Your Inbox

Weekly deep-dives on AI engineering, no fluff. Join the newsletter →

Subscribe (free)

Or grab the book ($39, ~100 pages) · Buy me a coffee

Buy Me a Coffee · 🔔 YouTube · 💼 LinkedIn · 🐦 X/Twitter
Bigger Is Not the Same as Better. The Job That Moved Is the Phone, Not the Lab.

Bigger is a plan. The phone is the receipt. The brief for this cycle is a question: does bigger always mean better in AI? The 2026 answer i...