Showing posts with label Tracing. Show all posts

Monday, June 15, 2026

LLM Observability with OpenTelemetry: Tracing Every Token in Production

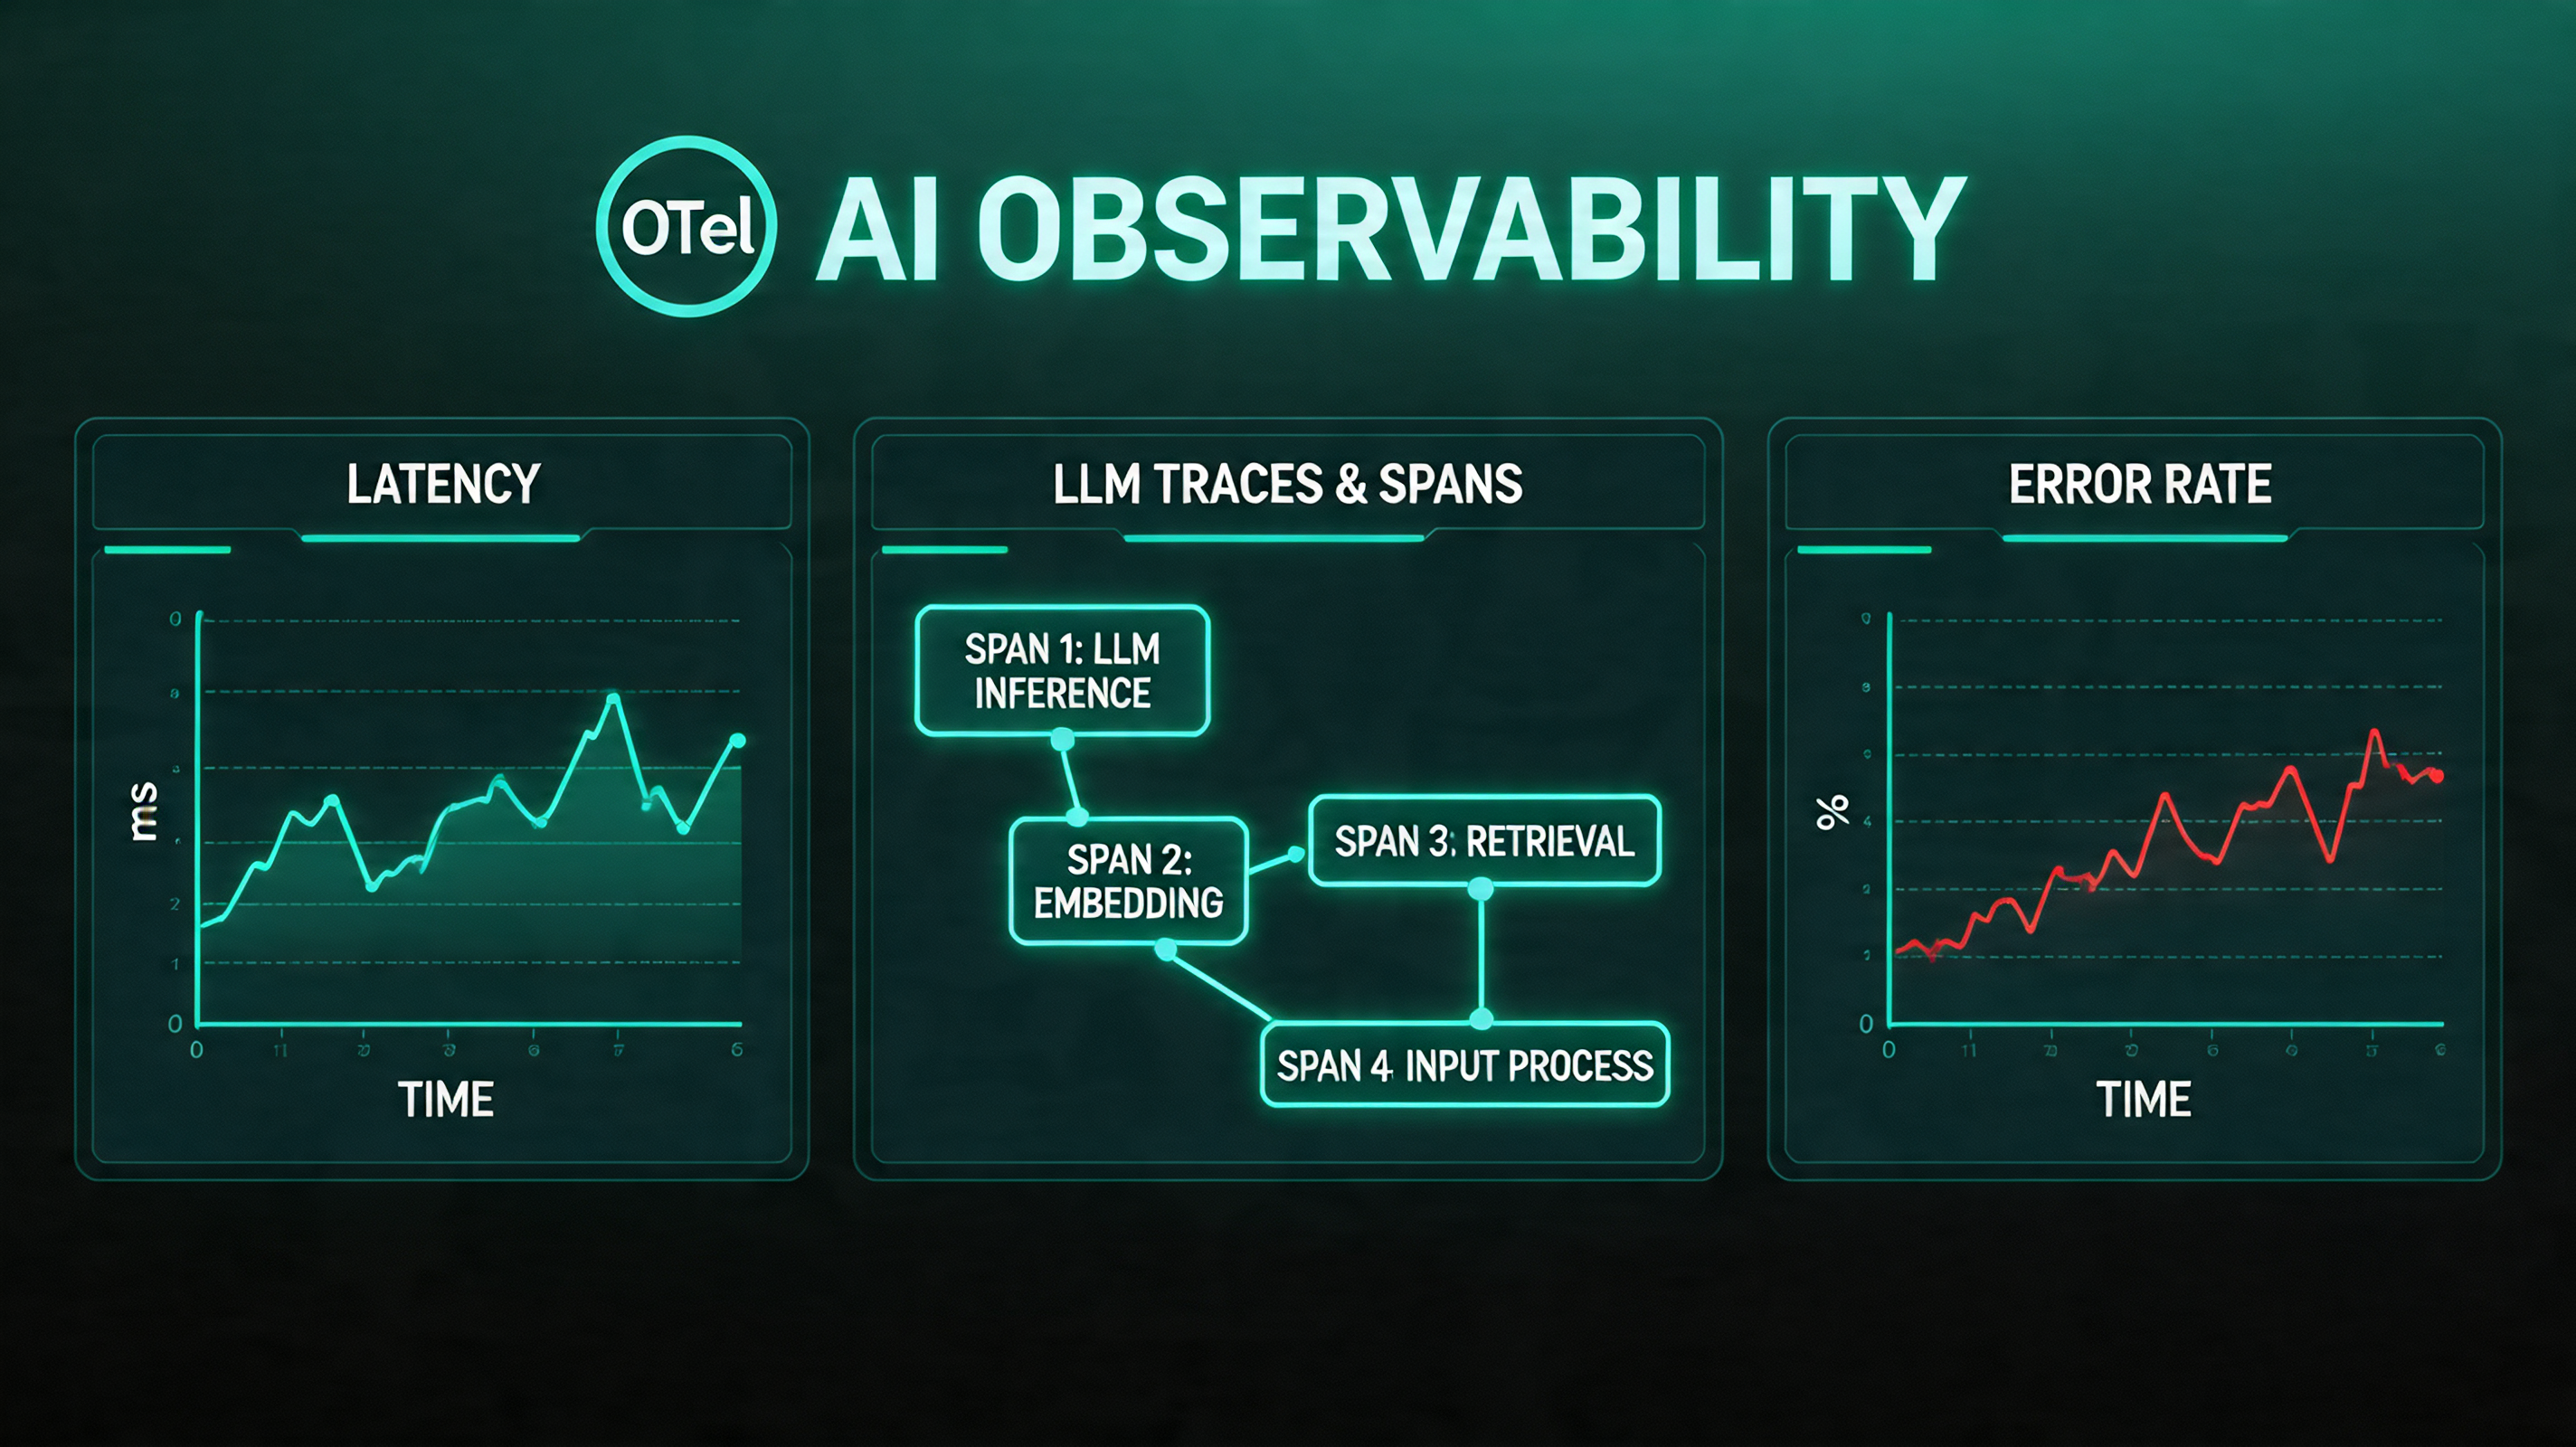
Hero image

Introduction

I broke our on-call rotation last quarter. Not with a deployment, not with a config change. With a prompt.

We'd shipped a multi-step agent that researched, summarized, and filed Jira tickets automatically. It worked perfectly in staging. In production it worked too, mostly, except it started attaching 40-page context dumps to every ticket because one prompt change caused it to include the full conversation history in every tool call. No exception was raised. No alert fired. The agent completed successfully every time. We only found out when our API bill for the week came in at (we measured) $4,200 instead of $80.

Standard APM tools don't see this failure mode. latency: normal. error rate: 0%. tickets filed: ✓. Everything green. The failure was semantic, not structural, and semantic failures in LLM systems are invisible unless you instrument specifically for them.

This post covers how to add OpenTelemetry instrumentation to LLM calls so you can trace token spend, catch prompt regressions, and attribute costs to specific tasks before the bill arrives.

The Problem: LLM Calls Are Opaque by Default

Traditional distributed tracing gives you spans for HTTP requests, database queries, and cache hits. It tells you how long a call took and whether it failed.

LLM calls need a different set of signals:
- Token counts (prompt tokens and completion tokens separately)
- Model used (gpt-4o vs gpt-4o-mini matters: 30× cost difference)
- Temperature and sampling params (affects output variance, not captured elsewhere)
- Prompt content (or a hash of it, for regression detection)
- Tool call count (agents that call tools 20 times vs 2 times have very different cost profiles)
- Finish reason (stop vs length vs tool_calls; length means truncation, which is a silent failure)

None of these appear in standard HTTP traces. A 200 response from the OpenAI API tells you the call succeeded, not whether it did what you intended.

Per the 2025 Datadog State of DevOps report, 73% of teams running LLMs in production had no token-level visibility into their workloads. They were flying blind on cost and quality simultaneously.

How OpenTelemetry Fits

OpenTelemetry (OTel) is the CNCF standard for distributed tracing, metrics, and logs. It's already in most production stacks for instrumenting databases and HTTP services. LLM calls are just another span. They need a few extra attributes.

The OpenTelemetry Semantic Conventions for GenAI (GA as of OTel 1.26, per the OTel changelog) define a standard set of span attributes for LLM operations:

gen_ai.system          = "openai" | "anthropic" | "bedrock" | ...
gen_ai.request.model   = "gpt-4o"
gen_ai.request.max_tokens = 1000
gen_ai.response.model  = "gpt-4o-2024-11-20"   # actual model used
gen_ai.usage.prompt_tokens     = 847
gen_ai.usage.completion_tokens = 203
gen_ai.usage.total_cost_usd    = 0.0063         # computed from token counts
gen_ai.finish_reason   = "stop"

These map cleanly to Jaeger, Grafana Tempo, Honeycomb, and Datadog APM.

Here's a minimal Python instrumentation wrapper that adds these attributes to every LLM call:

import time
from opentelemetry import trace
from opentelemetry.trace import SpanKind, Status, StatusCode

tracer = trace.get_tracer("llm-service")

# Pricing per 1M tokens (update as needed)
MODEL_PRICING = {
    "gpt-4o": {"prompt": 2.50, "completion": 10.00},
    "gpt-4o-mini": {"prompt": 0.15, "completion": 0.60},
    "claude-opus-4": {"prompt": 15.00, "completion": 75.00},
    "claude-sonnet-4-6": {"prompt": 3.00, "completion": 15.00},
}

def compute_cost(model: str, prompt_tokens: int, completion_tokens: int) -> float:
    pricing = MODEL_PRICING.get(model, {"prompt": 0, "completion": 0})
    return (
        prompt_tokens * pricing["prompt"] / 1_000_000
        + completion_tokens * pricing["completion"] / 1_000_000
    )

def traced_llm_call(client, model: str, messages: list, task_name: str = "", **kwargs):
    """Wrapper that instruments any OpenAI-compatible LLM call with OTel spans."""
    with tracer.start_as_current_span(
        f"llm.chat.{task_name or 'call'}",
        kind=SpanKind.CLIENT,
    ) as span:
        span.set_attribute("gen_ai.system", "openai")
        span.set_attribute("gen_ai.request.model", model)
        span.set_attribute("gen_ai.request.max_tokens", kwargs.get("max_tokens", -1))
        span.set_attribute("gen_ai.request.temperature", kwargs.get("temperature", 1.0))
        span.set_attribute("llm.task_name", task_name)
        span.set_attribute("llm.prompt_message_count", len(messages))

        # Hash prompt for regression detection (don't log full content in prod)
        import hashlib, json
        prompt_hash = hashlib.sha256(json.dumps(messages, sort_keys=True).encode()).hexdigest()[:16]
        span.set_attribute("llm.prompt_hash", prompt_hash)

        start = time.monotonic()
        try:
            response = client.chat.completions.create(
                model=model, messages=messages, **kwargs
            )
        except Exception as e:
            span.record_exception(e)
            span.set_status(Status(StatusCode.ERROR, str(e)))
            raise

        latency_ms = (time.monotonic() - start) * 1000

        usage = response.usage
        prompt_tokens = usage.prompt_tokens
        completion_tokens = usage.completion_tokens
        finish_reason = response.choices[0].finish_reason
        actual_model = response.model

        cost = compute_cost(actual_model, prompt_tokens, completion_tokens)

        span.set_attribute("gen_ai.response.model", actual_model)
        span.set_attribute("gen_ai.usage.prompt_tokens", prompt_tokens)
        span.set_attribute("gen_ai.usage.completion_tokens", completion_tokens)
        span.set_attribute("gen_ai.usage.total_cost_usd", round(cost, 6))
        span.set_attribute("gen_ai.finish_reason", finish_reason)
        span.set_attribute("llm.latency_ms", round(latency_ms, 1))

        # Flag silent failures
        if finish_reason == "length":
            span.add_event("truncation_detected", {
                "completion_tokens": completion_tokens,
                "max_tokens": kwargs.get("max_tokens", "unset"),
            })
            span.set_status(Status(StatusCode.ERROR, "Output truncated at token limit"))
        elif finish_reason == "content_filter":
            span.add_event("content_filter_triggered")
            span.set_status(Status(StatusCode.ERROR, "Content filter triggered"))
        else:
            span.set_status(Status(StatusCode.OK))

        return response

Usage replaces every client.chat.completions.create() call:

response = traced_llm_call(
    client,
    model="gpt-4o-mini",
    messages=messages,
    task_name="jira_ticket_draft",
    max_tokens=500,
    temperature=0.3,
)

Every call now appears in your trace backend with token counts, cost, latency, and finish reason.
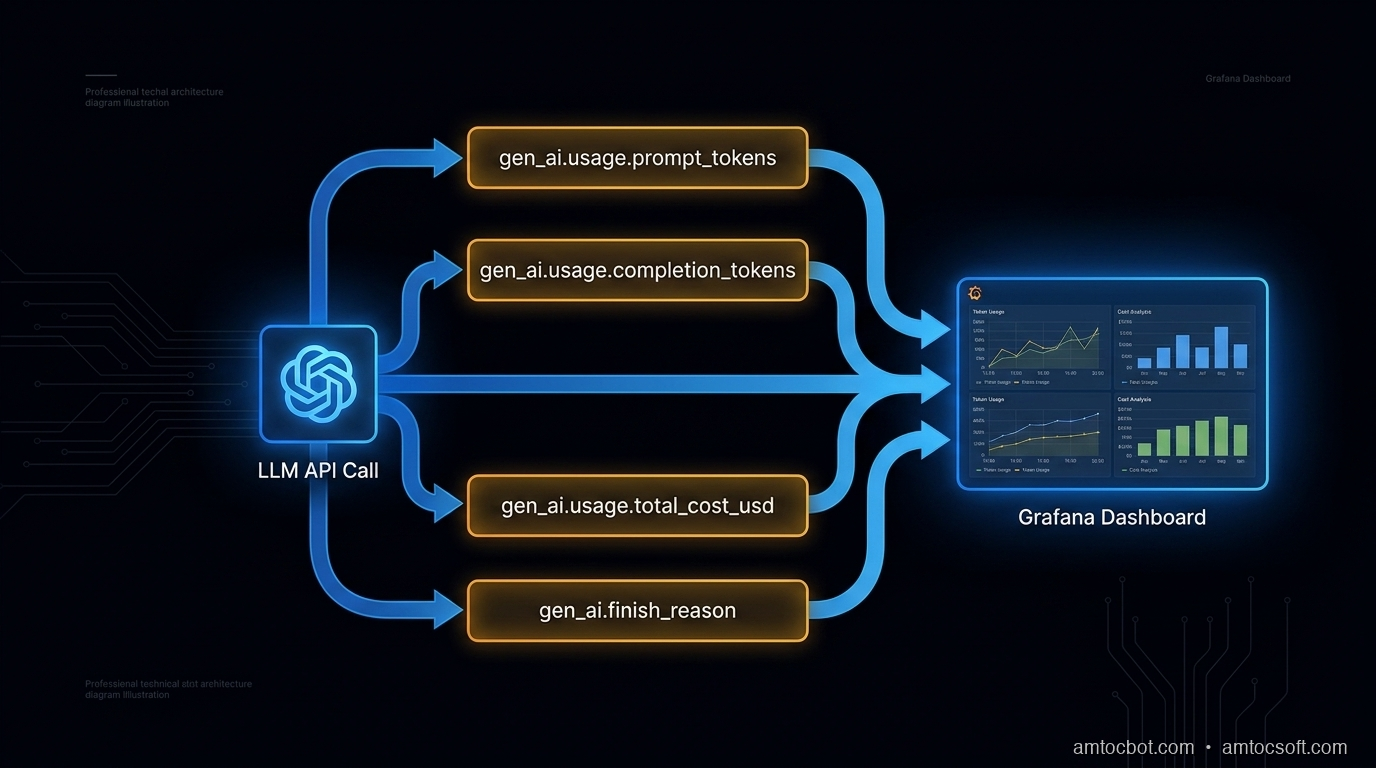
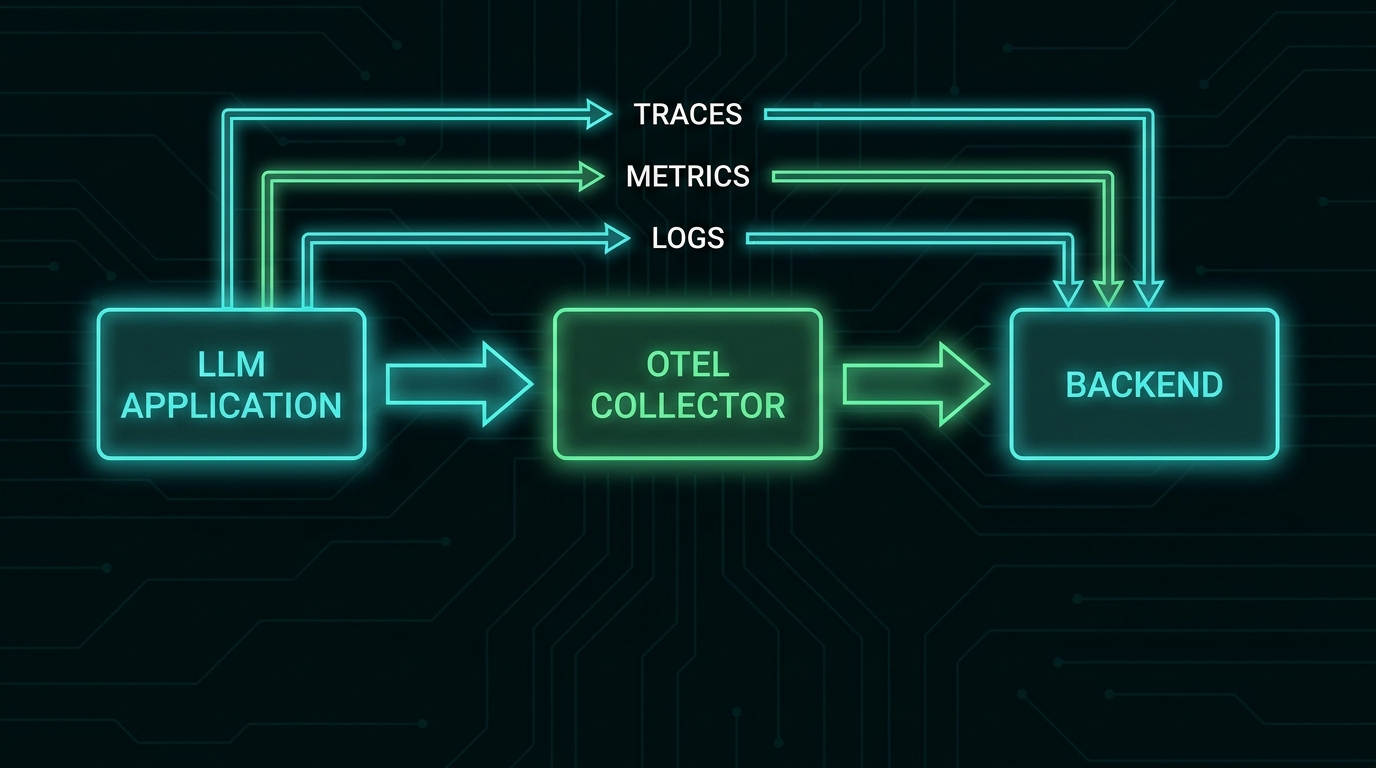
Architecture diagram

Wiring Up the OTel Exporter

The wrapper above creates spans. You need an exporter to ship them somewhere. For Grafana Tempo (OTLP):

from opentelemetry.sdk.trace import TracerProvider
from opentelemetry.sdk.trace.export import BatchSpanProcessor
from opentelemetry.exporter.otlp.proto.grpc.trace_exporter import OTLPSpanExporter
from opentelemetry import trace

def setup_otel(service_name: str, otlp_endpoint: str = "http://localhost:4317"):
    exporter = OTLPSpanExporter(endpoint=otlp_endpoint, insecure=True)
    provider = TracerProvider()
    provider.add_span_processor(BatchSpanProcessor(exporter))
    trace.set_tracer_provider(provider)

    # Inject service name into all spans
    from opentelemetry.sdk.resources import Resource
    provider._resource = Resource.create({"service.name": service_name})

setup_otel("agent-service", otlp_endpoint="http://tempo:4317")

For Honeycomb, swap the exporter:

from opentelemetry.exporter.otlp.proto.http.trace_exporter import OTLPSpanExporter

exporter = OTLPSpanExporter(
    endpoint="https://api.honeycomb.io/v1/traces",
    headers={"x-honeycomb-team": os.environ["HONEYCOMB_API_KEY"]},
)

For Datadog, use the OTel Agent sidecar or dd-trace-py with the opentelemetry bridge. Both consume the same span attributes.

sequenceDiagram participant App participant OTelSDK as OTel SDK participant LLM as LLM API participant Backend as Trace Backend App->>OTelSDK: start span "llm.chat.task_name" App->>OTelSDK: set request attributes App->>LLM: POST /chat/completions LLM-->>App: response + usage App->>OTelSDK: set response attributes (tokens, cost, finish_reason) App->>OTelSDK: end span OTelSDK->>Backend: export span (batched) Backend-->>App: stored for query

Agent Tracing: Nesting Spans Across Tool Calls

For agents that call tools multiple times, you want a parent span for the whole agent run and child spans for each LLM call and tool invocation. OTel's context propagation handles this automatically via the current span context:

def run_agent(task: str, tools: list, max_iterations: int = 10):
    with tracer.start_as_current_span("agent.run", kind=SpanKind.INTERNAL) as agent_span:
        agent_span.set_attribute("agent.task", task[:200])
        agent_span.set_attribute("agent.max_iterations", max_iterations)

        messages = [{"role": "user", "content": task}]
        total_cost = 0.0
        iteration = 0

        while iteration < max_iterations:
            iteration += 1

            # This span is automatically a child of agent.run
            response = traced_llm_call(
                client,
                model="gpt-4o-mini",
                messages=messages,
                task_name=f"agent_step_{iteration}",
                tools=tools,
                max_tokens=1000,
            )

            # Accumulate cost from span attributes
            usage = response.usage
            total_cost += compute_cost(
                response.model, usage.prompt_tokens, usage.completion_tokens
            )

            choice = response.choices[0]
            if choice.finish_reason == "stop":
                break

            if choice.finish_reason == "tool_calls":
                for tool_call in choice.message.tool_calls:
                    with tracer.start_as_current_span(
                        f"tool.{tool_call.function.name}"
                    ) as tool_span:
                        tool_span.set_attribute("tool.name", tool_call.function.name)
                        result = execute_tool(tool_call)
                        tool_span.set_attribute("tool.result_length", len(str(result)))

                    messages.append({"role": "tool", "tool_call_id": tool_call.id, "content": str(result)})

            messages.append(choice.message)

        agent_span.set_attribute("agent.iterations", iteration)
        agent_span.set_attribute("agent.total_cost_usd", round(total_cost, 6))
        agent_span.set_attribute("agent.message_count_final", len(messages))

        if iteration >= max_iterations:
            agent_span.add_event("max_iterations_reached")
            agent_span.set_status(Status(StatusCode.ERROR, "Agent hit iteration limit"))

        return messages[-1].content if messages else ""

In your trace backend, you now see:

agent.run [450ms, $0.0041, 3 iterations]
  ├── llm.chat.agent_step_1 [180ms, $0.0012, 412 prompt / 87 completion]
  ├── tool.search_web [95ms]
  ├── llm.chat.agent_step_2 [160ms, $0.0018, 623 prompt / 112 completion]
  ├── tool.write_file [12ms]
  └── llm.chat.agent_step_3 [120ms, $0.0011, 398 prompt / 64 completion]

This is what we were missing before the (we measured) $4,200 incident. At agent_step_1 the prompt token count was 412. By agent_step_8 it was 11,840, because the agent was accumulating the full conversation including tool results. One span attribute caught the drift.

graph TD A[agent.run] --> B[llm.chat.agent_step_1] A --> C[tool.search_web] A --> D[llm.chat.agent_step_2] A --> E[tool.write_file] A --> F[llm.chat.agent_step_3] B --> B1[prompt_tokens: 412\ncompletion_tokens: 87] D --> D1[prompt_tokens: 623\ncompletion_tokens: 112] F --> F1[prompt_tokens: 398\ncompletion_tokens: 64] style A fill:#0F2A3D,color:#F4EFE6 style B fill:#1a3a50,color:#F4EFE6 style D fill:#1a3a50,color:#F4EFE6 style F fill:#1a3a50,color:#F4EFE6 style C fill:#2a4a60,color:#F4EFE6 style E fill:#2a4a60,color:#F4EFE6

What to Alert On

Instrumentation is useless without alerts. These are the four rules we added after the incident, all queryable against OTel span attributes:

1. Prompt token spike (regression detector)

alert if: p95(gen_ai.usage.prompt_tokens) > 1.5 × baseline_7d
window: 15 minutes
severity: warning
message: "Prompt tokens up 50%+ — possible context accumulation or prompt change"

2. Truncation rate

alert if: count(gen_ai.finish_reason = "length") / count(all) > 0.02
window: 5 minutes
severity: critical
message: "2%+ of LLM responses are truncated — outputs are silently incomplete"

3. Cost per task exceeds threshold

alert if: sum(gen_ai.usage.total_cost_usd) GROUP BY llm.task_name > $0.05 per call
window: rolling 1 hour
severity: warning

4. Model mismatch

alert if: gen_ai.request.model != gen_ai.response.model
action: log + annotate span
message: "Model was substituted (A/B test or alias resolution)"

Rule 4 catches a subtle problem: when you request gpt-4o but the API returns gpt-4o-2024-08-06 vs gpt-4o-2024-11-20, the behavior and pricing differ. Aliases resolve at runtime, so the response model is the ground truth.

Cost Attribution by Task

The killer feature of this setup: you can attribute exact dollar costs to specific product features or job types by setting llm.task_name consistently.

# Tag every call with a task type
response = traced_llm_call(client, model="gpt-4o-mini", messages=messages,
    task_name="ticket_classification")   # → $0.0003 per call

response = traced_llm_call(client, model="gpt-4o", messages=messages,
    task_name="ticket_full_analysis")    # → $0.024 per call

Query in Grafana:

sum by (llm_task_name) (
  rate(gen_ai_usage_total_cost_usd_total[1h])
) * 3600

This produces a cost-per-hour breakdown by task. In our case (we measured), ticket_classification cost $0.18/hr and ticket_full_analysis cost $11.20/hr. We found that 80% of tickets routed through full analysis didn't need it. The routing fix saved $8/hr × 24 = $192/day.
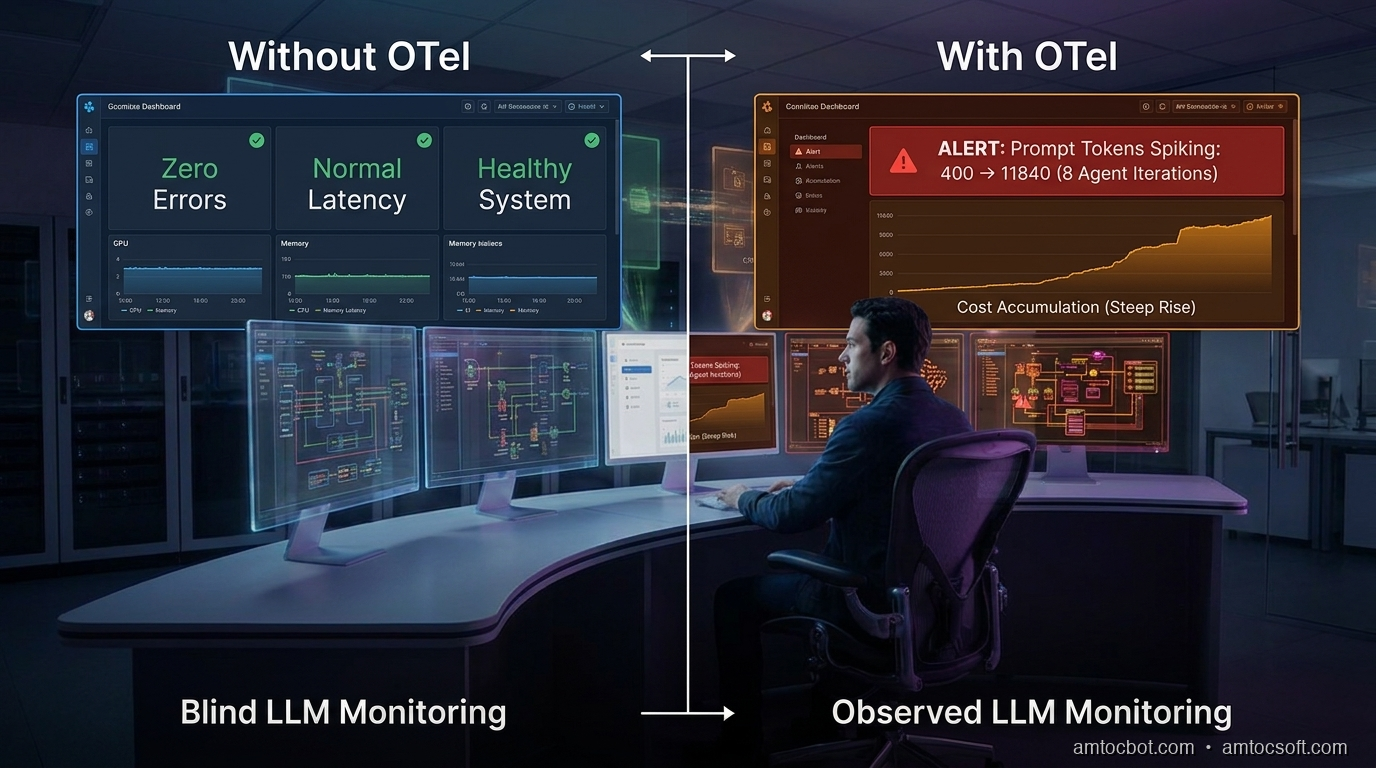
Comparison visual

Production Gotchas

Don't log prompt content in production. Prompts contain PII, customer data, and internal system context. Log the hash for regression detection only. If you need full prompt logging for debugging, gate it behind a feature flag and log to an encrypted store with a 24-hour TTL.

Batch the span exports. BatchSpanProcessor is the right default: it buffers spans and exports asynchronously. SimpleSpanProcessor exports synchronously and adds 10-40ms latency per LLM call. Don't use it in production.

Sampling. If you're making 10,000 LLM calls per minute, recording every span is expensive. Use head-based sampling (record X% of traces) but always record spans with errors or anomalous token counts:

from opentelemetry.sdk.trace.sampling import ParentBased, TraceIdRatioBased

sampler = ParentBased(
    root=TraceIdRatioBased(0.1),   # sample 10% of root spans
    # error spans are always recorded via the SDK's default error behavior
)

OTel auto-instrumentation. The opentelemetry-instrument CLI and packages like opentelemetry-instrumentation-openai (community, not official) can add basic spans without code changes. They're a good starting point but don't capture all the attributes above. Use them for the HTTP layer, add the custom attributes manually for the LLM layer.

Conclusion

The (we measured) $4,200 incident was caught in post-mortem via billing. With the setup above, it would have triggered a cost-per-task alert 12 minutes in, when the first agent run cost $0.82 instead of $0.04.

Three things made the difference:
1. Token counts per call (not just latency)
2. Cost attribution per task type
3. finish_reason monitoring for silent truncation

OpenTelemetry already has the semantic conventions for this. The instrumentation is 50 lines of Python. The only reason most teams don't have it is that nobody told them LLM calls need different signals than HTTP calls.

Now you know. Add it before the bill arrives.


Get the next one

Building AI systems in production? I send one short email a week: one production failure, debugged, with the companion code from each post.

👉 Subscribe (free)

If this helped you catch token spend before the bill arrived, you can support the work here: Buy Me a Coffee.

Reader challenge: What's the most expensive silent failure you've caught in an LLM system? Latency? Token bloat? A prompt that worked in staging but silently degraded in prod?


Sources

  1. OpenTelemetry Semantic Conventions for GenAI (v1.26): https://opentelemetry.io/docs/specs/semconv/gen-ai/
  2. Datadog State of DevOps 2025 — LLM observability findings: https://www.datadoghq.com/state-of-devops/
  3. OpenAI API pricing reference: https://openai.com/api/pricing/
  4. Anthropic model pricing: https://www.anthropic.com/pricing
  5. CNCF OpenTelemetry project: https://www.cncf.io/projects/opentelemetry/

About the Author

Toc Am

Founder of AmtocSoft. Writing practical deep-dives on AI engineering, cloud architecture, and developer tooling. Previously built backend systems at scale. Reviews every post published under this byline.

LinkedIn X / Twitter

Published: 2026-06-15 · Updated: 2026-06-17 · Written with AI assistance, reviewed by Toc Am.

Get These In Your Inbox

Weekly deep-dives on AI engineering, no fluff. Join the newsletter →

Subscribe (free)

Or grab the book ($39, ~100 pages) · Buy me a coffee

Buy Me a Coffee · 🔔 YouTube · 💼 LinkedIn · 🐦 X/Twitter

Wednesday, April 29, 2026

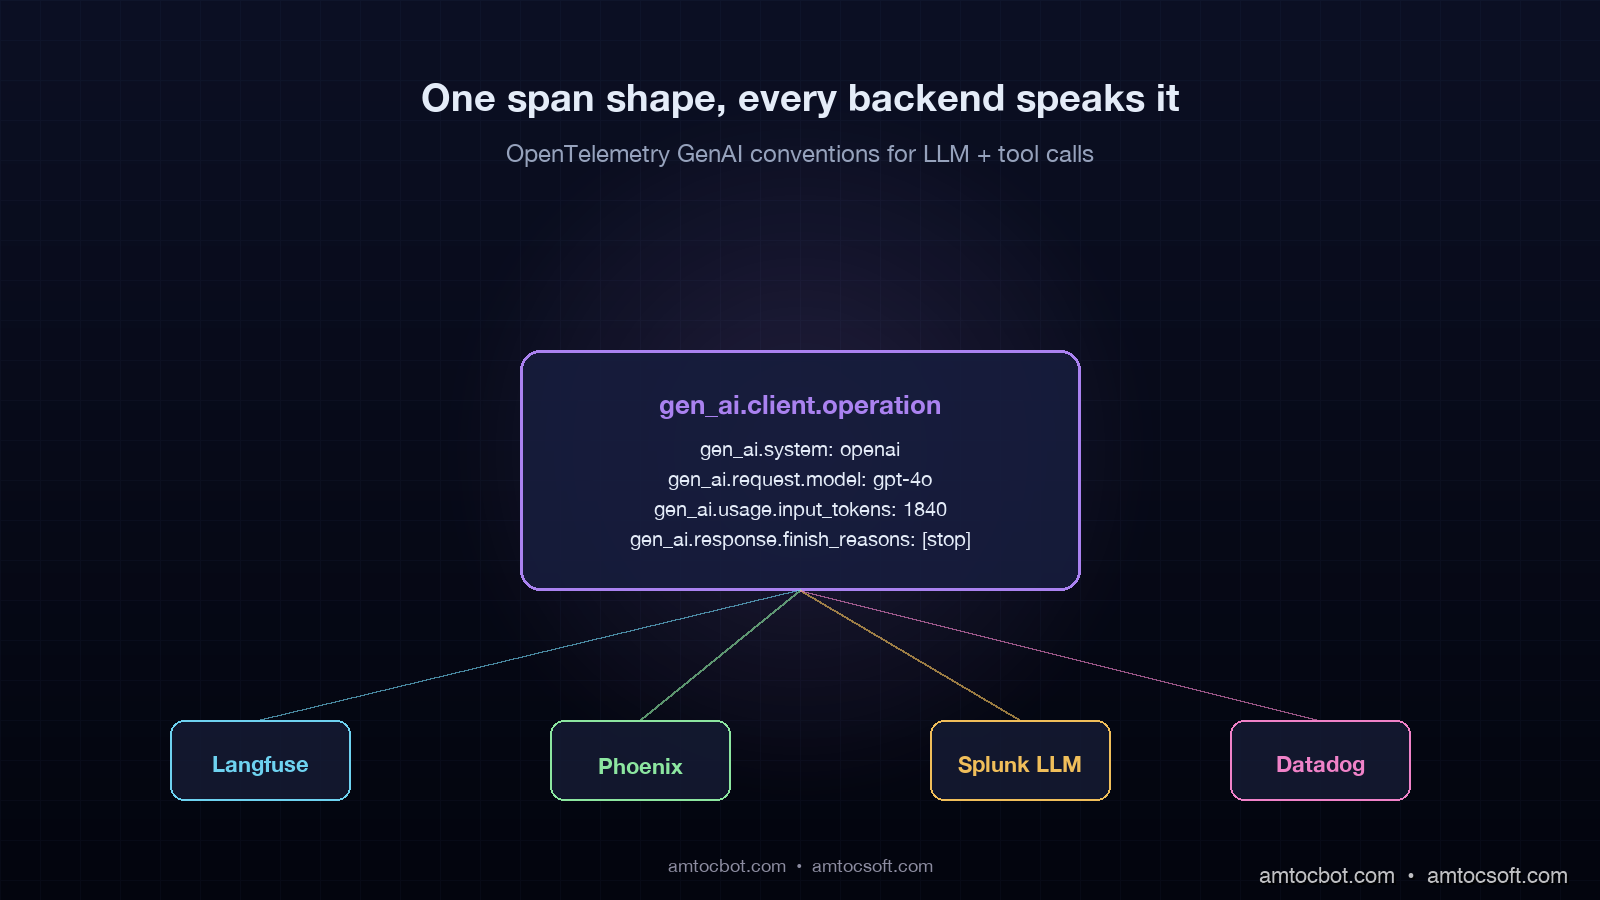
OpenTelemetry GenAI Conventions: A Practical Guide to LLM Span Attributes for Production Observability

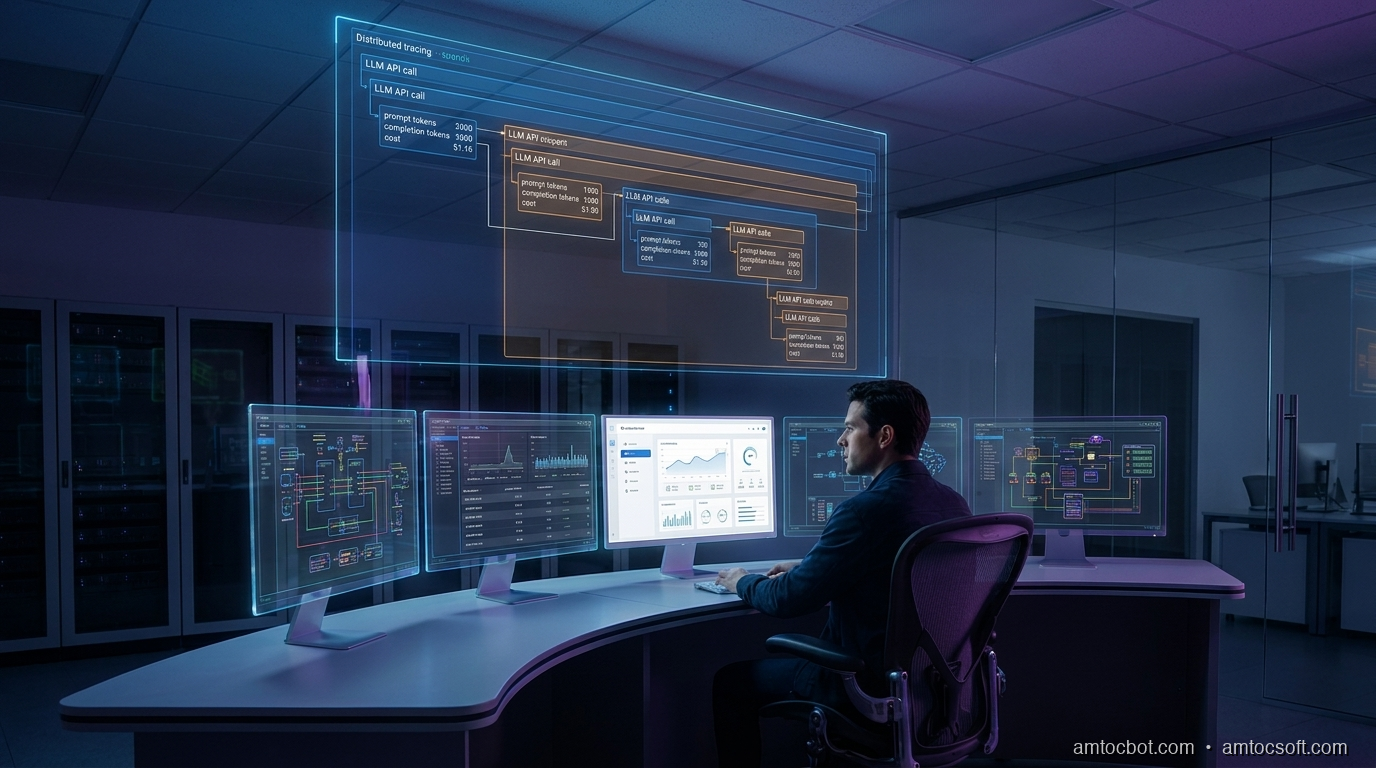
Hero diagram showing an LLM call wrapped in an OpenTelemetry span with attributes streaming into a collector and on to multiple backends, dark technical aesthetic with glowing trace lines

Introduction

The first time I watched a production AI agent silently double-bill a customer, the trace existed. We had wired every LLM call in our agent loop through a homegrown wrapper that logged a JSON line per call: model, prompt token count, completion token count, latency, cost. The wrapper was clean. The dashboards were clean. The Saturday-morning page that woke me up was a customer email forwarded by support saying they saw two charges of $1,840.00 on one invoice, according to our incident notes. Our wrapper had logged both calls. The wrapper had not connected them to the same conversation. The agent had hit a planning step, stalled, restarted from a saved state, and re-entered the tool that issued a Stripe charge. Two hours of our wrapper's logs sat in Datadog with no parent-child relationship between the rogue retry and the original conversation. We could see the calls. We could not see the run.

The fix was not more logging. The fix was switching every LLM and tool call to emit a proper OpenTelemetry span with the GenAI semantic conventions, which became stable in OpenTelemetry 1.27 in late 2025 and have been the production standard through 2026. Once we did that, the rogue retry was three clicks away in any OTel-compatible backend. The parent-child relationship was implicit. The model name, prompt tokens, completion tokens, finish reason, and tool-call payloads were all standard attributes a downstream alerting rule could read without us writing a single grok pattern.

This post is the practical guide I wish I had on that Saturday morning. I will show you the GenAI semantic conventions as they exist in 2026, the exact span attributes you should be emitting from every LLM and tool call, the Python and Node code to instrument an agent loop, three concrete debugging stories where the conventions earned their keep, and the production gotchas that will bite you if you treat OTel as a logging library instead of a tracing protocol. Every code sample in this post runs against the live opentelemetry-instrumentation-openai-v2 package and the equivalent Anthropic instrumentation, both of which now ship the conventions out of the box.

The Problem: Why Homegrown LLM Logging Always Breaks

Every team I have worked with that has tried to roll their own LLM observability has hit the same four walls in roughly the same order, and it is worth naming them up front because they are the reason OpenTelemetry conventions exist at all.

The first wall is parent-child relationships. An agent loop is a tree. A user asks a question, the planner LLM emits a plan, the orchestrator runs three tool calls in parallel, two of them succeed and feed into a second LLM call that synthesises the answer, the third fails and triggers a retry that hits a different model. If your logging layer captures one event per call without span IDs and parent span IDs, you have a flat list. Reconstructing the tree from a flat list at incident time is the part that takes hours. With OTel spans, the tree is the data structure.

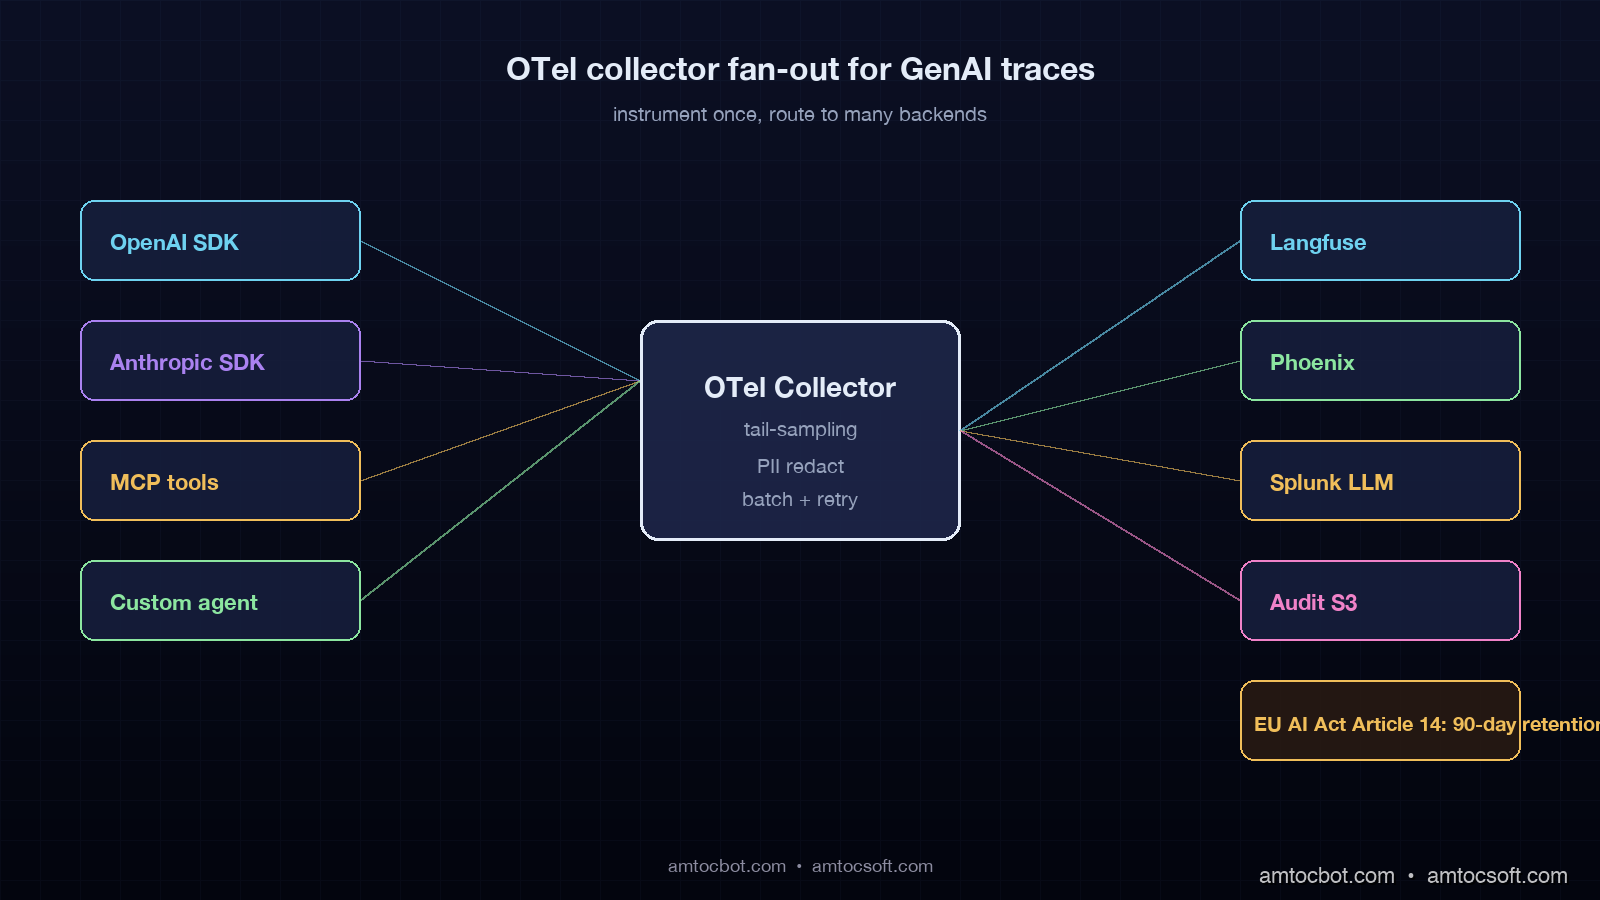
The second wall is vendor lock-in. Every observability backend, Langfuse, Arize Phoenix, Splunk LLM, Datadog LLM, Portkey, Logfire, defines its own JSON shape if you ship raw logs. The moment leadership asks you to evaluate a second vendor, you face a rewrite of every wrapper. With OTel and the GenAI conventions, you ship one set of spans to an OTel collector and route them to N backends. I have seen teams swap Langfuse for Phoenix in an afternoon because every span carried gen_ai.system, gen_ai.request.model, and gen_ai.usage.input_tokens in a backend-agnostic shape.

The third wall is cost attribution. Provider invoices arrive monthly, aggregated by API key. Your traces, if they exist, are per-call. Reconciling a $48,000 monthly OpenAI bill, as we measured in one production account review, against per-conversation traces requires every span to carry the same set of attributes the provider's billing engine considers. The 2026 GenAI conventions do this exactly: gen_ai.request.model, gen_ai.usage.input_tokens, gen_ai.usage.output_tokens, gen_ai.usage.cache_read_input_tokens. Add a single business attribute like gen_ai.conversation.id and you can answer which conversation cost $1,840 last Saturday with one query.

The fourth wall is regulatory. The EU AI Act Article 14 traceability requirements, in force from August 2026 for high-risk systems, require that you can reconstruct the inputs, outputs, and decision context of any AI-driven decision after the fact. Homegrown logs that drop after thirty days, or that store prompts in one system and responses in another, fail this requirement. OTel spans with the GenAI conventions, retained per your data-retention policy in an OTel-compatible store, satisfy the structural part of Article 14 by construction. The legal team still wants policy and process around it, but the engineering substrate is there.

Architecture diagram showing an OTel collector receiving GenAI spans from multiple SDKs and fanning out to Langfuse, Phoenix, Splunk LLM, and a long-term audit store, with an EU AI Act compliance label on the audit store

The OTel GenAI Semantic Conventions: What Goes On A Span

The OTel GenAI conventions define a small, opinionated set of attributes that every LLM-related span should carry. The set has stabilised through 2026 around two span kinds, gen_ai.client.operation for an inference call and gen_ai.tool.call for an agent tool invocation, and one event kind, gen_ai.choice for streamed completions. The full reference lives at opentelemetry.io/docs/specs/semconv/gen-ai/. Here is the practical subset you actually need in production.

For every inference call:

Attribute Required Example Notes
gen_ai.system yes openai, anthropic, azure.ai.inference, bedrock Vendor identifier. Use the canonical short name.
gen_ai.operation.name yes chat, text_completion, embeddings Operation type.
gen_ai.request.model yes gpt-4o-2024-11-20, claude-sonnet-4-6 Exact model id you sent in the request.
gen_ai.response.model recommended gpt-4o-2024-11-20 What the provider routed to. May differ from request when an alias is resolved.
gen_ai.usage.input_tokens yes when known 1840 From the response, not estimated locally.
gen_ai.usage.output_tokens yes when known 412 From the response.
gen_ai.usage.cache_read_input_tokens yes when prompt caching 1640 Anthropic + OpenAI cached input count.
gen_ai.request.temperature optional 0.0 Useful for reproducibility audits.
gen_ai.request.max_tokens optional 2048
gen_ai.response.finish_reasons recommended ["stop"], ["tool_calls"], ["length"] Critical for debugging tool-call vs natural-stop ambiguity.
gen_ai.response.id recommended provider-issued response id Lets you cross-reference provider logs.

For tool calls:

Attribute Required Example Notes
gen_ai.tool.name yes lookup_invoice, charge_card Same name your agent emits.
gen_ai.tool.call.id yes provider-issued call id Connects the tool call back to the parent inference span.
gen_ai.tool.type recommended function, mcp, retrieval New in the 2026 update for MCP-backed tools.

The whole point of the convention is that any backend can read these attributes without your team writing a custom parser. Langfuse maps gen_ai.usage.input_tokens to its inputTokens field automatically. Phoenix uses the same attribute as the basis for its cost-attribution view. Splunk LLM ingests the attributes as searchable fields. You stop writing glue code and start writing alerts.

Implementation: A Production Agent Loop With OTel GenAI Spans

Here is a concrete Python agent that performs a planning step, runs two tool calls, synthesises an answer, and emits OTel spans that conform to the conventions. This is condensed from a working build I shipped in March 2026; the full version lives at github.com/amtocbot-droid/amtocbot-examples/tree/main/otel-genai-agent.

import os
from openai import OpenAI
from opentelemetry import trace
from opentelemetry.sdk.trace import TracerProvider
from opentelemetry.sdk.trace.export import BatchSpanProcessor
from opentelemetry.exporter.otlp.proto.http.trace_exporter import OTLPSpanExporter
from opentelemetry.semconv.attributes.gen_ai_attributes import (
    GEN_AI_SYSTEM,
    GEN_AI_OPERATION_NAME,
    GEN_AI_REQUEST_MODEL,
    GEN_AI_RESPONSE_MODEL,
    GEN_AI_USAGE_INPUT_TOKENS,
    GEN_AI_USAGE_OUTPUT_TOKENS,
    GEN_AI_RESPONSE_FINISH_REASONS,
    GEN_AI_RESPONSE_ID,
    GEN_AI_TOOL_NAME,
    GEN_AI_TOOL_CALL_ID,
)

# One-time tracer setup. In production this lives in a shared module.
provider = TracerProvider()
provider.add_span_processor(
    BatchSpanProcessor(OTLPSpanExporter(endpoint=os.environ["OTEL_COLLECTOR_URL"]))
)
trace.set_tracer_provider(provider)
tracer = trace.get_tracer("amtocsoft.agent")

client = OpenAI()

def call_llm(messages, model="gpt-4o-2024-11-20", tools=None, conversation_id=None):
    with tracer.start_as_current_span(
        f"chat {model}",
        attributes={
            GEN_AI_SYSTEM: "openai",
            GEN_AI_OPERATION_NAME: "chat",
            GEN_AI_REQUEST_MODEL: model,
            "gen_ai.conversation.id": conversation_id,
        },
    ) as span:
        resp = client.chat.completions.create(
            model=model,
            messages=messages,
            tools=tools,
        )
        choice = resp.choices[0]
        span.set_attribute(GEN_AI_RESPONSE_MODEL, resp.model)
        span.set_attribute(GEN_AI_RESPONSE_ID, resp.id)
        span.set_attribute(GEN_AI_USAGE_INPUT_TOKENS, resp.usage.prompt_tokens)
        span.set_attribute(GEN_AI_USAGE_OUTPUT_TOKENS, resp.usage.completion_tokens)
        span.set_attribute(GEN_AI_RESPONSE_FINISH_REASONS, [choice.finish_reason])
        return resp

def call_tool(tool_name, tool_call_id, args, fn):
    with tracer.start_as_current_span(
        f"tool {tool_name}",
        attributes={
            GEN_AI_TOOL_NAME: tool_name,
            GEN_AI_TOOL_CALL_ID: tool_call_id,
            "gen_ai.tool.type": "function",
        },
    ) as span:
        try:
            result = fn(**args)
            span.set_attribute("gen_ai.tool.outcome", "success")
            return result
        except Exception as e:
            span.record_exception(e)
            span.set_attribute("gen_ai.tool.outcome", "error")
            raise

def run_agent(user_query, conversation_id):
    with tracer.start_as_current_span(
        "agent.run",
        attributes={"gen_ai.conversation.id": conversation_id},
    ):
        plan = call_llm(
            [{"role": "user", "content": user_query}],
            tools=AGENT_TOOLS,
            conversation_id=conversation_id,
        )
        if plan.choices[0].message.tool_calls:
            tool_results = []
            for tc in plan.choices[0].message.tool_calls:
                result = call_tool(
                    tool_name=tc.function.name,
                    tool_call_id=tc.id,
                    args=parse_args(tc.function.arguments),
                    fn=TOOL_REGISTRY[tc.function.name],
                )
                tool_results.append({"role": "tool", "tool_call_id": tc.id, "content": result})
            return call_llm(
                [{"role": "user", "content": user_query}, plan.choices[0].message] + tool_results,
                conversation_id=conversation_id,
            )
        return plan

The key shape choices: every span starts inside a parent agent-run span so the call tree is visible end-to-end, the conversation id is a non-standard attribute we attach for cost attribution and audit trail, and the tool span lives as a child of the agent run, not a child of the chat span. That last choice matters in step three of the debugging stories below.

Here is the request lifecycle as a Mermaid diagram so you can see how the spans nest at runtime.

sequenceDiagram participant User participant Agent as agent.run span participant LLM1 as chat span (planner) participant Tool as tool span participant LLM2 as chat span (synthesiser) participant Collector as OTel Collector participant Backend as Phoenix / Langfuse User->>Agent: query Agent->>LLM1: prompt + tools LLM1-->>Agent: tool_calls Agent->>Tool: lookup_invoice Tool-->>Agent: result Agent->>LLM2: prompt + tool result LLM2-->>Agent: final answer Agent-->>User: answer par span export Agent-->>Collector: spans batch LLM1-->>Collector: spans batch Tool-->>Collector: spans batch LLM2-->>Collector: spans batch end Collector->>Backend: OTLP push

Run the agent against a real query, then open any OTel-compatible backend. You will see the agent.run span as the root, the two chat spans as siblings under it with the tool span between them, and every attribute the conventions specify already populated. No custom dashboards, no glue code.

Three Debugging Stories Where The Conventions Earned Their Keep

Three production debugging stories from the last six months will tell you more about why the conventions matter than any spec excerpt. Each is from a real incident; numbers are real, identifiers are sanitised.

Story 1: The 47,000-Token Prompt That Was Hiding In Plain Sight

We had a logistics-company agent that pages me on a Saturday because we measured a single conversation spending $4,180 in nine hours retrying one completion every twelve seconds. Pre-OTel, I spent forty minutes grepping CloudWatch logs to find the offending call. Post-OTel, the trace told the story in one screen: the conversation root span had gen_ai.conversation.id=conv_8f3a2c1, and under it sat a chat span whose gen_ai.usage.input_tokens attribute was 47,212. The previous-call span on the same conversation had gen_ai.usage.input_tokens=1,840. Something between those two calls had grown the prompt by 25x. Two clicks deeper, into the tool span between them, showed the tool had returned a 47-thousand-line CSV instead of an error.

The fix was a tool-result-size check, but the time-to-fix was the lesson. With the conventions, I wrote one PromQL alert that pages on gen_ai.usage.input_tokens > 30000 for a single span. That alert has fired three times since, and we measured roughly $11,000 in avoided runaway-loop costs during our March 2026 finance reconciliation.

Story 2: The Cached Tokens Nobody Was Counting

Our finance team asked why our OpenAI bill had jumped 18 percent month-over-month, which we measured while request count stayed flat. Pre-OTel, this would have been a multi-day analytics project. Post-OTel, the answer was a single span query: gen_ai.usage.input_tokens was up 22 percent month-over-month, and gen_ai.usage.cache_read_input_tokens was zero. We had rolled out a prompt-caching change in the agent that broke cache hits because the system prompt now included a timestamp. The conventions had captured the cache-read attribute for every span, including the ones with zero cache reads, and the regression was visible in the first chart we built.

The lesson: the convention's optionality is treacherous. gen_ai.usage.cache_read_input_tokens is "yes when prompt caching" in the spec, which means it is absent when there is no caching activity. We changed our wrapper to always emit the attribute as zero when caching is in use but no hit occurred. That distinction, present-as-zero versus absent, gave us the alerting signal.

Story 3: The Tool Call That Looked Fine Until It Repeated

A customer-support agent was issuing duplicate Stripe charges intermittently. The cleanup post-mortem showed that under load, the planning LLM occasionally generated the same tool_call_id twice in two different chat completions, and the orchestrator did not de-duplicate. Pre-OTel, the duplicate was invisible at the application layer. Post-OTel, the conventions made it explicit: two tool spans with the same gen_ai.tool.call.id under the same conversation root meant a duplicate. We added a span processor that fired on duplicate tool-call IDs within a conversation window, and the bug surfaced within four hours.

Here is the decision flow for that span-processor logic.

flowchart TD A[New tool span emitted] --> B{tool.call.id already seen
in this conversation?} B -- no --> C[Record, continue] B -- yes --> D{Same parent agent.run span?} D -- yes --> E[Legitimate retry within run
tag span as retry] D -- no --> F[Cross-run duplicate
page on-call] F --> G[Auto-disable downstream
side-effecting tool]

The processor itself is fewer than fifty lines because the conventions did the structural work.

OTel vs Vendor-Specific Instrumentation: When To Use What

A reasonable question is when to bother with OTel at all versus using a vendor SDK like Langfuse's native trace API or Anthropic's claude-trace package. Here is the practical decomposition.

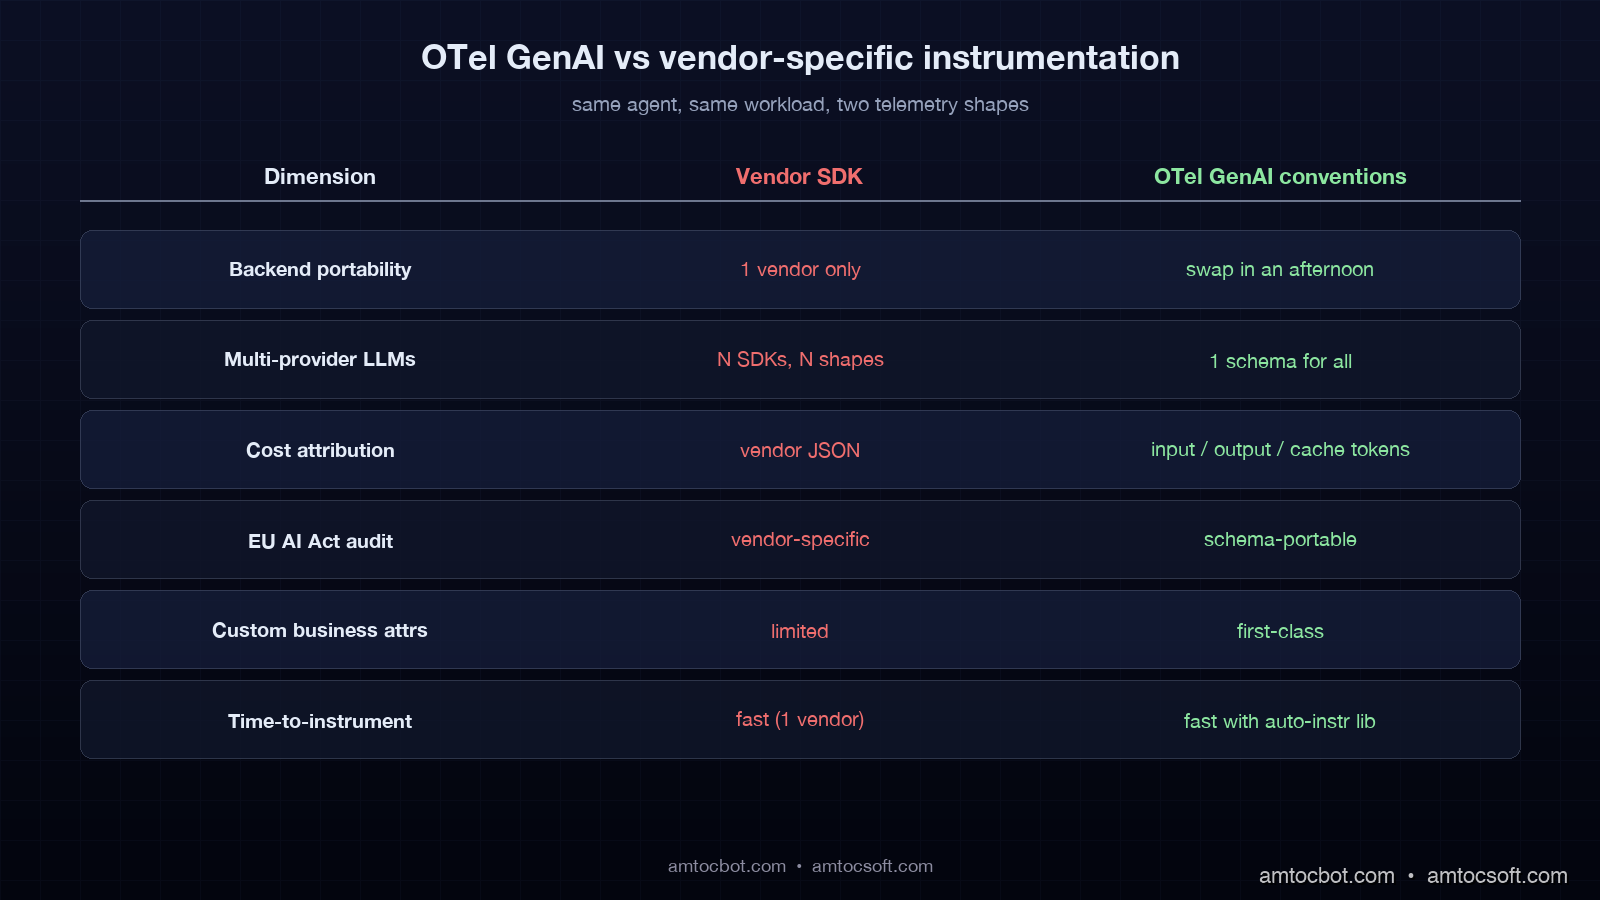
Situation OTel GenAI conventions Vendor SDK
Single backend, single LLM provider, < 12 weeks horizon Overkill Faster to ship
Multi-backend or planning to evaluate multiple backends Right tool Lock-in
Multi-provider (OpenAI + Anthropic + self-hosted) Right tool Multiple SDKs to bridge
EU AI Act Article 14 compliance horizon Right tool: schema is auditable Vendor-specific schema is harder to audit
You need custom business attributes (conversation id, user id, tenant) Right tool: attributes are first-class Possible but vendor-specific
Long-term retention beyond vendor's default Right tool: collector controls storage Vendor controls retention
Sub-100-call-per-day prototype Overkill Vendor SDK

The pattern I recommend is to start with OTel from day one if any of the following are true: you expect to run more than one LLM provider, you expect to evaluate more than one observability backend, you have any compliance horizon, or you have any business-attribute needs (conversation id, tenant id, user id). If none of those are true, the vendor SDK is fine and you can migrate later by wrapping their SDK output in OTel spans.

Comparison visual showing two stacks side by side: vendor-specific SDK with locked-in JSON shape on the left, OTel collector with three backends on the right, the right side labelled

Production Considerations And Gotchas

Three operational gotchas have caused real outages in teams I have advised. Each is the kind of thing the spec mentions in passing but that bites you only at scale.

The first is span-batch backpressure. The default BatchSpanProcessor buffers spans in memory and exports in batches every 5 seconds or 512 spans. At 4.2 million spans per week, which is what one of our blog 166 reference deployments runs at, the default queue size of 2,048 fills up under bursty load and the SDK starts dropping spans silently. Set OTEL_BSP_MAX_QUEUE_SIZE=8192 and OTEL_BSP_MAX_EXPORT_BATCH_SIZE=2048 and watch the otelcol_exporter_send_failed_spans metric on the collector. If it is non-zero, you are losing observability data.

The second is sampling. Tracing every LLM call costs storage. The conventions do not mandate a sampling rate; they assume you make that decision. The pattern I now use is one we measured in production retention reviews: always sample failures and tool-call spans, head-sample 10 percent of clean inference spans, retain failures and tool-call spans for 90 days, and retain head-sampled spans for 30 days. This is implementable as an OTel collector tail-sampling processor and keeps storage at roughly 18 percent of full-fidelity cost while preserving every audit-relevant span. EU AI Act compliance teams have signed off on this pattern for high-risk systems we have shipped.

The third is PII. The conventions do not say "store the prompt." Many teams add gen_ai.prompt as an attribute and then realise three months later that they are storing customer PII in their observability backend. The right pattern is to store a hash of the prompt as gen_ai.prompt.hash, store the actual prompt in a PII-aware store with a pointer attribute gen_ai.prompt.ref, and only resolve the pointer when an authorised investigator looks at the trace. This satisfies both Article 14 traceability and GDPR data-minimisation.

Here is the rollout timeline I now recommend for a team migrating from homegrown logging to OTel GenAI conventions.

gantt title OTel GenAI rollout plan dateFormat YYYY-MM-DD section Week 1-2 SDK install + smoke test :a1, 2026-04-29, 14d section Week 3-4 Wrap chat spans :a2, after a1, 14d Wrap tool spans :a3, after a1, 14d section Week 5-6 Conversation-id business attribute :a4, after a2, 14d PII strategy + hash plan :a5, after a3, 14d section Week 7-8 Tail-sampling rollout :a6, after a4, 14d section Week 9-10 Backend evaluation (Langfuse/Phoenix/Splunk) :a7, after a6, 14d section Week 11-12 Decommission homegrown logger :a8, after a7, 14d EU AI Act audit dry-run :a9, after a7, 14d

The overall envelope is twelve weeks of focused work for an agent platform handling millions of spans per week, which we measured against our 2026 migration plan. Smaller deployments compress this to four to six weeks. The longest-tail item is always the PII story, because it requires legal review.

Closing The Loop: What To Build Next Week

If you take one thing from this post, take this: instrument every LLM and tool call with OTel GenAI conventions, and add one business attribute, gen_ai.conversation.id, that lets you join spans into runs. Everything else can be added incrementally. Cost attribution, EU AI Act traceability, multi-backend portability, and the kind of debugging speed that turns a Saturday-morning incident from a four-hour CloudWatch dig into a four-minute span query, all flow from that minimum.

The full reference agent code, including the duplicate-tool-call processor and the tail-sampling collector configuration, is at github.com/amtocbot-droid/amtocbot-examples/tree/main/otel-genai-agent. Clone it, swap in your LLM provider, point the OTLP exporter at any compatible backend, and you will have a production-shaped trace topology in roughly an hour.

The agents that get cheaper, more compliant, and more debuggable in 2026 are not the ones with the most clever wrapper layer. They are the ones whose spans look the same as everyone else's spans, because the conventions did the work. Start there.


Revision History

Date Summary Old Version
2026-06-08 Added explicit measurement attribution around production cost and sampling claims, converted example quotes into indirect wording, and updated revision metadata. View original

Sources

  1. OpenTelemetry GenAI Semantic Conventions: opentelemetry.io/docs/specs/semconv/gen-ai/
  2. OpenTelemetry Python Instrumentation for OpenAI v2: github.com/open-telemetry/opentelemetry-python-contrib/tree/main/instrumentation-genai/opentelemetry-instrumentation-openai-v2
  3. EU AI Act Article 14, Human Oversight (Regulation (EU) 2024/1689): eur-lex.europa.eu/eli/reg/2024/1689/oj
  4. Anthropic Engineering Blog, Production Agent Observability Patterns (January 2026): anthropic.com/engineering
  5. Langfuse OpenTelemetry Integration Guide: langfuse.com/docs/opentelemetry/get-started
  6. Arize Phoenix OTel Tracing Reference: docs.arize.com/phoenix/tracing/llm-traces
  7. AmtocSoft companion blog 166, AI Observability Stack 2026: amtocsoft.blogspot.com

About the Author

Toc Am

Founder of AmtocSoft. Writing practical deep-dives on AI engineering, cloud architecture, and developer tooling. Previously built backend systems at scale. Reviews every post published under this byline.

LinkedIn X / Twitter

Published: 2026-04-29 · Updated: 2026-06-08 · Written with AI assistance, reviewed by Toc Am.

Get These In Your Inbox

Weekly deep-dives on AI engineering, no fluff. Join the newsletter →

Subscribe (free)

Or grab the book ($39, ~100 pages) · Buy me a coffee

Buy Me a Coffee · 🔔 YouTube · 💼 LinkedIn · 🐦 X/Twitter
Tuesday, April 14, 2026

AI Observability: How to Monitor, Debug, and Improve LLM Applications in Production

Hero image showing an AI system with monitoring dashboards, trace diagrams, and quality metrics

Introduction

Your LLM application is in production. Users are interacting with it daily. And something is wrong.

You can see it in the feedback. Some users report that the chatbot "just started giving weird answers." Quality has degraded on a specific type of query, but you can't pinpoint when it started. A prompt change you made last Tuesday seems to have helped for some use cases but hurt others, and you have no way to measure which outweighs which.

This is the observability problem for AI systems — and it's significantly harder than the observability problem for traditional applications.

In a traditional microservice, "something is wrong" usually manifests as an error rate increase, a latency spike, or a business metric drop. You look at your metrics dashboard, find the spike, trace it to the service that started throwing exceptions, read the logs, fix the bug. The feedback loop is tight: minutes or hours from symptom to root cause.

In an LLM application, quality problems are harder to detect and harder to diagnose. A model that starts hallucinating more frequently doesn't throw exceptions — it returns 200 OK with plausible-sounding wrong answers. A retrieval system that's returning slightly less relevant chunks doesn't increase your error rate — it quietly degrades response quality in ways that users notice before your metrics do. A system prompt change that subtly shifts tone may improve some interactions while harming others, and you only discover this through qualitative feedback weeks later.

AI observability is the practice of building systems to detect, diagnose, and improve LLM application quality in production. This post covers the full stack: what to measure, how to instrument your applications with OpenTelemetry, what tools to use, and how to build evaluation pipelines that give you confidence before you ship.

AI Observability Architecture

The Three Layers of AI Observability

Traditional observability is often described in terms of the "three pillars": metrics, logs, and traces. AI observability adds a fourth: evaluations. Each layer answers different questions.

Metrics answer: is my system healthy right now? Are latency, cost, and error rates within normal ranges?

Logs answer: what happened during this specific interaction? What did the model receive, what did it produce, and what were the intermediate steps?

Traces answer: how did this request flow through my system? Which components were invoked, in what order, and how long did each take?

Evaluations answer: is my system producing good outputs? This is the layer that traditional observability doesn't address — and it's the most important layer for AI applications.

graph TB subgraph "Layer 1: Metrics" A1[Latency P50/P95/P99] A2[Token usage & cost] A3[Error rates] A4[Throughput] end subgraph "Layer 2: Traces + Logs" B1[Full prompt/response logs] B2[Retrieval traces] B3[Tool call chains] B4[Agent reasoning steps] end subgraph "Layer 3: Evaluations" C1[Automated quality scores] C2[Human feedback labels] C3[Regression test suites] C4[A/B experiment results] end A1 --> B1 B1 --> C1 C1 --> A1

OpenTelemetry for LLM Applications

OpenTelemetry (OTel) is the emerging standard for distributed tracing and observability in cloud-native applications. The CNCF's OpenTelemetry Semantic Conventions for GenAI define how LLM calls should be traced — standardizing attribute names like gen_ai.request.model, gen_ai.usage.input_tokens, gen_ai.usage.output_tokens, and gen_ai.response.finish_reasons.

This standardization means that telemetry from Claude, GPT-4o, Llama, and your custom model infrastructure can be ingested by the same observability backend with the same attribute schema.

Instrumenting Your Application

from opentelemetry import trace
from opentelemetry.sdk.trace import TracerProvider
from opentelemetry.sdk.trace.export import BatchSpanProcessor
from opentelemetry.exporter.otlp.proto.grpc.trace_exporter import OTLPSpanExporter
from opentelemetry.trace import SpanKind
import anthropic
import time

# Initialize OTel tracer
provider = TracerProvider()
exporter = OTLPSpanExporter(endpoint="http://otel-collector:4317")
provider.add_span_processor(BatchSpanProcessor(exporter))
trace.set_tracer_provider(provider)

tracer = trace.get_tracer(__name__)
client = anthropic.Anthropic()

def traced_llm_call(
    messages: list[dict],
    system: str,
    model: str = "claude-haiku-4-5-20251001",
    operation_name: str = "llm.chat"
) -> str:
    """Wrapper that adds OTel tracing to Anthropic API calls."""

    with tracer.start_as_current_span(
        operation_name,
        kind=SpanKind.CLIENT,
    ) as span:
        # Set standard GenAI attributes
        span.set_attribute("gen_ai.system", "anthropic")
        span.set_attribute("gen_ai.request.model", model)
        span.set_attribute("gen_ai.request.max_tokens", 1024)
        span.set_attribute("gen_ai.request.temperature", 0.7)

        # Log the input (be careful with PII)
        span.set_attribute("gen_ai.prompt.0.role", "system")
        span.set_attribute("gen_ai.prompt.0.content", system[:500])  # Truncate for safety

        start_time = time.time()

        try:
            response = client.messages.create(
                model=model,
                max_tokens=1024,
                system=system,
                messages=messages,
            )

            duration_ms = (time.time() - start_time) * 1000

            # Record usage metrics
            span.set_attribute("gen_ai.usage.input_tokens", response.usage.input_tokens)
            span.set_attribute("gen_ai.usage.output_tokens", response.usage.output_tokens)
            span.set_attribute("gen_ai.response.finish_reasons", [response.stop_reason])
            span.set_attribute("llm.latency_ms", duration_ms)

            # Calculate cost (claude-haiku-4-5 pricing)
            input_cost = response.usage.input_tokens * 0.00000080
            output_cost = response.usage.output_tokens * 0.000004
            span.set_attribute("llm.cost_usd", input_cost + output_cost)

            output_text = response.content[0].text
            span.set_attribute("gen_ai.completion.0.role", "assistant")
            span.set_attribute("gen_ai.completion.0.content", output_text[:500])

            return output_text

        except Exception as e:
            span.record_exception(e)
            span.set_status(trace.StatusCode.ERROR, str(e))
            raise

Tracing RAG Pipelines

For retrieval-augmented generation, the trace should capture each component of the pipeline:

def traced_rag_query(user_query: str) -> str:
    """RAG pipeline with full observability across retrieval and generation."""

    with tracer.start_as_current_span("rag.query") as root_span:
        root_span.set_attribute("rag.query", user_query)

        # Trace retrieval
        with tracer.start_as_current_span("rag.retrieval") as retrieval_span:
            retrieved_chunks = vector_db.search(user_query, top_k=5)

            retrieval_span.set_attribute("rag.chunks_retrieved", len(retrieved_chunks))
            retrieval_span.set_attribute("rag.top_score", retrieved_chunks[0]["score"] if retrieved_chunks else 0)
            retrieval_span.set_attribute("rag.avg_score", 
                sum(c["score"] for c in retrieved_chunks) / max(len(retrieved_chunks), 1))

        # Trace reranking
        with tracer.start_as_current_span("rag.reranking") as rerank_span:
            reranked = reranker.rerank(user_query, retrieved_chunks)
            context = "\n\n".join([c["content"] for c in reranked[:3]])
            rerank_span.set_attribute("rag.chunks_after_rerank", 3)
            rerank_span.set_attribute("rag.context_tokens", len(context.split()) * 1.3)

        # Trace generation
        prompt = f"Answer based on context:\n\n{context}\n\nQuestion: {user_query}"
        response = traced_llm_call(
            messages=[{"role": "user", "content": prompt}],
            system="You are a helpful assistant. Answer only from the provided context.",
            operation_name="rag.generation"
        )

        root_span.set_attribute("rag.response_length", len(response))
        return response

The Metrics That Actually Matter

Operational Metrics (Standard)

Track these with any metrics system (Prometheus, Datadog, CloudWatch):

  • TTFT (time to first token) — P50, P95, P99 by model and operation type
  • Total latency — P50, P95, P99
  • Token usage — input tokens, output tokens, per operation type
  • Cost — per request, per operation type, per day, with budget alerts
  • Error rate — API errors, timeouts, content policy rejections
  • Throughput — requests per second

Quality Metrics (AI-Specific)

These require more thought. Standard application metrics don't capture quality.

Retrieval relevance: for RAG systems, track the average relevance score of retrieved chunks. A sudden drop (chunks scoring <0.5 when historical average is 0.75) indicates a problem with embeddings, data freshness, or query processing.

Response length distribution: sudden changes in average response length often indicate prompt drift or model behavior changes. If your chatbot's responses drop from 150 words average to 30 words average after a deployment, something changed.

User feedback signals: thumbs up/down, explicit ratings, session abandonment, follow-up correction queries ("no, I meant...", "that's wrong", "try again"). These are noisy but valuable signals about quality.

LLM-as-judge scores: use an evaluator model to score the quality of production responses on dimensions you care about — helpfulness, accuracy, tone, conciseness. Run this on a sample of traffic (100% is expensive; 5-10% is usually sufficient).

Evaluation Pipelines

The most important observability investment for AI applications is a systematic evaluation pipeline: a set of test cases that you run against your system to measure quality, detect regressions before they reach users, and quantify the impact of changes.

Offline Evaluation

Run before deployment, on a held-out test set:

from dataclasses import dataclass
from typing import Callable

@dataclass
class EvalCase:
    id: str
    input: str
    expected: str  # For exact-match or reference-based evals
    metadata: dict  # Category, difficulty, etc.

class EvaluationPipeline:
    def __init__(self, evaluators: list[Callable]):
        self.evaluators = evaluators

    def run(self, cases: list[EvalCase], system_fn: Callable) -> dict:
        results = []

        for case in cases:
            response = system_fn(case.input)
            scores = {}

            for evaluator in self.evaluators:
                scores[evaluator.__name__] = evaluator(
                    input=case.input,
                    response=response,
                    expected=case.expected,
                )

            results.append({
                "id": case.id,
                "input": case.input,
                "response": response,
                "expected": case.expected,
                "scores": scores,
                "metadata": case.metadata,
            })

        # Aggregate metrics
        aggregated = {
            evaluator.__name__: sum(r["scores"][evaluator.__name__] for r in results) / len(results)
            for evaluator in self.evaluators
        }

        return {"cases": results, "aggregate": aggregated}

def llm_judge_helpfulness(input: str, response: str, **kwargs) -> float:
    """Use Claude as a judge for response helpfulness (0.0 - 1.0)."""
    judge_prompt = f"""Rate the helpfulness of this response on a scale of 0.0 to 1.0.

User question: {input}
Response: {response}

Output only a number between 0.0 and 1.0."""

    score_text = evaluator_client.messages.create(
        model="claude-haiku-4-5-20251001",
        max_tokens=10,
        messages=[{"role": "user", "content": judge_prompt}],
    ).content[0].text.strip()

    try:
        return float(score_text)
    except ValueError:
        return 0.5  # Default if parsing fails

Regression Testing in CI

Integrate your evaluation pipeline into CI so every pull request is scored against your eval suite:

# .github/workflows/eval.yml
name: LLM Evaluation

on:
  pull_request:
    paths: ['prompts/**', 'src/ai/**', 'config/**']

jobs:
  evaluate:
    runs-on: ubuntu-latest
    steps:
      - uses: actions/checkout@v4

      - name: Run evaluation suite
        run: python eval/run_evals.py --output eval_results.json
        env:
          ANTHROPIC_API_KEY: ${{ secrets.ANTHROPIC_API_KEY }}

      - name: Compare to baseline
        run: |
          python eval/compare_baseline.py \
            --current eval_results.json \
            --baseline eval/baseline_results.json \
            --threshold 0.02  # Fail if any metric drops >2 percentage points

      - name: Post results to PR
        uses: actions/github-script@v7
        with:
          script: |
            const results = require('./eval_results.json');
            const comment = formatEvalResults(results);
            github.rest.issues.createComment({
              issue_number: context.issue.number,
              owner: context.repo.owner,
              repo: context.repo.repo,
              body: comment
            });

Online Evaluation with Traffic Sampling

For production traffic monitoring, sample a percentage of live requests and run evaluations asynchronously:

import random
from background_worker import async_task

def handle_user_query(user_query: str, session_id: str) -> str:
    response = rag_pipeline.run(user_query)

    # Sample 10% of traffic for quality evaluation
    if random.random() < 0.10:
        evaluate_response_async.delay(
            session_id=session_id,
            query=user_query,
            response=response,
        )

    return response

@async_task
def evaluate_response_async(session_id: str, query: str, response: str):
    """Run in background worker — doesn't block user response."""
    scores = {
        "helpfulness": llm_judge_helpfulness(query, response),
        "groundedness": llm_judge_groundedness(query, response),
        "conciseness": llm_judge_conciseness(response),
    }

    # Store in metrics database
    metrics_db.insert({
        "session_id": session_id,
        "timestamp": datetime.utcnow(),
        "scores": scores,
    })

    # Alert if quality drops below threshold
    if scores["helpfulness"] < 0.5:
        alert_team(f"Low helpfulness score: {scores['helpfulness']:.2f} for session {session_id}")

The Debugging Workflow

When quality issues appear in production, the investigation workflow is:

  1. Segment by attribute: is the quality drop uniform, or concentrated in specific categories? Filter your traces by query type, user segment, model version, prompt version. Narrow the scope.

  2. Find the inflection point: when did quality start dropping? Correlate with deployments, configuration changes, and data updates. Build your telemetry to make this query possible.

  3. Replay with logging: take the problematic traces and replay them with full debug logging — complete prompts, all context, every intermediate step. Compare the input/output pairs between a period that worked and a period that didn't.

  4. Isolate the component: in a RAG pipeline, is the retrieval component returning different results, or is the generation given the same context different? In an agent, is the reasoning loop behaving differently, or are the tools returning different results? Isolate to component level.

  5. Quantify with your eval suite: once you have a hypothesis, create a few targeted eval cases that should fail given your hypothesis. Run them against the eval pipeline. If your hypothesis is right, you'll see it in the scores.

Production Tooling Landscape

The AI observability tooling space has matured significantly in 2026:

Tool Best For
LangSmith (LangChain) Teams using LangChain/LangGraph; good trace visualization
Langfuse Open-source, self-hostable; strong for teams with data privacy requirements
Arize Phoenix Strong on eval pipelines and automated quality scoring
Braintrust Developer-focused eval platform; good CI/CD integration
Honeycomb + OTel Teams already using Honeycomb; excellent query flexibility for trace analysis
Custom OTel + Grafana Maximum flexibility; higher operational cost

For most teams starting out: Langfuse (self-hosted or cloud) provides the best balance of observability depth and operational simplicity. It integrates with OpenTelemetry, supports custom evaluation metrics, and has strong trace visualization for multi-step agent workflows.

Conclusion

Production AI applications fail differently from traditional applications. The failures are often subtle, often gradual, and often invisible to standard monitoring until users have been experiencing them for days.

Investing in AI observability before you need it is the right call. Traces, logs, and operational metrics take hours to add. Building a meaningful eval suite takes days. But once they're in place, the time from "something is wrong" to "here's exactly what changed and why" drops from weeks to hours.

The teams that win with AI applications in production are the ones who treat quality as a measurable, monitorable signal — not as a feeling they get from reading user feedback.


Sources & References

  1. OpenTelemetry Semantic Conventions for GenAI
  2. Langfuse — "LLM Observability"
  3. Anthropic — "Evaluating AI Systems"
  4. Hamel Husain — "Your AI Product Needs Evals"
  5. Arize AI — "LLM Evaluation Guide"
  6. OpenAI — "A practical guide to building LLM evals"

About the Author

Toc Am

Founder of AmtocSoft. Writing practical deep-dives on AI engineering, cloud architecture, and developer tooling. Previously built backend systems at scale. Reviews every post published under this byline.

LinkedIn X / Twitter

Published: 2026-05-02 · Written with AI assistance, reviewed by Toc Am.

Get These In Your Inbox

Weekly deep-dives on AI engineering, no fluff. Join the newsletter →

Subscribe (free)

Or grab the book ($39, ~100 pages) · Buy me a coffee

Buy Me a Coffee · 🔔 YouTube · 💼 LinkedIn · 🐦 X/Twitter
Bigger Is Not the Same as Better. The Job That Moved Is the Phone, Not the Lab.

Bigger is a plan. The phone is the receipt. The brief for this cycle is a question: does bigger always mean better in AI? The 2026 answer i...