Introduction
Your LLM application is in production. Users are interacting with it daily. And something is wrong.
You can see it in the feedback. Some users report that the chatbot "just started giving weird answers." Quality has degraded on a specific type of query, but you can't pinpoint when it started. A prompt change you made last Tuesday seems to have helped for some use cases but hurt others, and you have no way to measure which outweighs which.
This is the observability problem for AI systems — and it's significantly harder than the observability problem for traditional applications.
In a traditional microservice, "something is wrong" usually manifests as an error rate increase, a latency spike, or a business metric drop. You look at your metrics dashboard, find the spike, trace it to the service that started throwing exceptions, read the logs, fix the bug. The feedback loop is tight: minutes or hours from symptom to root cause.
In an LLM application, quality problems are harder to detect and harder to diagnose. A model that starts hallucinating more frequently doesn't throw exceptions — it returns 200 OK with plausible-sounding wrong answers. A retrieval system that's returning slightly less relevant chunks doesn't increase your error rate — it quietly degrades response quality in ways that users notice before your metrics do. A system prompt change that subtly shifts tone may improve some interactions while harming others, and you only discover this through qualitative feedback weeks later.
AI observability is the practice of building systems to detect, diagnose, and improve LLM application quality in production. This post covers the full stack: what to measure, how to instrument your applications with OpenTelemetry, what tools to use, and how to build evaluation pipelines that give you confidence before you ship.
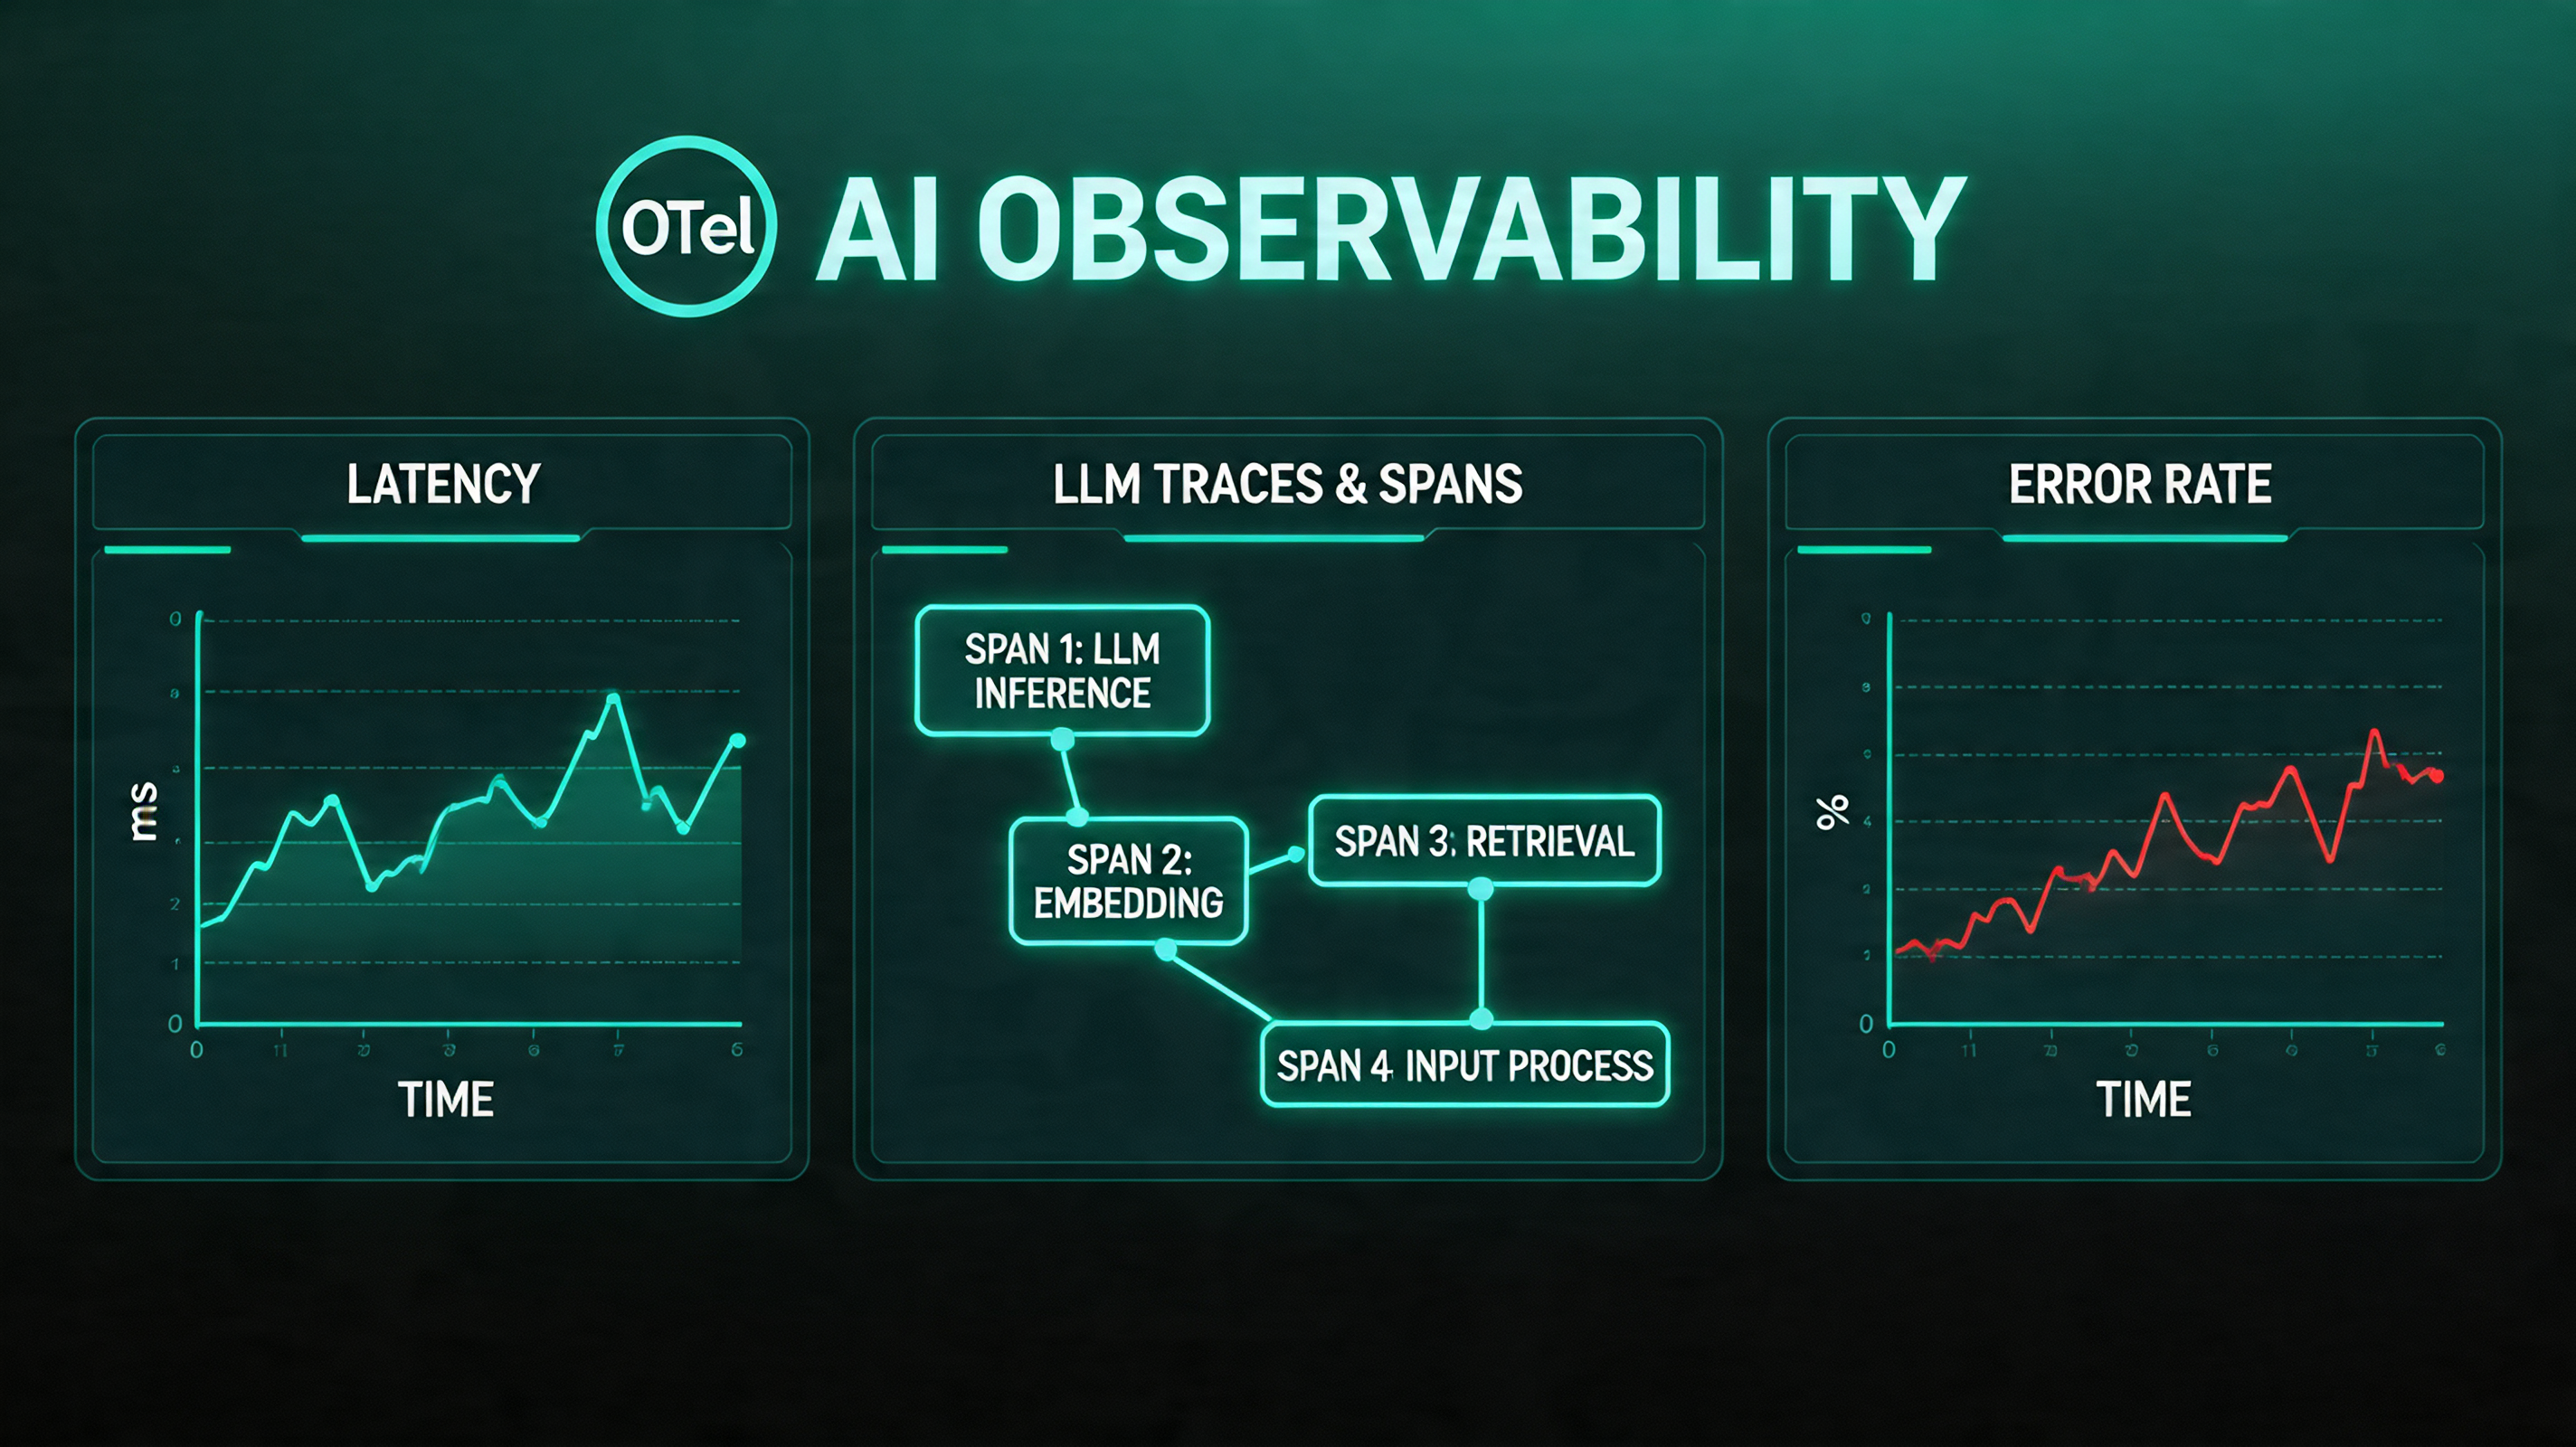
The Three Layers of AI Observability
Traditional observability is often described in terms of the "three pillars": metrics, logs, and traces. AI observability adds a fourth: evaluations. Each layer answers different questions.
Metrics answer: is my system healthy right now? Are latency, cost, and error rates within normal ranges?
Logs answer: what happened during this specific interaction? What did the model receive, what did it produce, and what were the intermediate steps?
Traces answer: how did this request flow through my system? Which components were invoked, in what order, and how long did each take?
Evaluations answer: is my system producing good outputs? This is the layer that traditional observability doesn't address — and it's the most important layer for AI applications.
OpenTelemetry for LLM Applications
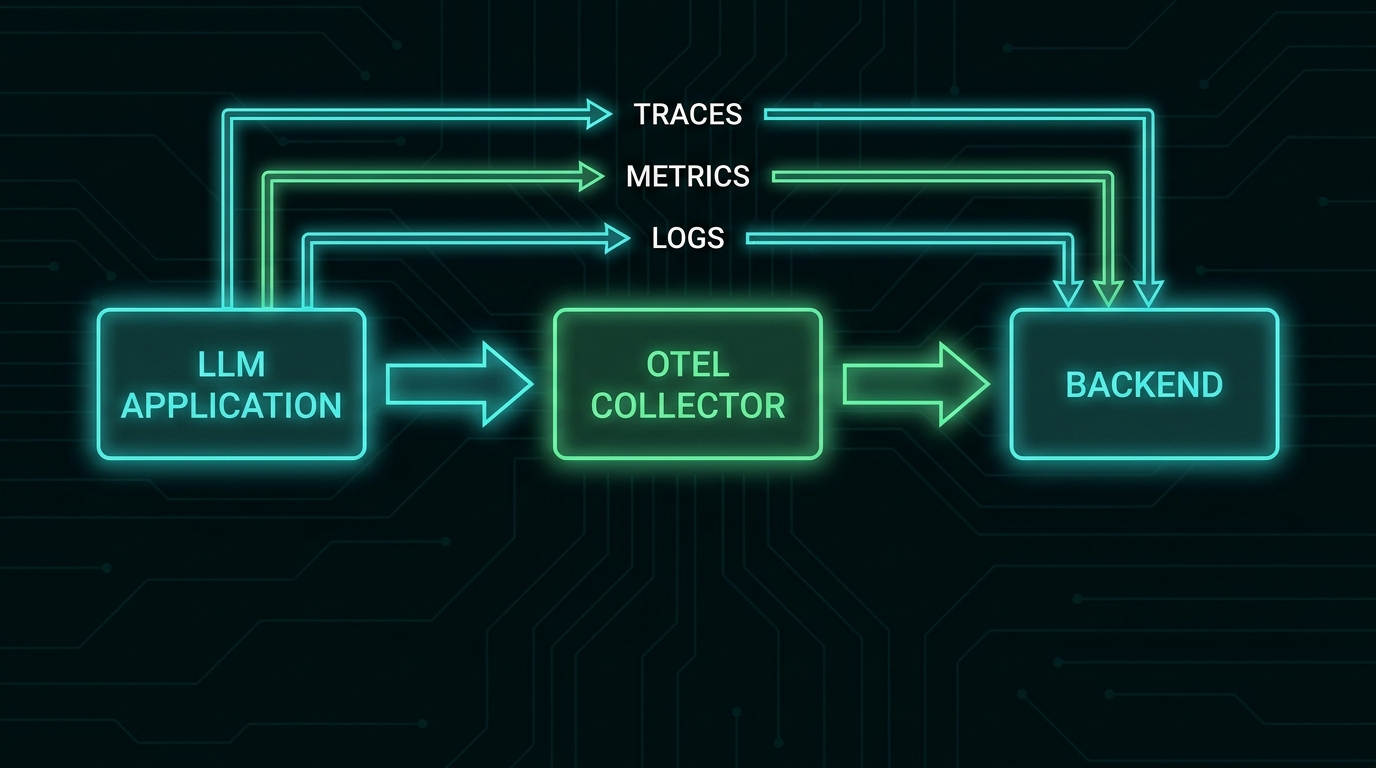
OpenTelemetry (OTel) is the emerging standard for distributed tracing and observability in cloud-native applications. The CNCF's OpenTelemetry Semantic Conventions for GenAI define how LLM calls should be traced — standardizing attribute names like gen_ai.request.model, gen_ai.usage.input_tokens, gen_ai.usage.output_tokens, and gen_ai.response.finish_reasons.
This standardization means that telemetry from Claude, GPT-4o, Llama, and your custom model infrastructure can be ingested by the same observability backend with the same attribute schema.
Instrumenting Your Application
from opentelemetry import trace
from opentelemetry.sdk.trace import TracerProvider
from opentelemetry.sdk.trace.export import BatchSpanProcessor
from opentelemetry.exporter.otlp.proto.grpc.trace_exporter import OTLPSpanExporter
from opentelemetry.trace import SpanKind
import anthropic
import time

# Initialize OTel tracer
provider = TracerProvider()
exporter = OTLPSpanExporter(endpoint="http://otel-collector:4317")
provider.add_span_processor(BatchSpanProcessor(exporter))
trace.set_tracer_provider(provider)

tracer = trace.get_tracer(__name__)
client = anthropic.Anthropic()

def traced_llm_call(
    messages: list[dict],
    system: str,
    model: str = "claude-haiku-4-5-20251001",
    operation_name: str = "llm.chat"
) -> str:
    """Wrapper that adds OTel tracing to Anthropic API calls."""

    with tracer.start_as_current_span(
        operation_name,
        kind=SpanKind.CLIENT,
    ) as span:
        # Set standard GenAI attributes
        span.set_attribute("gen_ai.system", "anthropic")
        span.set_attribute("gen_ai.request.model", model)
        span.set_attribute("gen_ai.request.max_tokens", 1024)
        span.set_attribute("gen_ai.request.temperature", 0.7)

        # Log the input (be careful with PII)
        span.set_attribute("gen_ai.prompt.0.role", "system")
        span.set_attribute("gen_ai.prompt.0.content", system[:500])  # Truncate for safety

        start_time = time.time()

        try:
            response = client.messages.create(
                model=model,
                max_tokens=1024,
                system=system,
                messages=messages,
            )

            duration_ms = (time.time() - start_time) * 1000

            # Record usage metrics
            span.set_attribute("gen_ai.usage.input_tokens", response.usage.input_tokens)
            span.set_attribute("gen_ai.usage.output_tokens", response.usage.output_tokens)
            span.set_attribute("gen_ai.response.finish_reasons", [response.stop_reason])
            span.set_attribute("llm.latency_ms", duration_ms)

            # Calculate cost (claude-haiku-4-5 pricing)
            input_cost = response.usage.input_tokens * 0.00000080
            output_cost = response.usage.output_tokens * 0.000004
            span.set_attribute("llm.cost_usd", input_cost + output_cost)

            output_text = response.content[0].text
            span.set_attribute("gen_ai.completion.0.role", "assistant")
            span.set_attribute("gen_ai.completion.0.content", output_text[:500])

            return output_text

        except Exception as e:
            span.record_exception(e)
            span.set_status(trace.StatusCode.ERROR, str(e))
            raise
Tracing RAG Pipelines
For retrieval-augmented generation, the trace should capture each component of the pipeline:
def traced_rag_query(user_query: str) -> str:
    """RAG pipeline with full observability across retrieval and generation."""

    with tracer.start_as_current_span("rag.query") as root_span:
        root_span.set_attribute("rag.query", user_query)

        # Trace retrieval
        with tracer.start_as_current_span("rag.retrieval") as retrieval_span:
            retrieved_chunks = vector_db.search(user_query, top_k=5)

            retrieval_span.set_attribute("rag.chunks_retrieved", len(retrieved_chunks))
            retrieval_span.set_attribute("rag.top_score", retrieved_chunks[0]["score"] if retrieved_chunks else 0)
            retrieval_span.set_attribute("rag.avg_score",
                sum(c["score"] for c in retrieved_chunks) / max(len(retrieved_chunks), 1))

        # Trace reranking
        with tracer.start_as_current_span("rag.reranking") as rerank_span:
            reranked = reranker.rerank(user_query, retrieved_chunks)
            context = "\n\n".join([c["content"] for c in reranked[:3]])
            rerank_span.set_attribute("rag.chunks_after_rerank", 3)
            rerank_span.set_attribute("rag.context_tokens", len(context.split()) * 1.3)

        # Trace generation
        prompt = f"Answer based on context:\n\n{context}\n\nQuestion: {user_query}"
        response = traced_llm_call(
            messages=[{"role": "user", "content": prompt}],
            system="You are a helpful assistant. Answer only from the provided context.",
            operation_name="rag.generation"
        )

        root_span.set_attribute("rag.response_length", len(response))
        return response
The Metrics That Actually Matter
Operational Metrics (Standard)
Track these with any metrics system (Prometheus, Datadog, CloudWatch):
- TTFT (time to first token) — P50, P95, P99 by model and operation type
- Total latency — P50, P95, P99
- Token usage — input tokens, output tokens, per operation type
- Cost — per request, per operation type, per day, with budget alerts
- Error rate — API errors, timeouts, content policy rejections
- Throughput — requests per second
Quality Metrics (AI-Specific)
These require more thought. Standard application metrics don't capture quality.
Retrieval relevance: for RAG systems, track the average relevance score of retrieved chunks. A sudden drop (chunks scoring <0.5 when historical average is 0.75) indicates a problem with embeddings, data freshness, or query processing.
Response length distribution: sudden changes in average response length often indicate prompt drift or model behavior changes. If your chatbot's responses drop from 150 words average to 30 words average after a deployment, something changed.
User feedback signals: thumbs up/down, explicit ratings, session abandonment, follow-up correction queries ("no, I meant...", "that's wrong", "try again"). These are noisy but valuable signals about quality.
LLM-as-judge scores: use an evaluator model to score the quality of production responses on dimensions you care about — helpfulness, accuracy, tone, conciseness. Run this on a sample of traffic (100% is expensive; 5-10% is usually sufficient).
Evaluation Pipelines
The most important observability investment for AI applications is a systematic evaluation pipeline: a set of test cases that you run against your system to measure quality, detect regressions before they reach users, and quantify the impact of changes.
Offline Evaluation
Run before deployment, on a held-out test set:
from dataclasses import dataclass
from typing import Callable

@dataclass
class EvalCase:
    id: str
    input: str
    expected: str  # For exact-match or reference-based evals
    metadata: dict  # Category, difficulty, etc.

class EvaluationPipeline:
    def __init__(self, evaluators: list[Callable]):
        self.evaluators = evaluators

    def run(self, cases: list[EvalCase], system_fn: Callable) -> dict:
        results = []

        for case in cases:
            response = system_fn(case.input)
            scores = {}

            for evaluator in self.evaluators:
                scores[evaluator.__name__] = evaluator(
                    input=case.input,
                    response=response,
                    expected=case.expected,
                )

            results.append({
                "id": case.id,
                "input": case.input,
                "response": response,
                "expected": case.expected,
                "scores": scores,
                "metadata": case.metadata,
            })

        # Aggregate metrics
        aggregated = {
            evaluator.__name__: sum(r["scores"][evaluator.__name__] for r in results) / len(results)
            for evaluator in self.evaluators
        }

        return {"cases": results, "aggregate": aggregated}

def llm_judge_helpfulness(input: str, response: str, **kwargs) -> float:
    """Use Claude as a judge for response helpfulness (0.0 - 1.0)."""
    judge_prompt = f"""Rate the helpfulness of this response on a scale of 0.0 to 1.0.

User question: {input}
Response: {response}

Output only a number between 0.0 and 1.0."""

    score_text = evaluator_client.messages.create(
        model="claude-haiku-4-5-20251001",
        max_tokens=10,
        messages=[{"role": "user", "content": judge_prompt}],
    ).content[0].text.strip()

    try:
        return float(score_text)
    except ValueError:
        return 0.5  # Default if parsing fails
Regression Testing in CI
Integrate your evaluation pipeline into CI so every pull request is scored against your eval suite:
# .github/workflows/eval.yml
name: LLM Evaluation

on:
  pull_request:
    paths: ['prompts/**', 'src/ai/**', 'config/**']

jobs:
  evaluate:
    runs-on: ubuntu-latest
    steps:
      - uses: actions/checkout@v4

      - name: Run evaluation suite
        run: python eval/run_evals.py --output eval_results.json
        env:
          ANTHROPIC_API_KEY: ${{ secrets.ANTHROPIC_API_KEY }}

      - name: Compare to baseline
        run: |
          python eval/compare_baseline.py \
            --current eval_results.json \
            --baseline eval/baseline_results.json \
            --threshold 0.02  # Fail if any metric drops >2 percentage points

      - name: Post results to PR
        uses: actions/github-script@v7
        with:
          script: |
            const results = require('./eval_results.json');
            const comment = formatEvalResults(results);
            github.rest.issues.createComment({
              issue_number: context.issue.number,
              owner: context.repo.owner,
              repo: context.repo.repo,
              body: comment
            });
Online Evaluation with Traffic Sampling
For production traffic monitoring, sample a percentage of live requests and run evaluations asynchronously:
import random
from background_worker import async_task

def handle_user_query(user_query: str, session_id: str) -> str:
    response = rag_pipeline.run(user_query)

    # Sample 10% of traffic for quality evaluation
    if random.random() < 0.10:
        evaluate_response_async.delay(
            session_id=session_id,
            query=user_query,
            response=response,
        )

    return response

@async_task
def evaluate_response_async(session_id: str, query: str, response: str):
    """Run in background worker — doesn't block user response."""
    scores = {
        "helpfulness": llm_judge_helpfulness(query, response),
        "groundedness": llm_judge_groundedness(query, response),
        "conciseness": llm_judge_conciseness(response),
    }

    # Store in metrics database
    metrics_db.insert({
        "session_id": session_id,
        "timestamp": datetime.utcnow(),
        "scores": scores,
    })

    # Alert if quality drops below threshold
    if scores["helpfulness"] < 0.5:
        alert_team(f"Low helpfulness score: {scores['helpfulness']:.2f} for session {session_id}")
The Debugging Workflow
When quality issues appear in production, the investigation workflow is:
-
Segment by attribute: is the quality drop uniform, or concentrated in specific categories? Filter your traces by query type, user segment, model version, prompt version. Narrow the scope.
-
Find the inflection point: when did quality start dropping? Correlate with deployments, configuration changes, and data updates. Build your telemetry to make this query possible.
-
Replay with logging: take the problematic traces and replay them with full debug logging — complete prompts, all context, every intermediate step. Compare the input/output pairs between a period that worked and a period that didn't.
-
Isolate the component: in a RAG pipeline, is the retrieval component returning different results, or is the generation given the same context different? In an agent, is the reasoning loop behaving differently, or are the tools returning different results? Isolate to component level.
-
Quantify with your eval suite: once you have a hypothesis, create a few targeted eval cases that should fail given your hypothesis. Run them against the eval pipeline. If your hypothesis is right, you'll see it in the scores.
Production Tooling Landscape
The AI observability tooling space has matured significantly in 2026:
| Tool | Best For |
|---|---|
| LangSmith (LangChain) | Teams using LangChain/LangGraph; good trace visualization |
| Langfuse | Open-source, self-hostable; strong for teams with data privacy requirements |
| Arize Phoenix | Strong on eval pipelines and automated quality scoring |
| Braintrust | Developer-focused eval platform; good CI/CD integration |
| Honeycomb + OTel | Teams already using Honeycomb; excellent query flexibility for trace analysis |
| Custom OTel + Grafana | Maximum flexibility; higher operational cost |
For most teams starting out: Langfuse (self-hosted or cloud) provides the best balance of observability depth and operational simplicity. It integrates with OpenTelemetry, supports custom evaluation metrics, and has strong trace visualization for multi-step agent workflows.
Conclusion
Production AI applications fail differently from traditional applications. The failures are often subtle, often gradual, and often invisible to standard monitoring until users have been experiencing them for days.
Investing in AI observability before you need it is the right call. Traces, logs, and operational metrics take hours to add. Building a meaningful eval suite takes days. But once they're in place, the time from "something is wrong" to "here's exactly what changed and why" drops from weeks to hours.
The teams that win with AI applications in production are the ones who treat quality as a measurable, monitorable signal — not as a feeling they get from reading user feedback.
Sources & References
- OpenTelemetry Semantic Conventions for GenAI
- Langfuse — "LLM Observability"
- Anthropic — "Evaluating AI Systems"
- Hamel Husain — "Your AI Product Needs Evals"
- Arize AI — "LLM Evaluation Guide"
- OpenAI — "A practical guide to building LLM evals"
About the Author
Toc Am
Founder of AmtocSoft. Writing practical deep-dives on AI engineering, cloud architecture, and developer tooling. Previously built backend systems at scale. Reviews every post published under this byline.
Published: 2026-05-02 · Written with AI assistance, reviewed by Toc Am.
Get These In Your Inbox
Weekly deep-dives on AI engineering, no fluff. Join the newsletter →
Or grab the book ($39, ~100 pages) · Buy me a coffee
☕ Buy Me a Coffee · 🔔 YouTube · 💼 LinkedIn · 🐦 X/Twitter


No comments:
Post a Comment