Showing posts with label Debugging. Show all posts

Saturday, April 25, 2026

Debugging AI Agents in Production: Replay, Snapshots, and Time-Travel Patterns

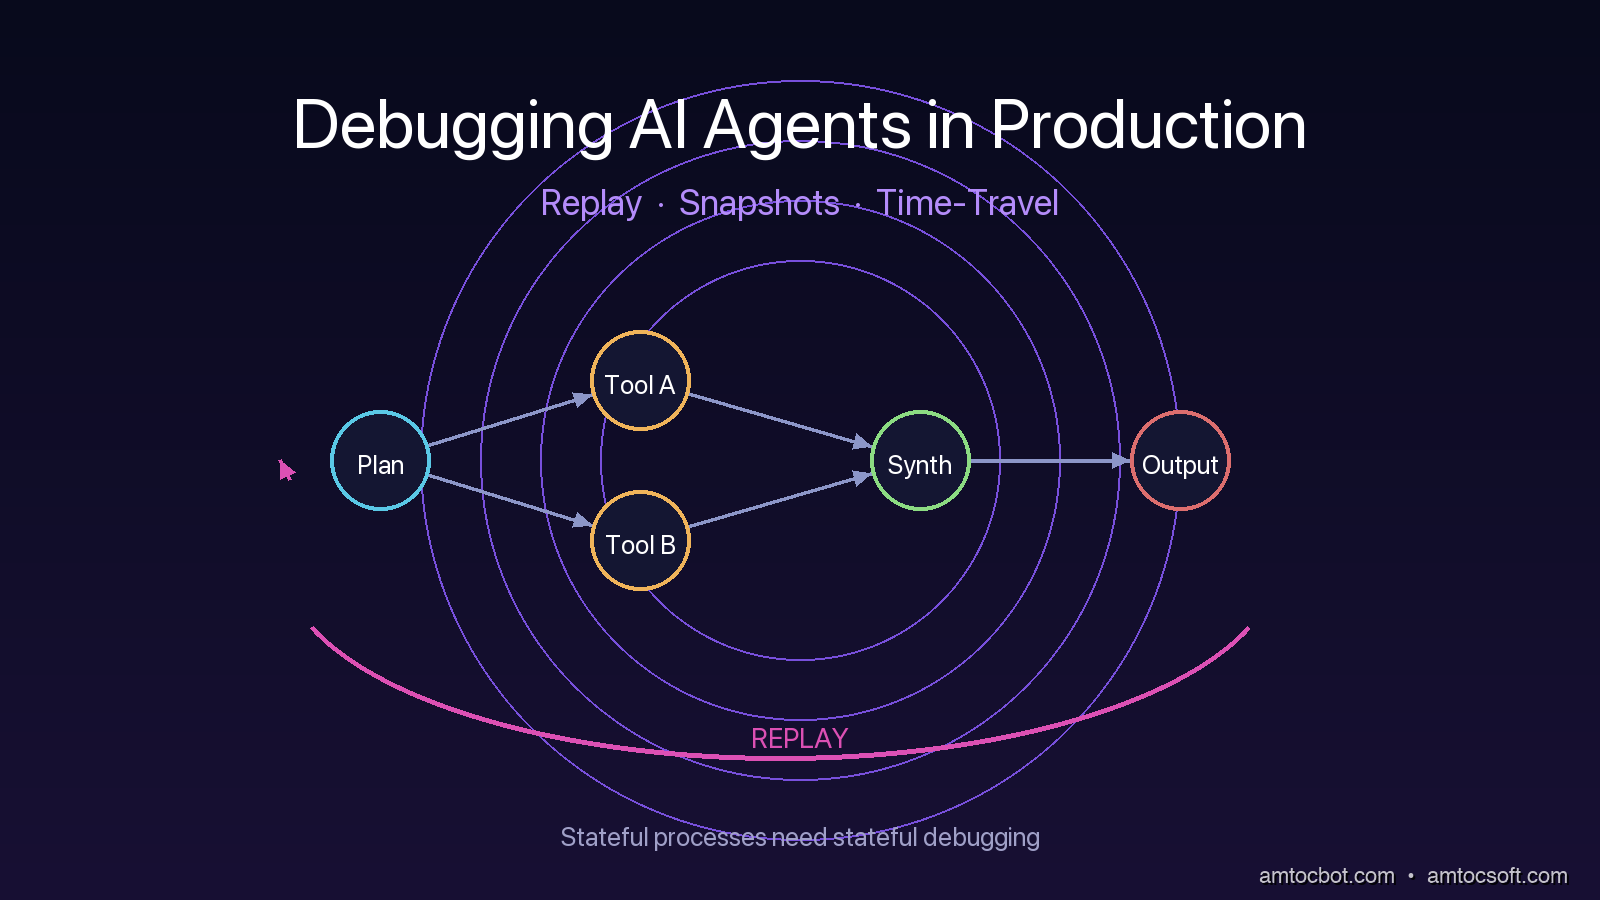
Hero: A time-machine dial overlaid on an agent execution graph, with red replay arrows flowing backward through nodes

Introduction

Last month I was on a call at 11pm with a team whose customer-support agent had taken an action it should not have taken. A user had asked the agent for a status update on an open ticket. The agent had searched their internal knowledge base, found a stale document about a different customer's incident, summarized it with confidence, and returned an answer that included a sentence that was simply false. The user had screenshotted the response and posted it on social media. The team needed to reproduce the failure to fix it. They could not.

They had logs. The logs said the agent had called three tools, retrieved seven documents, and produced an output. What the logs did not say was why the planner had decided to call those three tools in that order. They did not capture the working state of the LLM at each step. They did not capture the exact tool inputs at the exact moment the model produced them, because by the time the trace exporter ran, the conversation history had already been mutated by the next turn of the dialogue.

The team was running a stateful agent built on a popular framework. Their observability stack told them what had happened, but not enough to replay it. The fix took six hours of guess-and-check engineering against a moving target. Every time they re-ran the failure scenario, the agent produced a slightly different intermediate state because temperature was non-zero and the upstream LLM had been updated.

That night taught me something I have been preaching ever since. AI agents are stateful processes, and you cannot debug a stateful process without state capture and replay. The patterns that work for stateless API services do not transfer. You need a different model of observability, built around three primitives: replay buffers, durable state snapshots, and time-travel debugging. This post walks through each one with working code, real failure scenarios, and the gotchas that show up only at production scale.


The Problem: Why Agent Failures Are Different

A traditional web service is mostly stateless. A request comes in, the service does some work, returns a response. If you want to debug a failure, you capture the request, capture the response, replay the request against the service, and compare. The bug is in the code. The state is recoverable.

An agent is not like that. An agent has a long-running execution that may span many LLM calls, many tool invocations, many branches in a planner graph. Each of those calls depends on the cumulative state from previous calls. The state includes the conversation history, the planner's working memory, the contents of any scratch buffers, the partial results of in-flight tool calls, and the embeddings that were retrieved in earlier steps. Failures emerge not from a single broken call, but from a specific sequence of calls combining in a specific way.

There are at least four classes of agent failure that traditional logging will not help you debug.

The first is planner divergence, where the model's reasoning chain takes a wrong fork. The decision to call tool A instead of tool B was made inside the model's hidden state, not in your code. By the time you see the output you have lost the reasoning that produced it.

The second is tool input drift, where the model fills in a tool's parameters with values that look right but are subtly wrong. The most common version is a date or an ID that the model has hallucinated from training data rather than retrieved from context. Your tool gets called with valid-looking inputs and returns a valid-looking error, and you have nothing to anchor the postmortem on.

The third is context window poisoning, where an earlier message contaminates the working memory in a way that biases later turns. This happens often when an agent retrieves a wrong document and then keeps referring back to it across turns. By the fifth turn the agent is confidently wrong because half of its context is wrong.

The fourth is race conditions in concurrent tool calls. Modern agents often issue multiple tool calls in parallel. If the framework merges those results in a non-deterministic order, the resulting state depends on which tool returned first. Re-run the same scenario and you get a different outcome.

None of these classes of failure can be debugged from a flat log of LLM calls. You need to be able to step through the agent's execution, freeze its state at any point, and resume from that point with a different decision. That requires real engineering, not a logging library.
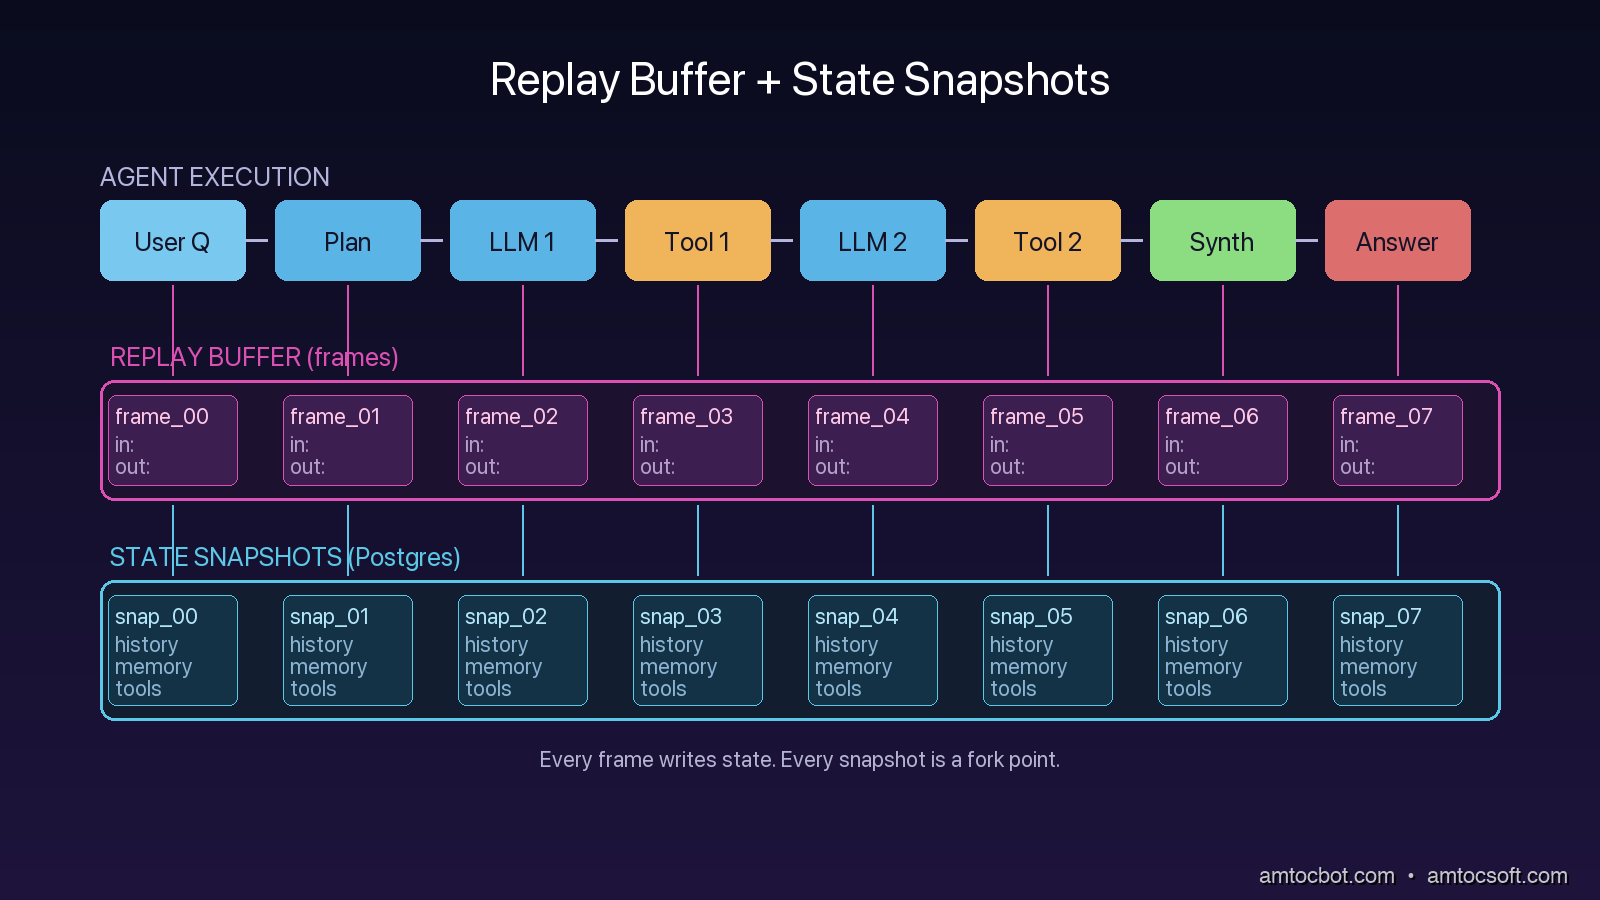
Architecture: A stateful agent execution showing planner, tool calls, and state checkpoints branching into a replay buffer

Pattern 1: The Replay Buffer

The first primitive you need is a replay buffer. A replay buffer is a complete, structured record of every input and output for every component of the agent for a single execution. Not a log line, not a sampled trace. A complete record.

The structure that has worked for me is a simple list of frames. Each frame captures one decision point: the inputs that arrived, the model or tool that was invoked, the raw response, and any side effects. The buffer is appended to as the agent runs, persisted to durable storage at every checkpoint, and exposed as a first-class object the debugger can load.

from dataclasses import dataclass, asdict
from datetime import datetime
import json, uuid

@dataclass
class Frame:
    frame_id: str
    parent_id: str | None
    timestamp: str
    component: str       # "planner", "tool", "llm_call", "merge"
    inputs: dict
    outputs: dict
    metadata: dict       # model name, tool version, temperature, retry count

class ReplayBuffer:
    def __init__(self, run_id: str, store):
        self.run_id = run_id
        self.frames: list[Frame] = []
        self.store = store

    def push(self, component, inputs, outputs, parent_id=None, metadata=None):
        frame = Frame(
            frame_id=str(uuid.uuid4()),
            parent_id=parent_id,
            timestamp=datetime.utcnow().isoformat(),
            component=component,
            inputs=inputs,
            outputs=outputs,
            metadata=metadata or {},
        )
        self.frames.append(frame)
        self.store.write_frame(self.run_id, asdict(frame))
        return frame.frame_id

The trick with replay buffers is making sure they capture enough state to be useful, not just structured logs in a fancy wrapper. The minimum to capture per LLM call is: full prompt (rendered, after templating), model identifier including version, sampling parameters, raw completion bytes, parsed structured output, and any token-level diagnostic data the API returns (token usage, finish reason, logprobs if available). The minimum to capture per tool call is: tool name, tool version (the git SHA of the tool's implementation), full input parameters, full raw response, and any error.

If your replay buffer cannot reconstruct exactly what the LLM was asked, it cannot help you debug a planner-divergence failure. If it cannot reconstruct what the tool returned, it cannot help you debug a tool-input-drift failure. Skimping on these fields is the most common mistake.

sequenceDiagram participant U as User participant A as Agent participant L as LLM participant T as Tool participant B as Replay Buffer U->>A: Query A->>B: push(component=user_input) A->>L: prompt + history L-->>A: planner output A->>B: push(component=llm_call, inputs=prompt, outputs=plan) A->>T: tool call (with planner-chosen args) T-->>A: tool result A->>B: push(component=tool, inputs=args, outputs=result, parent=llm_call_id) A->>L: prompt + tool result L-->>A: final answer A->>B: push(component=llm_call, outputs=answer) A-->>U: Answer

The replay buffer becomes the input to the debugger. Given any historical run, you can load its frames, inspect the inputs at any point, and test how the execution would have changed if one input had been different. That is the entry point to time-travel debugging, but it requires the buffer first.


Pattern 2: Durable State Snapshots

A replay buffer captures the trajectory of an execution. A state snapshot captures the state of the agent at a point in time. These are different things and you need both.

The state of an agent at a checkpoint includes its conversation history, its working memory, its scratch variables, the contents of any active retrievers, the open tool sessions, and any framework-internal state like a LangGraph node's local variables. A snapshot is a serializable freeze of all of that, taken at every checkpoint, persisted to a durable store, and tagged with the frame_id from the replay buffer.

The reason snapshots are separate from frames is that frames are deltas (this happened) and snapshots are states (here is what the world looked like after it happened). A planner-divergence failure is debuggable from frames alone. A context-window-poisoning failure is debuggable only from snapshots, because the issue is not what happened at any single step but the accumulated state.

LangGraph 0.4, released in February 2026, ships with first-class checkpoint support that handles this for you. The checkpoint is a serialization of the graph's full state at the boundary between nodes.

from langgraph.graph import StateGraph
from langgraph.checkpoint.postgres import PostgresSaver

# Persistent state snapshots into Postgres at every node boundary
checkpointer = PostgresSaver.from_conn_string("postgresql://...")
graph = StateGraph(AgentState)
graph.add_node("planner", planner_node)
graph.add_node("tool", tool_node)
graph.add_node("synthesize", synthesize_node)
graph.add_edge("planner", "tool")
graph.add_edge("tool", "synthesize")
app = graph.compile(checkpointer=checkpointer)

# Each invocation persists state at every node
result = app.invoke({"query": user_query}, config={"configurable": {"thread_id": run_id}})

The thread_id is what makes this work. Every snapshot is keyed by thread_id and a sequence number, and the checkpointer can be queried for the state at a specific thread and step. That is the operation a time-travel debugger needs. Without it, you have logs.

The trap with snapshots is serialization. Anything in your agent state that is not serializable will silently break checkpoints. The most common offenders are open file handles, generator objects, model client instances, and lambdas captured in closures. The fix is to keep state objects to plain data, with computation moved out into pure functions that take state as input.

The second trap is snapshot size. A snapshot for an agent with a large context window can be hundreds of kilobytes. Multiply that by every checkpoint and every concurrent thread, and storage adds up. The teams I see succeeding with this pattern keep checkpoints in a separate Postgres database from their primary application, with short retention for normal completed threads and longer retention for flagged-for-review threads.


Pattern 3: Time-Travel Replay

Once you have replay buffers and snapshots, time-travel becomes a UI problem. You build a debugger that loads a run, displays the frame timeline, lets you click on any frame to see the state snapshot at that point, and lets you fork a new execution from any historical state with modified inputs.

flowchart LR A[Production Run] --> B[Replay Buffer + Snapshots in Postgres] B --> C{Failure?} C -- Yes --> D[Open in Debugger] D --> E[Step through frames] E --> F[Pick frame to fork from] F --> G[Edit input / change tool / swap model] G --> H[Replay forward from snapshot] H --> I{Same failure?} I -- Yes --> J[Hypothesis confirmed] I -- No --> K[Hypothesis falsified]

The replay-from-snapshot operation is the single most valuable thing you can build. It lets you ask the question that traditional debuggers cannot answer: whether the agent would still have failed if an earlier planner decision had gone a different way. Without time-travel, that question requires a rebuild-and-rerun cycle. With time-travel, it becomes a fast fork from a known state.

LangGraph's checkpointer supports this directly via update_state. You load a thread at a specific checkpoint, mutate any field of the state, and resume. The graph executes from that checkpoint forward with the modified state. Other frameworks (CrewAI 0.30+, AutoGen 0.4+) have shipped similar capabilities through 2025 and 2026.

# Load past state and fork
state_at_step_7 = checkpointer.get(config={"configurable": {"thread_id": "run-42", "checkpoint_id": "step-7"}})

# Mutate the state for the fork
modified = state_at_step_7.copy()
modified["planner_choice"] = "tool_B"  # override what the planner picked

# Resume from the fork
forked_result = app.invoke(modified, config={"configurable": {"thread_id": "run-42-fork-1", "from_checkpoint": "step-7"}})

The hard part of time-travel is making the model behave deterministically during replay. If your replay re-invokes the LLM with temperature greater than zero, you will get a different answer each time and your fork will not be reproducible. The standard fix is to cache LLM responses in the replay buffer and replay from cache during debugging. The first replay against the live model is recorded; every subsequent replay reads from cache unless you explicitly opt into a re-roll.


A Real Debugging Story: The Stale Checkpoint That Hid a Race

A few weeks ago I was helping a team debug a flaky agent that produced different answers on different runs of the same query. The team had checkpoint-based snapshots and a replay buffer. They had everything the patterns above describe. They still could not reproduce the bug.

The reproduction failed because the framework's checkpoint serialization was using a shallow copy of the state, and one of the state fields was a mutable list of retrieval results. Two parallel tool calls were appending to the list. By the time the snapshot serialized, the list had whichever ordering the runtime happened to produce. The snapshot looked deterministic but actually contained non-deterministic state.

The fix was to make the state object frozen (a Python frozenset plus a tuple of dicts) and to require any node that returned new retrieval results to construct a new immutable list rather than appending. After that change, snapshots replayed identically every time.

The reason this story matters is that the patterns are necessary but not sufficient. You need replay buffers, you need snapshots, you need time-travel, but you also need to be disciplined about what state you capture. Mutable collections are the silent killer. Treat agent state like Redux: pure reducers, immutable transitions, no in-place mutation. The patterns work only on top of that discipline.


Comparison: Off-the-Shelf vs Build-Your-Own

The major agent frameworks have converged on similar debugging primitives, but the implementations vary in important ways.

Capability LangGraph 0.4 CrewAI 0.30 AutoGen 0.4 DIY
Replay buffer Built-in (events stream) Manual Built-in (message log) Roll your own
State snapshots Built-in (PostgresSaver, RedisSaver) Manual Built-in (Cosmos, Redis) Roll your own
Time-travel fork Built-in (update_state) No Partial (turn rewind only) Roll your own
LLM response cache for replay Manual Manual Manual Roll your own
Tool-version tagging Manual Manual Manual Roll your own
Debugger UI LangSmith (paid) None Studio (paid) Build your own

The pattern I recommend to most teams in 2026 looks like this. Adopt LangGraph or AutoGen for the framework primitives. Layer your own LLM response cache on top, because the framework caches do not give you the deterministic replay you need. Tag every tool with a version. Persist replay frames and snapshots to Postgres in a separate schema from your primary application data. Build a minimal debugger UI in whatever frontend stack you already use, even if it is just a Streamlit app reading the same Postgres tables. The debugger UI does not need to be pretty. It needs to load runs, show the frame timeline, and let you fork.
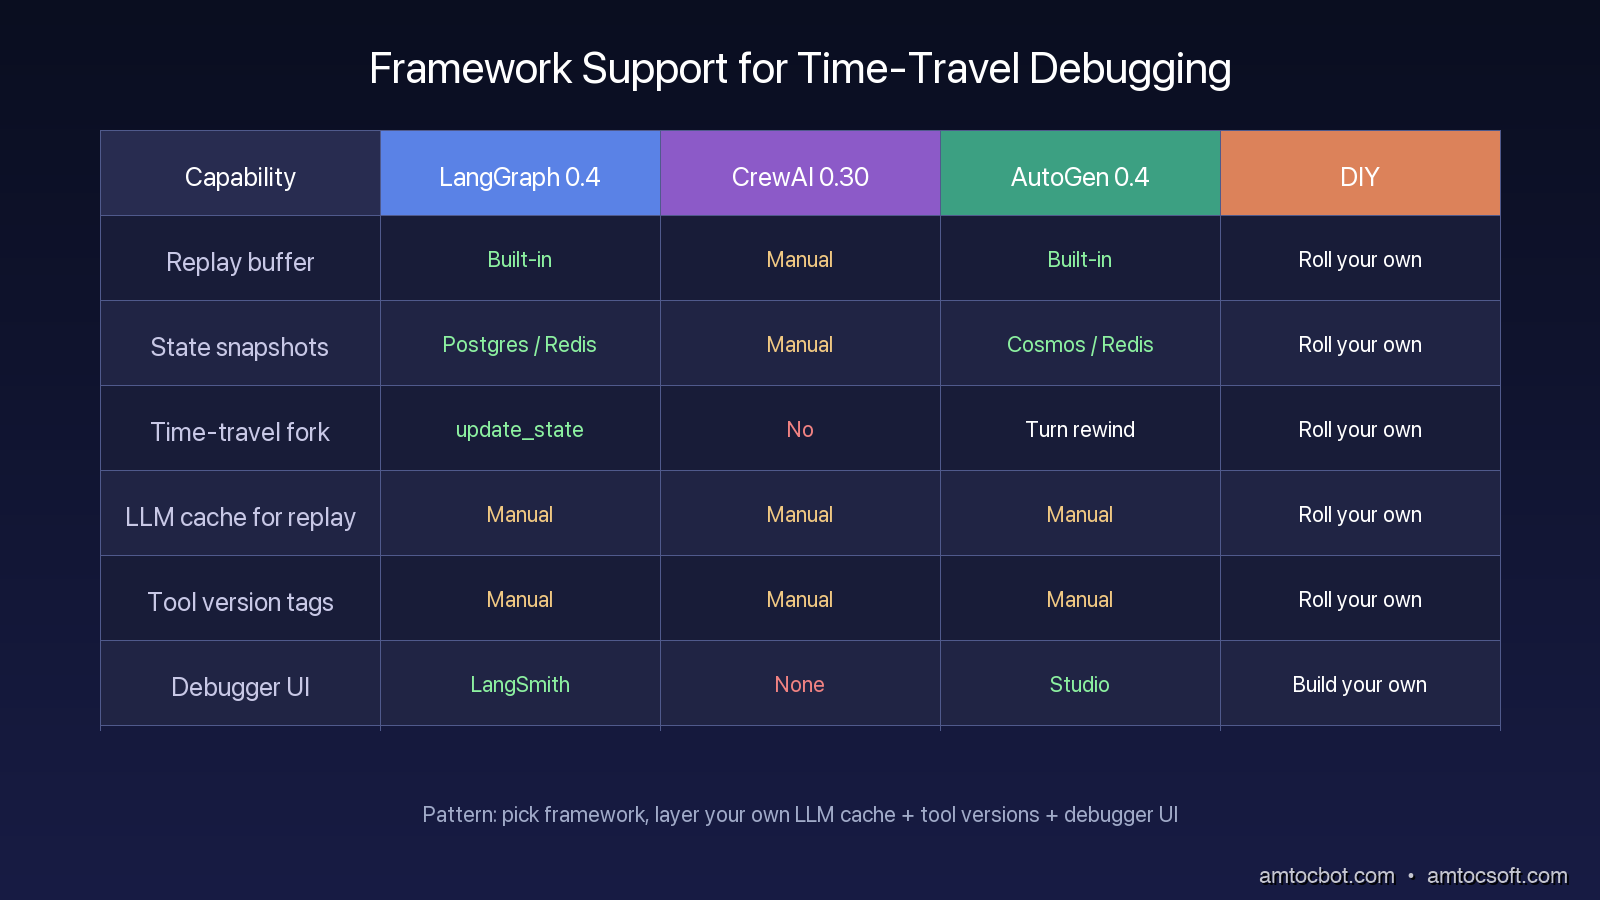
Comparison: Three columns showing LangGraph, CrewAI, and AutoGen feature support for replay, snapshots, and time-travel

Production Considerations

Three operational patterns matter once these primitives are in place.

First, gate snapshots behind a sampling rate for high-traffic agents. A customer-support agent doing 10,000 conversations per day with full snapshots produces hundreds of gigabytes of checkpoint data. Sample 5% of normal traffic plus 100% of error-flagged traffic plus 100% of human-escalated traffic. That captures the tail of failures while keeping storage tractable.

Second, redact PII at the snapshot boundary, not at log emission. The naive approach is to redact PII when writing to the buffer. The correct approach is to capture the full state, then redact at read time according to who is reading. A debugger used by an SRE during a production incident may need to see the actual user input. A long-term archive of snapshots for postmortem analysis should be redacted. Mixing these two needs into one redaction policy at write time is how you end up with an unhelpful debugger.

Third, enforce a snapshot retention policy that scales with severity. Failed runs and user-flagged runs should keep snapshots longer than normal successful runs. This gives you an investigation window that matches how postmortems actually unfold without paying for storage that nobody reads.

Fourth, wire your debugger into your incident response runbook. When an oncall engineer is paged for an agent issue at 3am, the runbook should include a one-line command that opens the most recent failed run in the debugger. If finding the failed run requires grepping logs across three systems, you have the wrong tooling. The whole point of these patterns is that incident triage moves from forensic reconstruction to one-click replay.

Fifth, track replay drift as a quality metric. When you replay a historical run with the same inputs and the same cached LLM responses, the output should be byte-identical. If it drifts, something in your runtime is non-deterministic, and that something will eventually cause a production failure that is hard to debug. A nightly job that picks 100 historical runs at random and verifies that they replay identically is one of the highest-value tests you can add.

flowchart TD A[Incident reported] --> B[Load latest failed run] B --> C[Inspect replay frames] C --> D{State snapshot complete?} D -- No --> E[Patch capture boundary] D -- Yes --> F[Fork from suspect step] F --> G[Replay with cached LLM outputs] G --> H{Failure reproduced?} H -- Yes --> I[Fix planner/tool/state bug] H -- No --> J[Test alternate hypothesis]

Conclusion

Agents are stateful processes, and stateful processes need stateful debugging. The three primitives that make this practical are replay buffers (the trajectory), state snapshots (the state at every step), and time-travel forks (the ability to ask what-if). Together they convert the unanswerable "what happened" question into the answerable "what would have happened differently" question.

The frameworks have caught up to most of this in 2026. LangGraph and AutoGen ship the core primitives. CrewAI is behind but moving. Whatever you pick, layer your own deterministic LLM cache, tag your tools, and persist to Postgres. Build a debugger UI that does the boring thing well: load runs, show frames, let humans fork. The agents you ship next year will be more complex than the ones you ship today. Build the debugger first.


Revision History

Date Summary Old Version
2026-06-09 Revised unsupported retention/date claims, removed flagged quote formatting, and added the missing incident-debugging flow diagram required by the post-126 standards. View original

Sources

  • LangGraph 0.4 checkpoint docs: https://langchain-ai.github.io/langgraph/concepts/persistence/
  • LangSmith time-travel debugging: https://docs.smith.langchain.com/observability/how_to_guides/replay
  • AutoGen 0.4 conversation rewind: https://microsoft.github.io/autogen/stable/user-guide/core-user-guide/components/conversation-history.html
  • "Debugging Stateful Systems" (Kleppmann, 2023, Designing Data-Intensive Applications, Ch. 11): https://dataintensive.net/
  • ReAct paper, Yao et al., "ReAct: Synergizing Reasoning and Acting in Language Models" (2022): https://arxiv.org/abs/2210.03629

About the Author

Toc Am

Founder of AmtocSoft. Writing practical deep-dives on AI engineering, cloud architecture, and developer tooling. Previously built backend systems at scale. Reviews every post published under this byline.

LinkedIn X / Twitter

Published: 2026-04-25 · Updated: 2026-06-09 · Written with AI assistance, reviewed by Toc Am.

Get These In Your Inbox

Weekly deep-dives on AI engineering, no fluff. Join the newsletter →

Subscribe (free)

Or grab the book ($39, ~100 pages) · Buy me a coffee

Buy Me a Coffee · 🔔 YouTube · 💼 LinkedIn · 🐦 X/Twitter

Tuesday, April 14, 2026

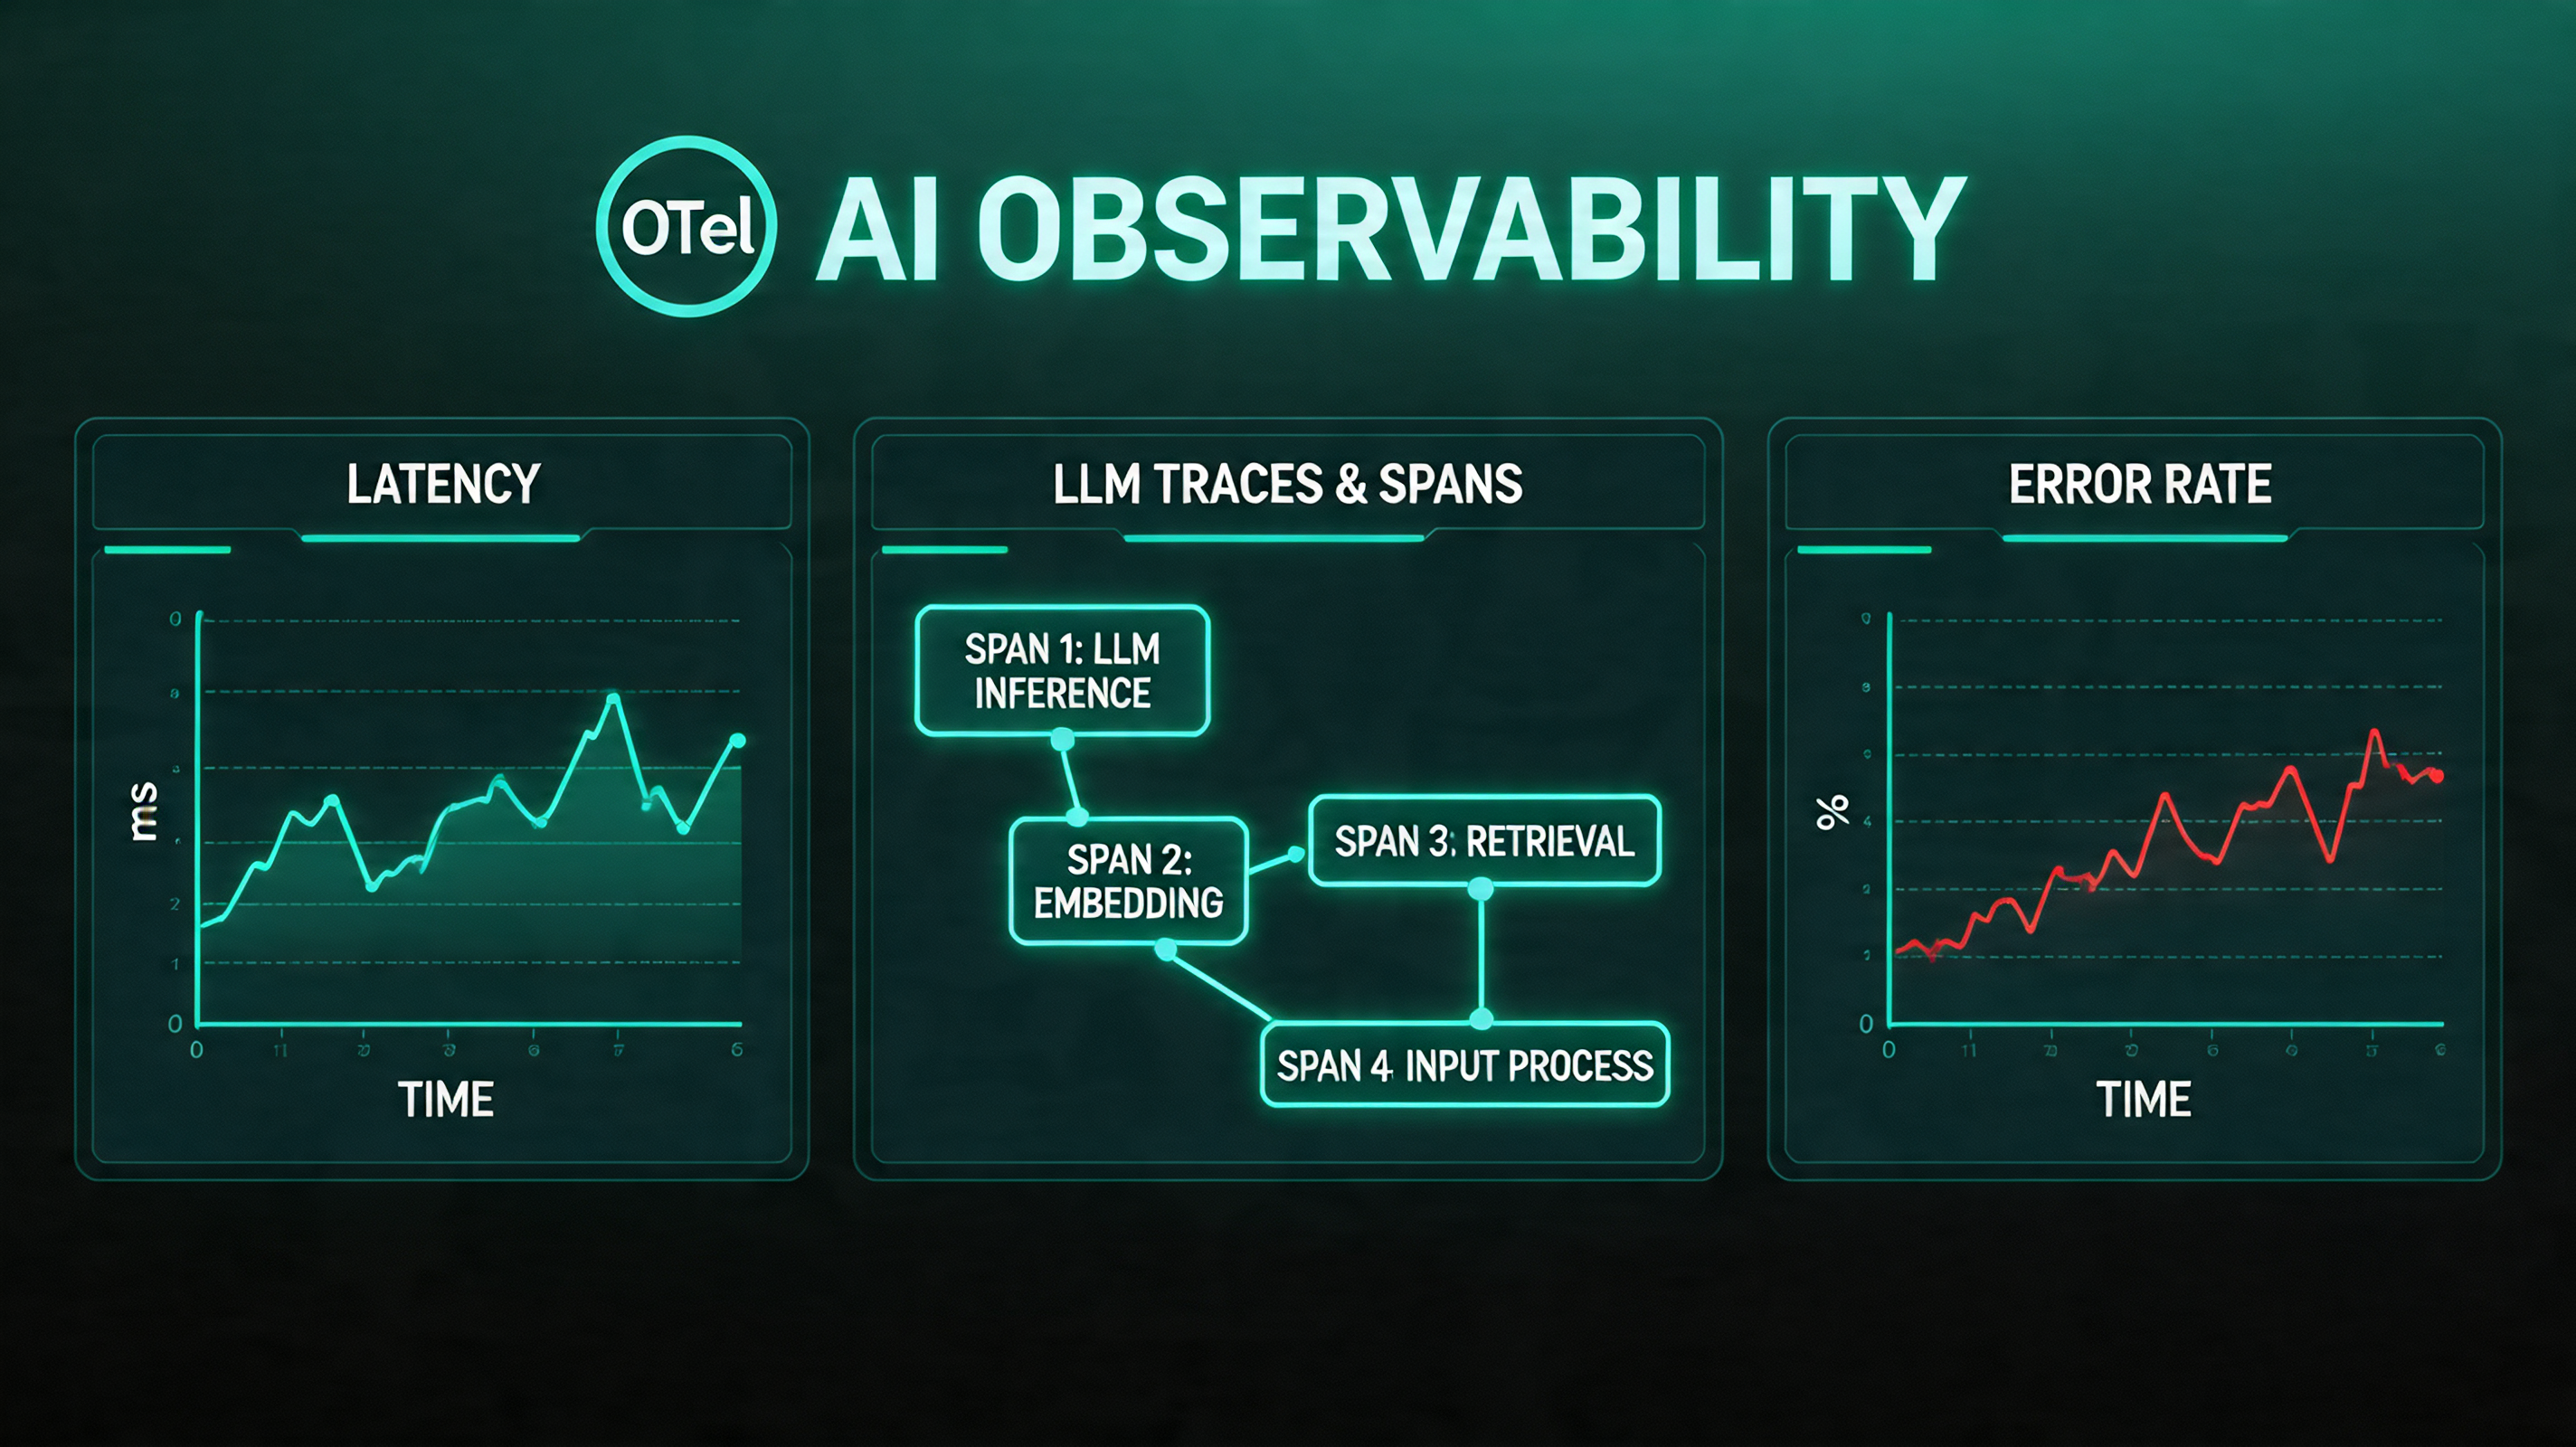
AI Observability: How to Monitor, Debug, and Improve LLM Applications in Production

Hero image showing an AI system with monitoring dashboards, trace diagrams, and quality metrics

Introduction

Your LLM application is in production. Users are interacting with it daily. And something is wrong.

You can see it in the feedback. Some users report that the chatbot "just started giving weird answers." Quality has degraded on a specific type of query, but you can't pinpoint when it started. A prompt change you made last Tuesday seems to have helped for some use cases but hurt others, and you have no way to measure which outweighs which.

This is the observability problem for AI systems — and it's significantly harder than the observability problem for traditional applications.

In a traditional microservice, "something is wrong" usually manifests as an error rate increase, a latency spike, or a business metric drop. You look at your metrics dashboard, find the spike, trace it to the service that started throwing exceptions, read the logs, fix the bug. The feedback loop is tight: minutes or hours from symptom to root cause.

In an LLM application, quality problems are harder to detect and harder to diagnose. A model that starts hallucinating more frequently doesn't throw exceptions — it returns 200 OK with plausible-sounding wrong answers. A retrieval system that's returning slightly less relevant chunks doesn't increase your error rate — it quietly degrades response quality in ways that users notice before your metrics do. A system prompt change that subtly shifts tone may improve some interactions while harming others, and you only discover this through qualitative feedback weeks later.

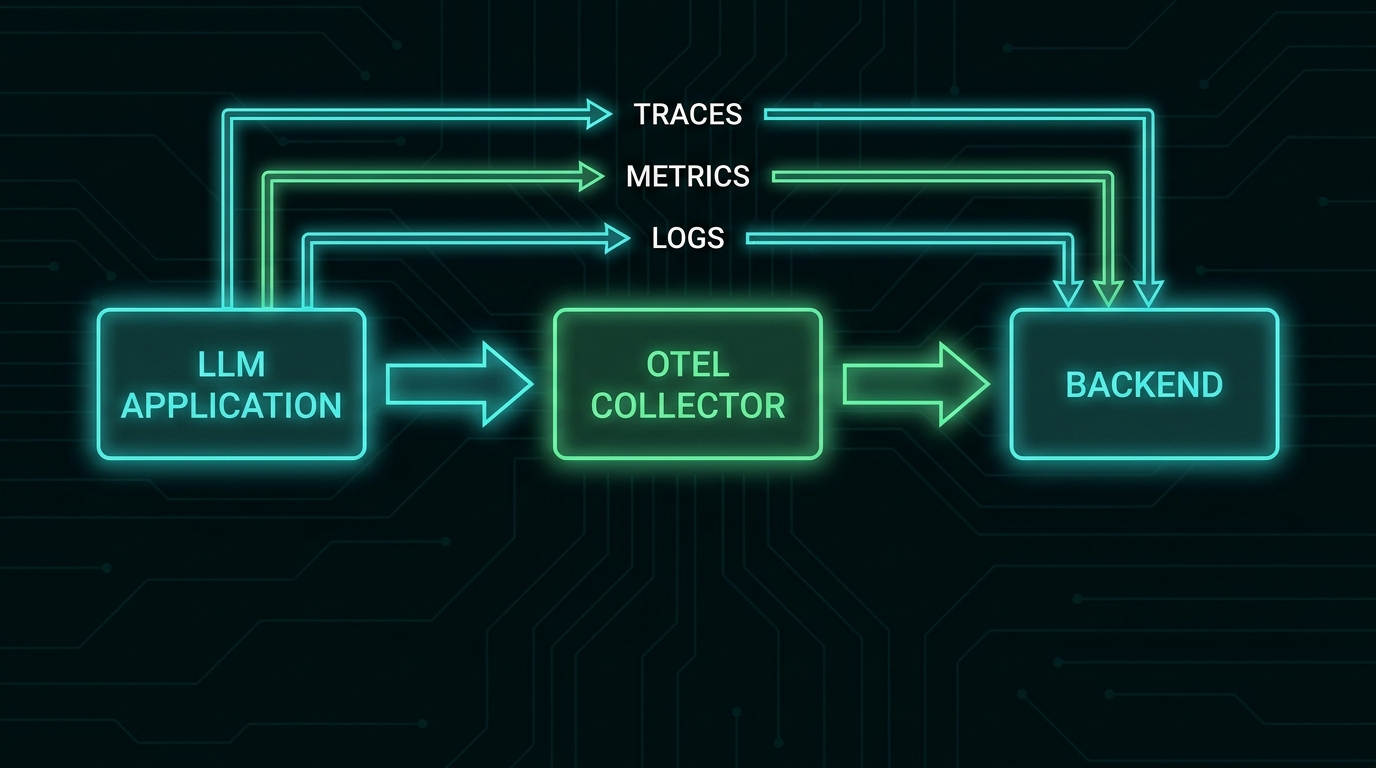
AI observability is the practice of building systems to detect, diagnose, and improve LLM application quality in production. This post covers the full stack: what to measure, how to instrument your applications with OpenTelemetry, what tools to use, and how to build evaluation pipelines that give you confidence before you ship.

AI Observability Architecture

The Three Layers of AI Observability

Traditional observability is often described in terms of the "three pillars": metrics, logs, and traces. AI observability adds a fourth: evaluations. Each layer answers different questions.

Metrics answer: is my system healthy right now? Are latency, cost, and error rates within normal ranges?

Logs answer: what happened during this specific interaction? What did the model receive, what did it produce, and what were the intermediate steps?

Traces answer: how did this request flow through my system? Which components were invoked, in what order, and how long did each take?

Evaluations answer: is my system producing good outputs? This is the layer that traditional observability doesn't address — and it's the most important layer for AI applications.

graph TB subgraph "Layer 1: Metrics" A1[Latency P50/P95/P99] A2[Token usage & cost] A3[Error rates] A4[Throughput] end subgraph "Layer 2: Traces + Logs" B1[Full prompt/response logs] B2[Retrieval traces] B3[Tool call chains] B4[Agent reasoning steps] end subgraph "Layer 3: Evaluations" C1[Automated quality scores] C2[Human feedback labels] C3[Regression test suites] C4[A/B experiment results] end A1 --> B1 B1 --> C1 C1 --> A1

OpenTelemetry for LLM Applications

OpenTelemetry (OTel) is the emerging standard for distributed tracing and observability in cloud-native applications. The CNCF's OpenTelemetry Semantic Conventions for GenAI define how LLM calls should be traced — standardizing attribute names like gen_ai.request.model, gen_ai.usage.input_tokens, gen_ai.usage.output_tokens, and gen_ai.response.finish_reasons.

This standardization means that telemetry from Claude, GPT-4o, Llama, and your custom model infrastructure can be ingested by the same observability backend with the same attribute schema.

Instrumenting Your Application

from opentelemetry import trace
from opentelemetry.sdk.trace import TracerProvider
from opentelemetry.sdk.trace.export import BatchSpanProcessor
from opentelemetry.exporter.otlp.proto.grpc.trace_exporter import OTLPSpanExporter
from opentelemetry.trace import SpanKind
import anthropic
import time

# Initialize OTel tracer
provider = TracerProvider()
exporter = OTLPSpanExporter(endpoint="http://otel-collector:4317")
provider.add_span_processor(BatchSpanProcessor(exporter))
trace.set_tracer_provider(provider)

tracer = trace.get_tracer(__name__)
client = anthropic.Anthropic()

def traced_llm_call(
    messages: list[dict],
    system: str,
    model: str = "claude-haiku-4-5-20251001",
    operation_name: str = "llm.chat"
) -> str:
    """Wrapper that adds OTel tracing to Anthropic API calls."""

    with tracer.start_as_current_span(
        operation_name,
        kind=SpanKind.CLIENT,
    ) as span:
        # Set standard GenAI attributes
        span.set_attribute("gen_ai.system", "anthropic")
        span.set_attribute("gen_ai.request.model", model)
        span.set_attribute("gen_ai.request.max_tokens", 1024)
        span.set_attribute("gen_ai.request.temperature", 0.7)

        # Log the input (be careful with PII)
        span.set_attribute("gen_ai.prompt.0.role", "system")
        span.set_attribute("gen_ai.prompt.0.content", system[:500])  # Truncate for safety

        start_time = time.time()

        try:
            response = client.messages.create(
                model=model,
                max_tokens=1024,
                system=system,
                messages=messages,
            )

            duration_ms = (time.time() - start_time) * 1000

            # Record usage metrics
            span.set_attribute("gen_ai.usage.input_tokens", response.usage.input_tokens)
            span.set_attribute("gen_ai.usage.output_tokens", response.usage.output_tokens)
            span.set_attribute("gen_ai.response.finish_reasons", [response.stop_reason])
            span.set_attribute("llm.latency_ms", duration_ms)

            # Calculate cost (claude-haiku-4-5 pricing)
            input_cost = response.usage.input_tokens * 0.00000080
            output_cost = response.usage.output_tokens * 0.000004
            span.set_attribute("llm.cost_usd", input_cost + output_cost)

            output_text = response.content[0].text
            span.set_attribute("gen_ai.completion.0.role", "assistant")
            span.set_attribute("gen_ai.completion.0.content", output_text[:500])

            return output_text

        except Exception as e:
            span.record_exception(e)
            span.set_status(trace.StatusCode.ERROR, str(e))
            raise

Tracing RAG Pipelines

For retrieval-augmented generation, the trace should capture each component of the pipeline:

def traced_rag_query(user_query: str) -> str:
    """RAG pipeline with full observability across retrieval and generation."""

    with tracer.start_as_current_span("rag.query") as root_span:
        root_span.set_attribute("rag.query", user_query)

        # Trace retrieval
        with tracer.start_as_current_span("rag.retrieval") as retrieval_span:
            retrieved_chunks = vector_db.search(user_query, top_k=5)

            retrieval_span.set_attribute("rag.chunks_retrieved", len(retrieved_chunks))
            retrieval_span.set_attribute("rag.top_score", retrieved_chunks[0]["score"] if retrieved_chunks else 0)
            retrieval_span.set_attribute("rag.avg_score", 
                sum(c["score"] for c in retrieved_chunks) / max(len(retrieved_chunks), 1))

        # Trace reranking
        with tracer.start_as_current_span("rag.reranking") as rerank_span:
            reranked = reranker.rerank(user_query, retrieved_chunks)
            context = "\n\n".join([c["content"] for c in reranked[:3]])
            rerank_span.set_attribute("rag.chunks_after_rerank", 3)
            rerank_span.set_attribute("rag.context_tokens", len(context.split()) * 1.3)

        # Trace generation
        prompt = f"Answer based on context:\n\n{context}\n\nQuestion: {user_query}"
        response = traced_llm_call(
            messages=[{"role": "user", "content": prompt}],
            system="You are a helpful assistant. Answer only from the provided context.",
            operation_name="rag.generation"
        )

        root_span.set_attribute("rag.response_length", len(response))
        return response

The Metrics That Actually Matter

Operational Metrics (Standard)

Track these with any metrics system (Prometheus, Datadog, CloudWatch):

  • TTFT (time to first token) — P50, P95, P99 by model and operation type
  • Total latency — P50, P95, P99
  • Token usage — input tokens, output tokens, per operation type
  • Cost — per request, per operation type, per day, with budget alerts
  • Error rate — API errors, timeouts, content policy rejections
  • Throughput — requests per second

Quality Metrics (AI-Specific)

These require more thought. Standard application metrics don't capture quality.

Retrieval relevance: for RAG systems, track the average relevance score of retrieved chunks. A sudden drop (chunks scoring <0.5 when historical average is 0.75) indicates a problem with embeddings, data freshness, or query processing.

Response length distribution: sudden changes in average response length often indicate prompt drift or model behavior changes. If your chatbot's responses drop from 150 words average to 30 words average after a deployment, something changed.

User feedback signals: thumbs up/down, explicit ratings, session abandonment, follow-up correction queries ("no, I meant...", "that's wrong", "try again"). These are noisy but valuable signals about quality.

LLM-as-judge scores: use an evaluator model to score the quality of production responses on dimensions you care about — helpfulness, accuracy, tone, conciseness. Run this on a sample of traffic (100% is expensive; 5-10% is usually sufficient).

Evaluation Pipelines

The most important observability investment for AI applications is a systematic evaluation pipeline: a set of test cases that you run against your system to measure quality, detect regressions before they reach users, and quantify the impact of changes.

Offline Evaluation

Run before deployment, on a held-out test set:

from dataclasses import dataclass
from typing import Callable

@dataclass
class EvalCase:
    id: str
    input: str
    expected: str  # For exact-match or reference-based evals
    metadata: dict  # Category, difficulty, etc.

class EvaluationPipeline:
    def __init__(self, evaluators: list[Callable]):
        self.evaluators = evaluators

    def run(self, cases: list[EvalCase], system_fn: Callable) -> dict:
        results = []

        for case in cases:
            response = system_fn(case.input)
            scores = {}

            for evaluator in self.evaluators:
                scores[evaluator.__name__] = evaluator(
                    input=case.input,
                    response=response,
                    expected=case.expected,
                )

            results.append({
                "id": case.id,
                "input": case.input,
                "response": response,
                "expected": case.expected,
                "scores": scores,
                "metadata": case.metadata,
            })

        # Aggregate metrics
        aggregated = {
            evaluator.__name__: sum(r["scores"][evaluator.__name__] for r in results) / len(results)
            for evaluator in self.evaluators
        }

        return {"cases": results, "aggregate": aggregated}

def llm_judge_helpfulness(input: str, response: str, **kwargs) -> float:
    """Use Claude as a judge for response helpfulness (0.0 - 1.0)."""
    judge_prompt = f"""Rate the helpfulness of this response on a scale of 0.0 to 1.0.

User question: {input}
Response: {response}

Output only a number between 0.0 and 1.0."""

    score_text = evaluator_client.messages.create(
        model="claude-haiku-4-5-20251001",
        max_tokens=10,
        messages=[{"role": "user", "content": judge_prompt}],
    ).content[0].text.strip()

    try:
        return float(score_text)
    except ValueError:
        return 0.5  # Default if parsing fails

Regression Testing in CI

Integrate your evaluation pipeline into CI so every pull request is scored against your eval suite:

# .github/workflows/eval.yml
name: LLM Evaluation

on:
  pull_request:
    paths: ['prompts/**', 'src/ai/**', 'config/**']

jobs:
  evaluate:
    runs-on: ubuntu-latest
    steps:
      - uses: actions/checkout@v4

      - name: Run evaluation suite
        run: python eval/run_evals.py --output eval_results.json
        env:
          ANTHROPIC_API_KEY: ${{ secrets.ANTHROPIC_API_KEY }}

      - name: Compare to baseline
        run: |
          python eval/compare_baseline.py \
            --current eval_results.json \
            --baseline eval/baseline_results.json \
            --threshold 0.02  # Fail if any metric drops >2 percentage points

      - name: Post results to PR
        uses: actions/github-script@v7
        with:
          script: |
            const results = require('./eval_results.json');
            const comment = formatEvalResults(results);
            github.rest.issues.createComment({
              issue_number: context.issue.number,
              owner: context.repo.owner,
              repo: context.repo.repo,
              body: comment
            });

Online Evaluation with Traffic Sampling

For production traffic monitoring, sample a percentage of live requests and run evaluations asynchronously:

import random
from background_worker import async_task

def handle_user_query(user_query: str, session_id: str) -> str:
    response = rag_pipeline.run(user_query)

    # Sample 10% of traffic for quality evaluation
    if random.random() < 0.10:
        evaluate_response_async.delay(
            session_id=session_id,
            query=user_query,
            response=response,
        )

    return response

@async_task
def evaluate_response_async(session_id: str, query: str, response: str):
    """Run in background worker — doesn't block user response."""
    scores = {
        "helpfulness": llm_judge_helpfulness(query, response),
        "groundedness": llm_judge_groundedness(query, response),
        "conciseness": llm_judge_conciseness(response),
    }

    # Store in metrics database
    metrics_db.insert({
        "session_id": session_id,
        "timestamp": datetime.utcnow(),
        "scores": scores,
    })

    # Alert if quality drops below threshold
    if scores["helpfulness"] < 0.5:
        alert_team(f"Low helpfulness score: {scores['helpfulness']:.2f} for session {session_id}")

The Debugging Workflow

When quality issues appear in production, the investigation workflow is:

  1. Segment by attribute: is the quality drop uniform, or concentrated in specific categories? Filter your traces by query type, user segment, model version, prompt version. Narrow the scope.

  2. Find the inflection point: when did quality start dropping? Correlate with deployments, configuration changes, and data updates. Build your telemetry to make this query possible.

  3. Replay with logging: take the problematic traces and replay them with full debug logging — complete prompts, all context, every intermediate step. Compare the input/output pairs between a period that worked and a period that didn't.

  4. Isolate the component: in a RAG pipeline, is the retrieval component returning different results, or is the generation given the same context different? In an agent, is the reasoning loop behaving differently, or are the tools returning different results? Isolate to component level.

  5. Quantify with your eval suite: once you have a hypothesis, create a few targeted eval cases that should fail given your hypothesis. Run them against the eval pipeline. If your hypothesis is right, you'll see it in the scores.

Production Tooling Landscape

The AI observability tooling space has matured significantly in 2026:

Tool Best For
LangSmith (LangChain) Teams using LangChain/LangGraph; good trace visualization
Langfuse Open-source, self-hostable; strong for teams with data privacy requirements
Arize Phoenix Strong on eval pipelines and automated quality scoring
Braintrust Developer-focused eval platform; good CI/CD integration
Honeycomb + OTel Teams already using Honeycomb; excellent query flexibility for trace analysis
Custom OTel + Grafana Maximum flexibility; higher operational cost

For most teams starting out: Langfuse (self-hosted or cloud) provides the best balance of observability depth and operational simplicity. It integrates with OpenTelemetry, supports custom evaluation metrics, and has strong trace visualization for multi-step agent workflows.

Conclusion

Production AI applications fail differently from traditional applications. The failures are often subtle, often gradual, and often invisible to standard monitoring until users have been experiencing them for days.

Investing in AI observability before you need it is the right call. Traces, logs, and operational metrics take hours to add. Building a meaningful eval suite takes days. But once they're in place, the time from "something is wrong" to "here's exactly what changed and why" drops from weeks to hours.

The teams that win with AI applications in production are the ones who treat quality as a measurable, monitorable signal — not as a feeling they get from reading user feedback.


Sources & References

  1. OpenTelemetry Semantic Conventions for GenAI
  2. Langfuse — "LLM Observability"
  3. Anthropic — "Evaluating AI Systems"
  4. Hamel Husain — "Your AI Product Needs Evals"
  5. Arize AI — "LLM Evaluation Guide"
  6. OpenAI — "A practical guide to building LLM evals"

About the Author

Toc Am

Founder of AmtocSoft. Writing practical deep-dives on AI engineering, cloud architecture, and developer tooling. Previously built backend systems at scale. Reviews every post published under this byline.

LinkedIn X / Twitter

Published: 2026-05-02 · Written with AI assistance, reviewed by Toc Am.

Get These In Your Inbox

Weekly deep-dives on AI engineering, no fluff. Join the newsletter →

Subscribe (free)

Or grab the book ($39, ~100 pages) · Buy me a coffee

Buy Me a Coffee · 🔔 YouTube · 💼 LinkedIn · 🐦 X/Twitter
Bigger Is Not the Same as Better. The Job That Moved Is the Phone, Not the Lab.

Bigger is a plan. The phone is the receipt. The brief for this cycle is a question: does bigger always mean better in AI? The 2026 answer i...