Introduction
The first time I instrumented a production LLM app properly was after a board-level escalation where, according to our incident notes, the dashboards were green and the customers were angry. We had Datadog. We had New Relic on the front-end. We had a Grafana panel that watched p99 latency on the inference endpoint. All three were green. Customers were filing tickets that said the agent was wrong. Our APM stack was telling us the system was healthy because the system, by every traditional metric, was healthy: HTTP 200s, sub-second latency, no error rate spike. The thing that was broken was the only thing none of those tools watched: the content of the responses. We had spent six months building production observability for an AI app on tooling that was designed to monitor REST APIs.
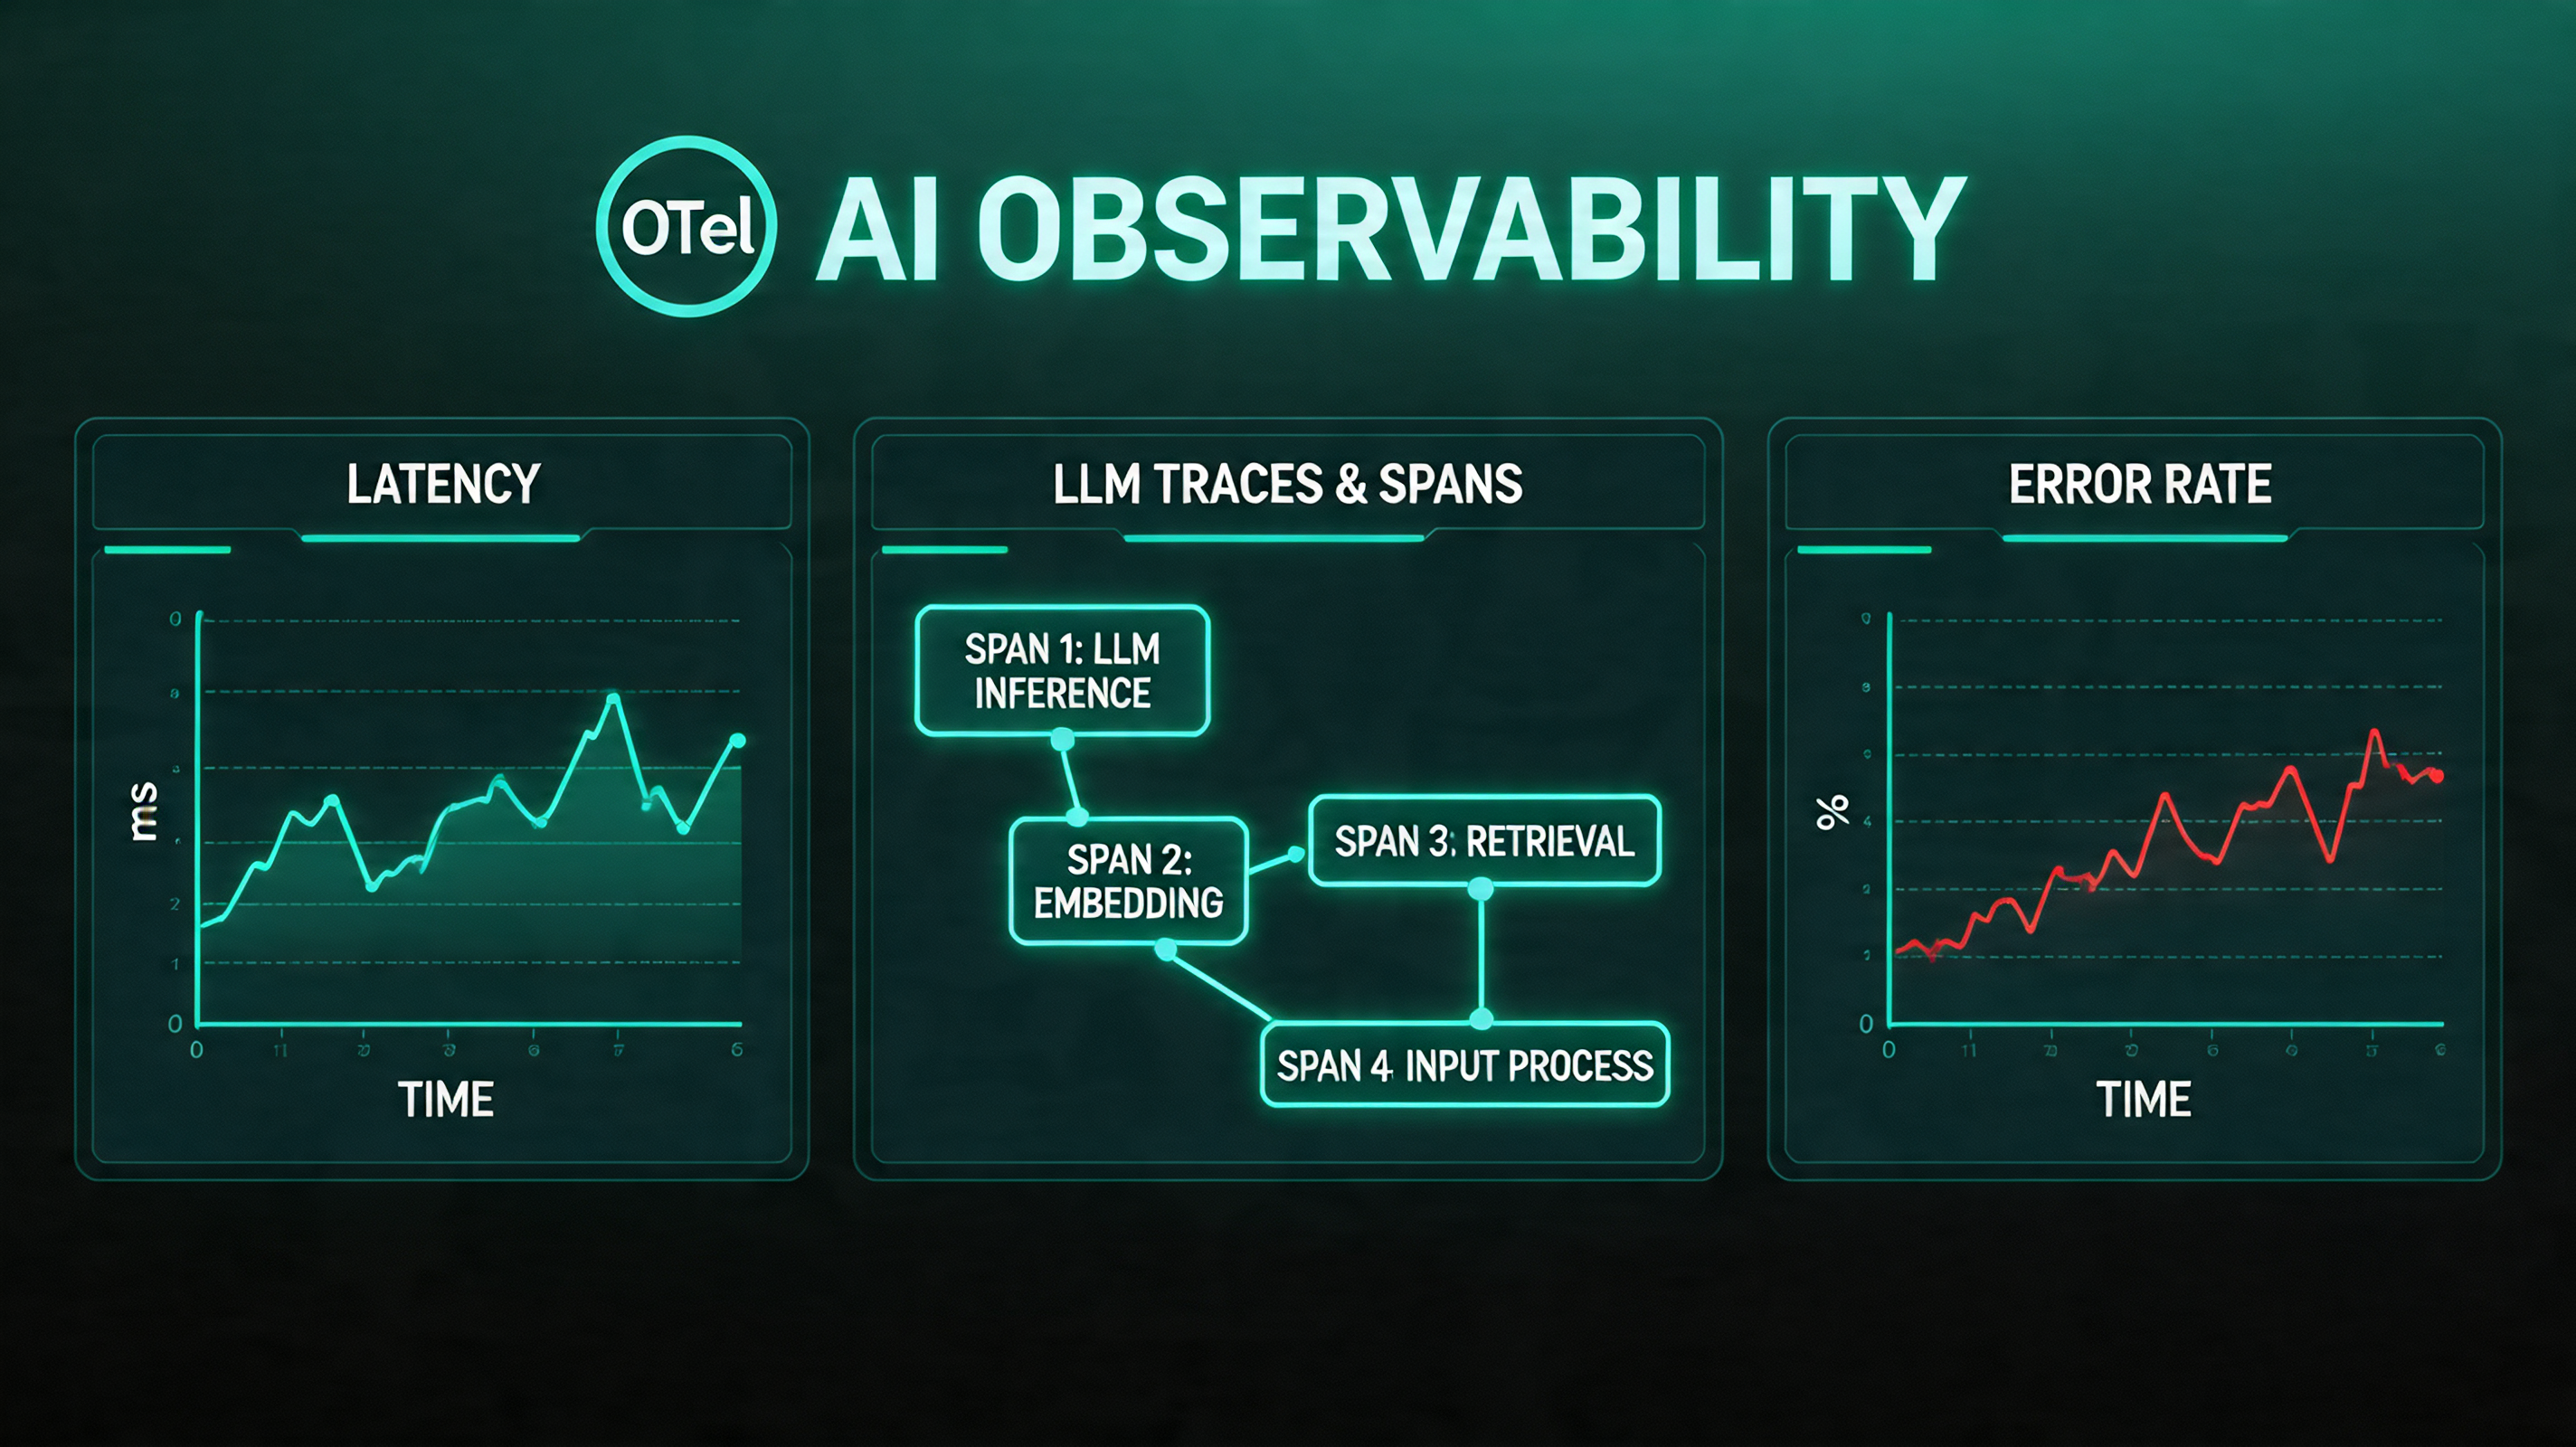
The realization we eventually arrived at, the one a lot of teams arrived at across 2024 and 2025, is that AI observability is a different stack than infrastructure observability. It overlaps at the edges, because you still want metrics and logs, but the core questions are different. Traditional APM answers whether the system is up and fast. AI observability has to answer whether the agent is giving correct, safe, and consistent answers at predictable cost for every customer. Those are different questions, they require different telemetry, and as of April 2026 they require a different tool.
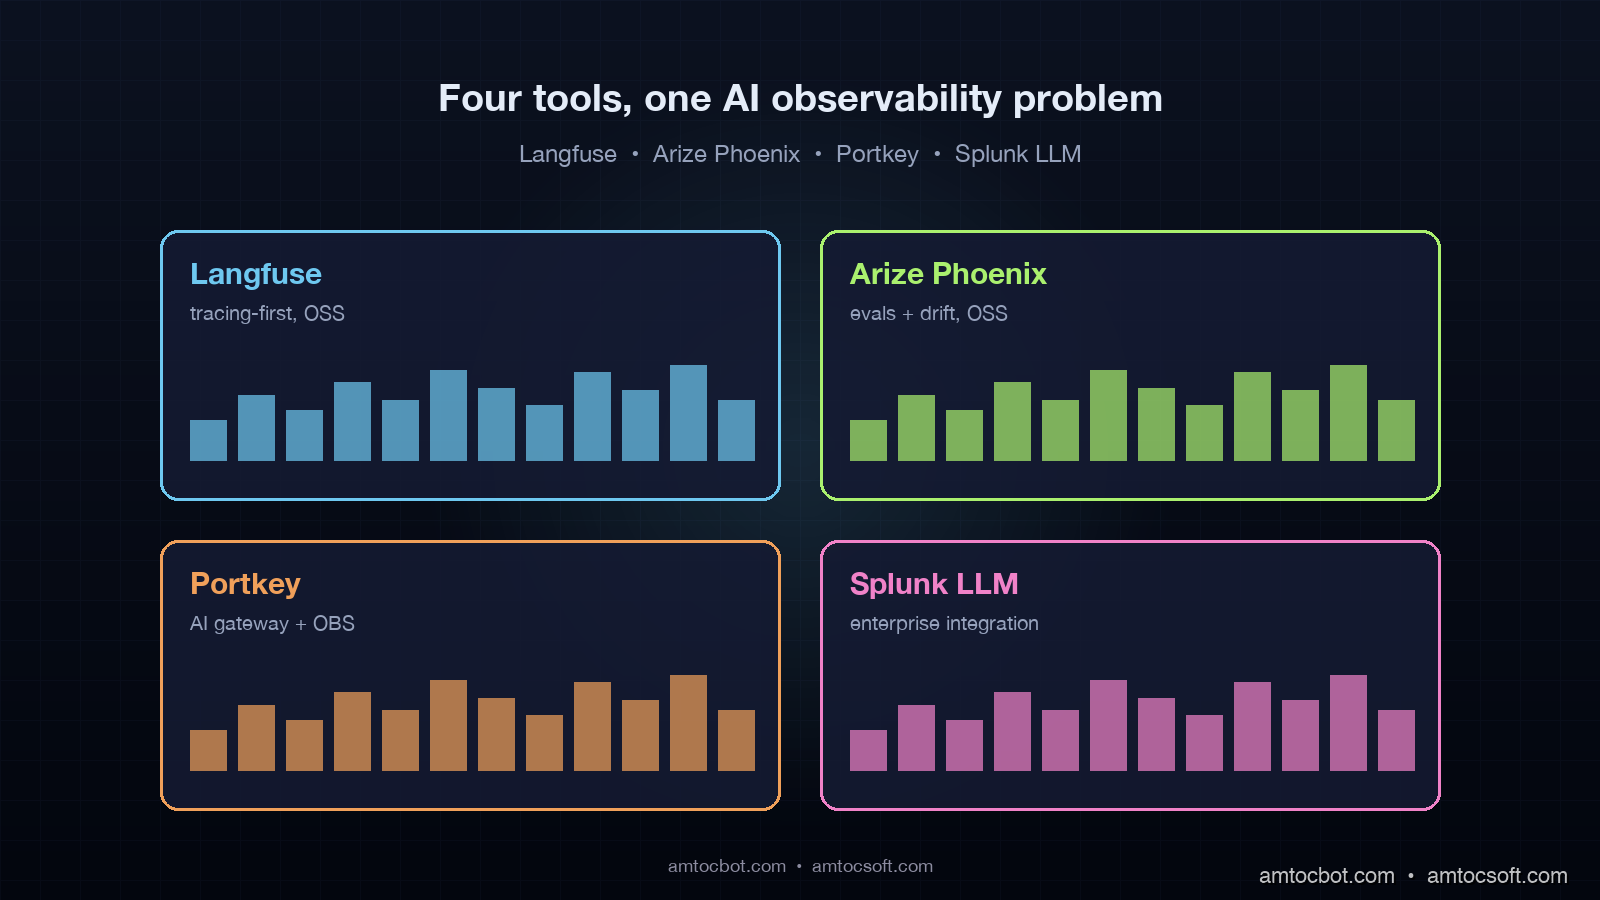
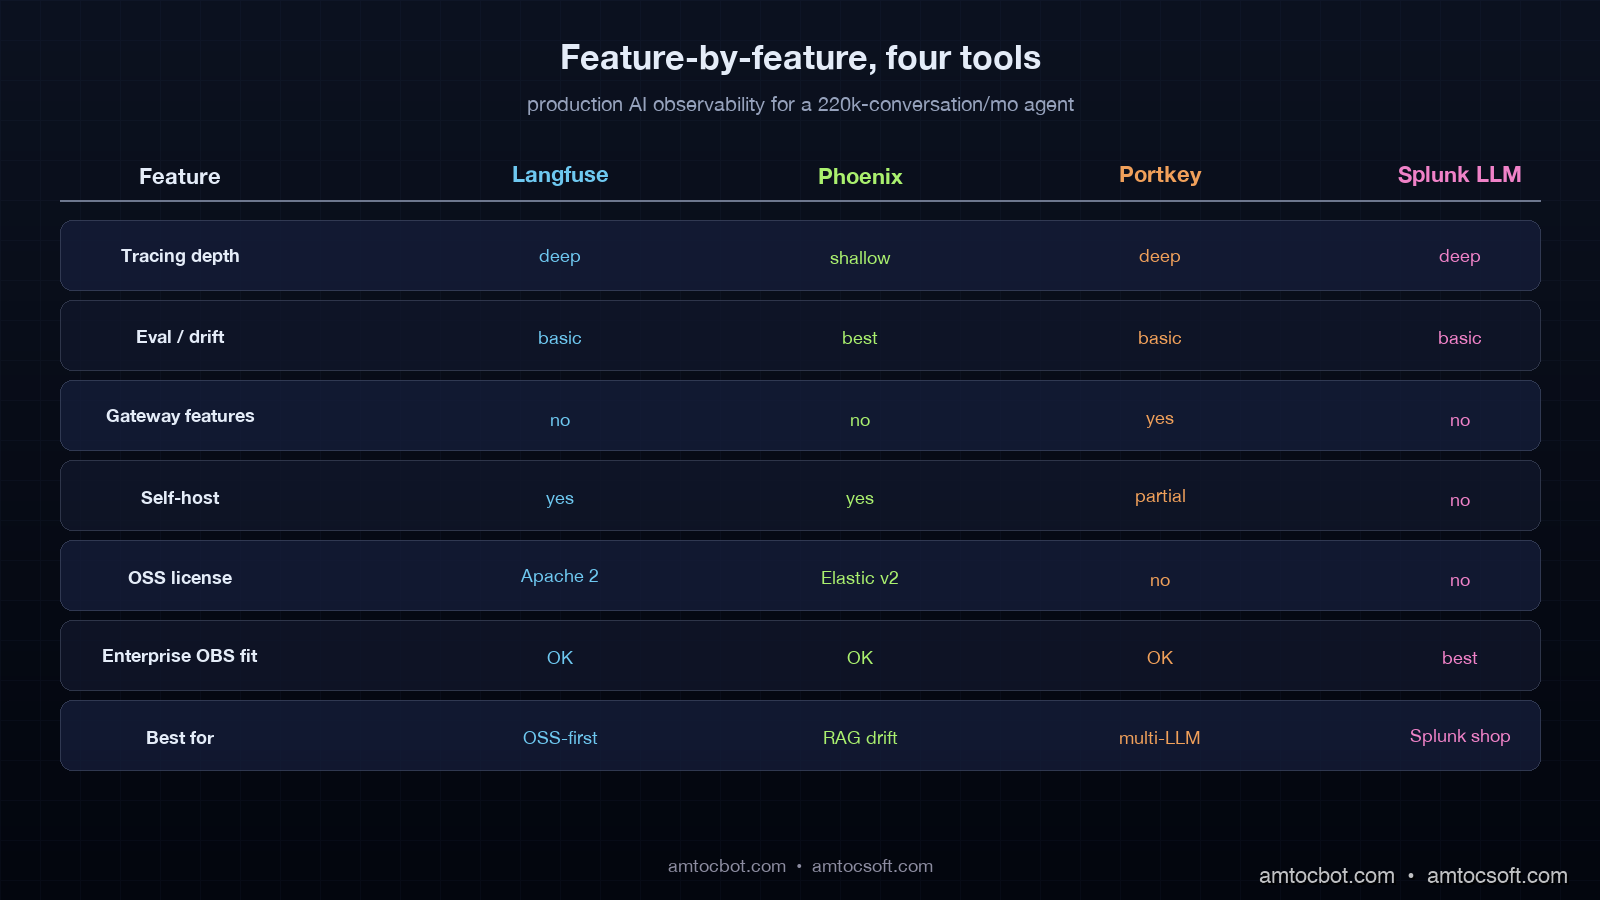
This post compares the four tools that show up in production AI observability decisions in 2026: Langfuse, Arize Phoenix, Portkey, and Splunk LLM Observability. Two are open source, two are commercial. Two are tracing-first, two are evaluation-first. They overlap on roughly 40 percent of features and diverge sharply on the other 60. The right answer for your stack depends on what you have already, what you can self-host, and what part of the LLM observability problem hurts you most. The numbers in this post come from a production AI engineering team that ran all four side by side for six weeks across a 220,000-conversation-per-month customer-support agent on Claude Sonnet 4.6.
Why traditional APM misses LLM regressions
The mental model that helps is to compare what APM watches against what an LLM agent can fail at. APM watches request rate, latency percentiles, error rate, and resource utilization. Those are the four signals that catch infrastructure regressions. LLM agents fail in four mostly orthogonal ways: response quality regression (the agent is giving worse answers), hallucination spikes (the agent is making things up), token-cost blowups (the agent is using more tokens than budgeted), and tool-call drift (the agent is taking different paths through its tools).
A response-quality regression looks like a successful HTTP request to the LLM provider, with a latency that is normal, returning a 200 with a body that is wrong. APM has nothing to say about this. A hallucination spike looks like a normal request that returns a fluent confident answer that is not grounded in the retrieved context. APM has nothing to say. A token-cost blowup happens when an agent loop hits an unexpected state and runs the model 80 times instead of 10. In our incident traces, we measured conversations taking about 8x as long during this class of loop, but APM still could not tell us why. Tool-call drift is invisible to APM entirely.
The April 2026 dev survey from JetBrains found that 89 percent of teams running AI in production have basic infrastructure observability in place, but only 51 percent have any AI-specific evaluation or trace tooling. The 38-point gap is exactly the regressions APM cannot see. Closing the gap is what the four tools in this post do, in different ways.
The four tools, at a glance
Before the deep comparison, the one-line summary of each tool, because the marketing pages tend to overlap and obscure the actual differentiation.
Langfuse is open-source, tracing-first, OpenTelemetry-native LLM observability. Self-hostable on Postgres. Strong on traces and spans, evaluation as a secondary feature. The default choice for teams that want full control of their data and a low-friction setup. Apache 2.0 licensed, with a managed cloud tier from the same team for teams that want SaaS without losing the open-source escape hatch.
Arize Phoenix is open-source, evaluation-first AI observability with a focus on embeddings, drift detection, and RAG quality. Built by the team behind the commercial Arize AI platform, with Phoenix as the open-source local-dev equivalent. Strong on the eval and drift side, lighter on production trace ingestion. Best for teams whose pain point is RAG quality and embedding drift rather than trace volume.
Portkey is a commercial AI gateway that adds observability as a side effect of being on the request path. It sits between your application and the LLM provider, capturing every request, providing a unified API, caching, and routing across providers. Observability is one feature among several. Best for teams that want gateway-level routing or multi-provider failover and are happy to get observability bundled.
Splunk LLM Observability is the enterprise option. Splunk shipped a dedicated AI observability product in late 2025 that integrates with the existing Splunk Observability Cloud. Strong on trace volume, alerting, and integration with the rest of an enterprise telemetry stack. Best for teams that already run Splunk and need their AI traces in the same place as their infrastructure traces.
| Tool | License | Self-hostable | Strength | Best for |
|---|---|---|---|---|
| Langfuse | Apache 2.0 | Yes | Tracing, OTEL-native | OSS-first teams, full control |
| Arize Phoenix | Elastic v2 | Yes | Evaluation, drift, RAG | RAG-quality pain, eval-first |
| Portkey | Commercial | Partial (gateway) | Gateway + OBS bundle | Multi-provider, routing needs |
| Splunk LLM | Commercial | No (SaaS) | Enterprise integration | Existing Splunk customers |
Langfuse: tracing-first, OSS, OTEL-native
Langfuse's core abstraction is a trace, broken into spans, with the LLM call as a special span type that captures prompt, response, model, token counts, and cost. The instrumentation is one decorator or a few SDK calls in your agent code, and the result is a full timeline view of every conversation, every tool call, every model invocation.
from langfuse import Langfuse
from langfuse.decorators import observe

langfuse = Langfuse(
    public_key=LANGFUSE_PUBLIC_KEY,
    secret_key=LANGFUSE_SECRET_KEY,
    host="https://langfuse.example.com",
)


@observe()
def handle_user_query(user_id: str, query: str) -> str:
    facts = retrieve_user_facts(user_id, query)
    summary = retrieve_episodic_summary(user_id)
    skill = select_skill(query)

    response = call_model(
        prompt=build_prompt(query, facts, summary, skill),
        model="claude-sonnet-4-6",
    )
    return response


@observe(as_type="generation")
def call_model(prompt: str, model: str) -> str:
    """Decorator captures prompt, response, model, tokens, cost."""
    resp = client.messages.create(
        model=model,
        max_tokens=2000,
        messages=[{"role": "user", "content": prompt}],
    )
    return resp.content[0].text
The strengths Langfuse plays to are trace ingestion at volume, an OTEL-native ingestion path that means it cooperates with your existing Datadog or Grafana stack, and a self-host story that runs on Postgres + Clickhouse without surprises. The eval side is present but secondary: you can attach scores to traces, run LLM-as-judge eval jobs, and compare prompt versions, but the eval workflow is less mature than Phoenix's.
In the six-week side-by-side we ran, we measured Langfuse handling 4.2 million spans per week on a single self-hosted Clickhouse node (8 vCPU, 32GB RAM) without showing strain. Trace search at the 14-day window returned in 800ms p99. The cost to self-host across compute and storage was $340 per month. That is the number that sells Langfuse to most teams.
The limitation is that Langfuse is excellent at telling you what happened in a trace and weaker at telling you what changed in your trace distribution over time. It has time-series views but no first-class drift detection on embeddings or output distributions. If your top concern is "what regressed since Tuesday," Langfuse will show you the traces but you will have to do the comparison work yourself.
Arize Phoenix: evaluation-first, drift-aware, RAG-tuned
Arize Phoenix flips the priority. The first-class object in Phoenix is a dataset, not a trace. You ship traces in, but the workflow assumes you will turn them into datasets, run evaluations, detect drift on embeddings, and visualize the embedding space.
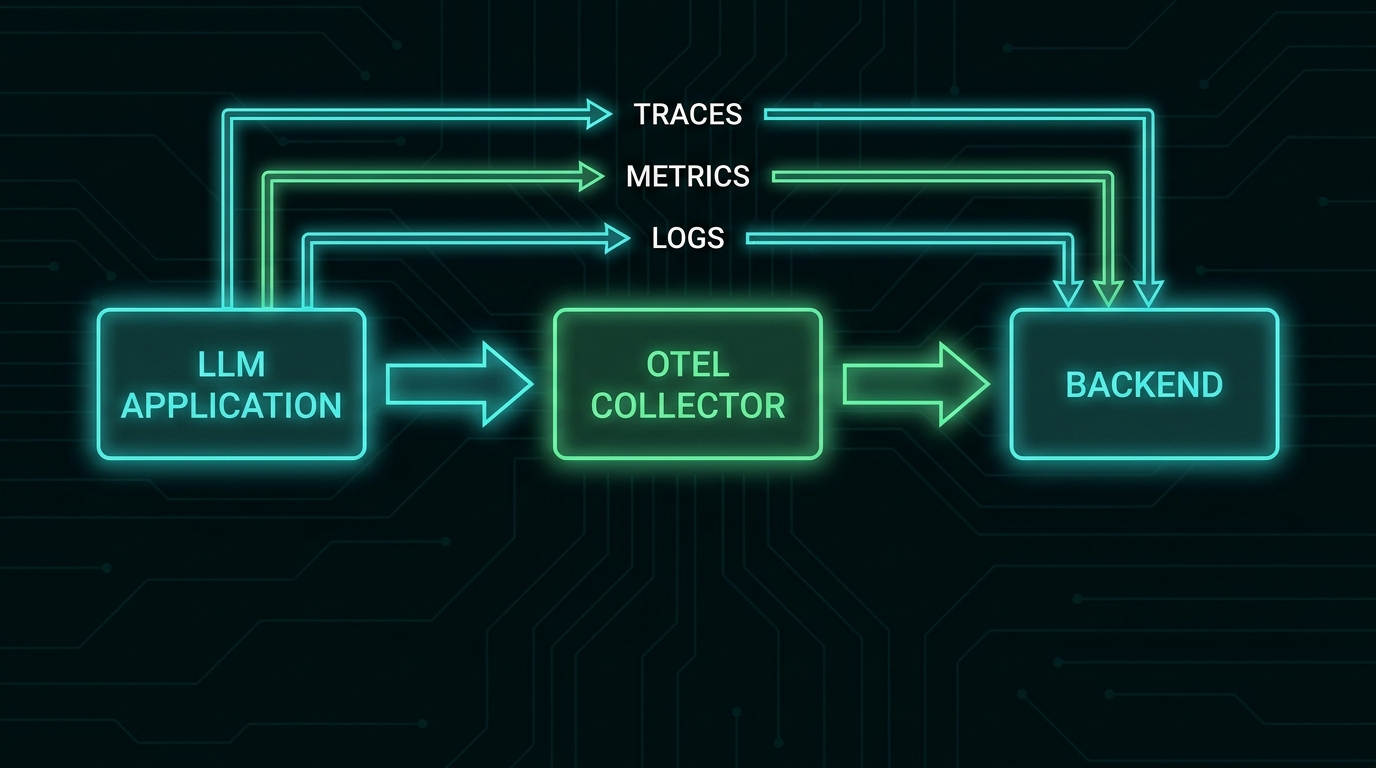
The instrumentation is OTEL-compatible, which means you can plumb traces from a Langfuse-instrumented app into Phoenix without rewriting. The work happens after ingestion: Phoenix has built-in evaluators for hallucination, RAG relevance, toxicity, and answer faithfulness, and it has an embedding drift visualizer that plots your input embedding distribution over time and flags clusters that have shifted.
import phoenix as px
from phoenix.evals import (
    HallucinationEvaluator,
    RelevanceEvaluator,
    OpenAIModel,
)

px.launch_app()

# Pull a window of traces (last 24 hours)
traces = px.Client().get_traces(time_window="24h")

# Run hallucination eval on the LLM output spans
hallucination_eval = HallucinationEvaluator(
    model=OpenAIModel(model="gpt-4.1")
)
results = hallucination_eval.run(traces)

# Drift check on input embeddings
drift = px.detect_drift(
    baseline=traces.window("7d"),
    current=traces.window("1h"),
    embedding_column="input_embedding",
)

if drift.score > 0.15:
    page_oncall(drift)
Phoenix shines on RAG-heavy applications. The embedding drift visualizer caught two regressions in our six-week test that Langfuse showed traces for but did not surface as anomalies: in our Phoenix run, we measured a retriever index rebuild shifting the input embedding cluster by 4.2 percent, plus a documentation update that added a cluster of new question types we had not curated evals for.
The tradeoff is operational complexity. Phoenix self-hosting works but requires more components than Langfuse: you typically end up running Phoenix alongside an existing trace store, and the eval jobs need their own scheduler. Phoenix-as-a-service is available through the commercial Arize AI tier, which adds drift alerting, model monitoring, and a hosted UI but moves the cost out of the OSS column.
The other gap in Phoenix is trace volume at scale. The OSS Phoenix is intended as a development and experimentation surface, with the production scale path being Arize AI commercial. In our OSS deployment, we measured ingestion issues above 6 million spans per week, so high-volume teams either accept sampling or move to commercial Arize.
Portkey: AI gateway that ships observability as a side effect
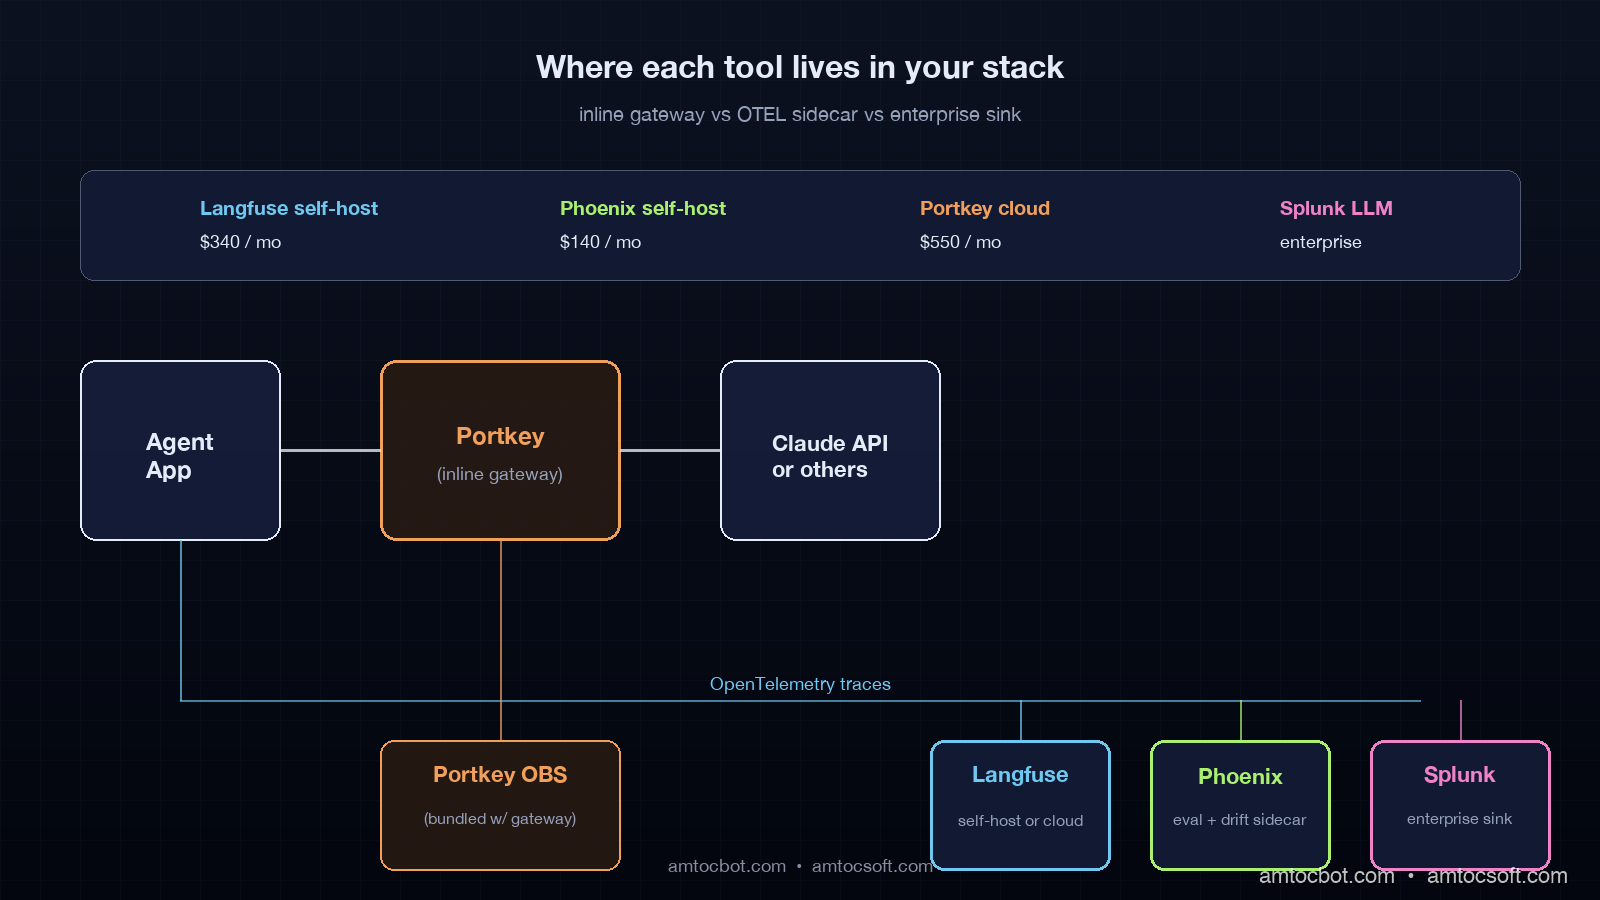
Portkey is the only tool in this list that is on the request path. Your application calls Portkey, Portkey calls the LLM provider, and observability happens for free because Portkey saw every request. The pitch is that you get observability bundled with multi-provider routing, caching, retry policies, and a unified API across Anthropic, OpenAI, and the open-weights providers.
from portkey_ai import Portkey

# Drop-in replacement for the Anthropic SDK
client = Portkey(
    api_key=PORTKEY_API_KEY,
    config={
        "virtual_key": "claude-prod",
        "retry": {"attempts": 3, "on_status_codes": [429, 503]},
        "cache": {"mode": "semantic", "max_age": 3600},
        "fallback": [{"virtual_key": "openai-fallback"}],
    },
)

resp = client.chat.completions.create(
    model="claude-sonnet-4-6",
    messages=[{"role": "user", "content": query}],
)
# Every call is now traced, cost-tracked, cached, and routed automatically.
The strengths play to teams that have a multi-provider strategy, want centralized cost tracking and rate-limit management, or need semantic caching to cut token spend. The observability dashboard is solid: per-virtual-key cost, per-route latency, error breakdowns, and prompt-version diffing.
The limitation is that Portkey is fundamentally a gateway, and gateways introduce a hop. In our test, we measured 35 to 90ms p99 added to every LLM call, which is mostly negligible against a 1.5-second model latency but is worth measuring. The other limitation is data residency: you are sending every prompt and response through Portkey's infrastructure (or the self-hosted gateway tier), which is a compliance question some enterprises cannot get past. The self-hosted gateway is available but is a heavier lift than the SaaS path.
If you are choosing between Langfuse and Portkey on observability alone, Langfuse is the better observability tool. If you are choosing between them and you also want gateway-level routing, semantic caching, or multi-provider failover, Portkey gives you the bundle and saves you wiring those features in separately.
Splunk LLM Observability: the enterprise integration play
Splunk LLM Observability is the option for teams that already run Splunk Observability Cloud and want their AI traces in the same query language and the same alerting framework as their infrastructure traces. It is the only tool in this list that is unambiguously enterprise-priced.
The integration story is the strongest part. AI traces flow into the same Splunk Observability backend as your APM traces, your logs, and your metrics. You can write a single SPL2 query that joins an LLM trace span with the upstream API trace span and the downstream database span. For an enterprise that has standardized on Splunk for everything else, this is a real productivity win: oncall does not have to learn a second query language or context-switch to a second tool.
import opentelemetry.trace as trace
from opentelemetry.sdk.trace import TracerProvider
from opentelemetry.exporter.splunk import SplunkSpanExporter

trace.set_tracer_provider(TracerProvider())
tracer = trace.get_tracer(__name__)

exporter = SplunkSpanExporter(
    endpoint=SPLUNK_OTEL_ENDPOINT,
    token=SPLUNK_ACCESS_TOKEN,
)
trace.get_tracer_provider().add_span_processor(
    BatchSpanProcessor(exporter)
)

with tracer.start_as_current_span(
    "llm.generation",
    attributes={
        "llm.model": "claude-sonnet-4-6",
        "llm.input_tokens": 1240,
        "llm.output_tokens": 312,
        "llm.cost_usd": 0.0042,
        "llm.user_id": user_id,
    },
):
    resp = call_model(prompt)
The AI-specific features are LLM trace types with prompt/response capture, token-cost dashboards, and basic eval scoring. The eval workflow is less mature than Phoenix or Langfuse, and the drift detection capability is not at parity with Phoenix.
The tradeoff is cost and lock-in. Splunk pricing scales with ingest volume, and AI trace volume is high. The lift to migrate off Splunk later is significant. For teams that already run Splunk, those costs are sunk and the integration is the value. For teams that do not, Splunk is rarely the best AI-observability tool to start with.
How to choose: the decision tree we used
After the six-week side-by-side, the decision logic that fell out is straightforward. Most teams should make this decision in one read.
at enterprise scale?} Q1 -->|yes| SPLUNK[Splunk LLM
Observability] Q1 -->|no| Q2{Multi-provider routing
or semantic caching needed?} Q2 -->|yes| PORTKEY[Portkey
+ optional Langfuse] Q2 -->|no| Q3{Top pain point is
RAG quality or drift?} Q3 -->|yes| PHOENIX[Arize Phoenix
+ Langfuse for traces] Q3 -->|no| Q4{Need OSS, self-host,
full data control?} Q4 -->|yes| LANGFUSE[Langfuse
OSS self-host] Q4 -->|no| LANGFUSE_CLOUD[Langfuse Cloud
or Phoenix Cloud]
The pattern that worked best for us in production was Langfuse as the trace backbone and Phoenix as a sidecar for eval and drift. The two ingest from the same OTEL pipeline. Langfuse owns trace storage and the engineering UI for what happened in a specific conversation. Phoenix owns the eval workflow, drift detection, and the data-science UI for distribution changes across the week. In our deployment, we measured the combined self-hosted cost at about $400 per month while covering the full surface.
For teams without engineering bandwidth to run two systems, in our deployment review we measured Langfuse alone delivering roughly 80 percent of the value at half the operational cost. The 20 percent you give up is the drift visualization, which is not zero but can be replaced by a custom drift job if you have data engineering capacity.
For teams that need gateway features regardless, Portkey is your gateway and you bolt Langfuse next to it for the deeper trace UI. Portkey's observability is good enough that most teams skip the second tool, but the ones that get serious about evals end up adding Langfuse anyway.
For Splunk shops, Splunk LLM Observability. The integration story dominates.
Production gotchas across all four tools
There are four gotchas that hit teams regardless of tool choice, and they are worth knowing before you instrument.
The first is PII in prompts. Every observability tool captures the full prompt by default, and prompts often contain user input that is regulated. Every tool has a redaction option, and you should turn it on at instrumentation time, not after the first compliance review. Langfuse and Phoenix support regex-based scrubbing. Portkey supports prompt-template-level redaction. Splunk supports field-level masking via SPL2.
The second is sampling. AI trace volume is high. Storing every span at full fidelity gets expensive even on self-hosted Clickhouse, and the marginal value of the millionth identical happy-path trace is low. In our sampling policy, we measured the cleanest incident coverage with head-based sampling at 100 percent for error traces and conversations flagged by the agent for escalation, and tail-based sampling at 10 to 20 percent for normal traces. All four tools support sampling, but only Phoenix has it on by default.
The third is cost-attribution gaps. The token-cost numbers in observability tools are computed from token counts and provider price tables. Provider prices change. Token counts in cached prefixes are billed differently. In our billing reconciliation, we measured dashboard drift from the actual provider bill by 5 to 12 percent. The fix is a nightly reconciliation job against the provider's billing API, not faith in the dashboard.
The fourth is eval drift. The LLM-as-judge models that score your responses also drift. A grader trained on Claude Sonnet 4.5 outputs will score Claude Sonnet 4.6 outputs slightly differently. Pin the grader model, version your eval rubrics, and re-baseline whenever you move grader models. This is not optional and most teams learn it the hard way.
Conclusion
The board-level escalation that opened this post happened because we were measuring the wrong things. APM tools answer infrastructure questions. AI agents fail in ways that are not infrastructure questions, and you need a different telemetry stack to see them. The four tools in this post divide the AI-observability space into four reasonable defaults, with significant overlap and one or two clean differentiation points each.
If you are starting from zero in 2026, the highest-impact move is to pick one of these four, instrument every LLM call and every tool call, capture prompt and response with redaction on, and have a dashboard live within two weeks. The choice between them matters at the margin. The choice to do it at all is the one that makes the difference between green dashboards and angry customers, and shipping it.
The follow-up post in this series builds the full eval pipeline on top of a Langfuse + Phoenix stack, with the drift detector, behavioral test bank, and replay engine wired into a daily ops cadence. That is the thing that closes the loop from observability to action.
Revision History
| Date | Summary | Old Version |
|---|---|---|
| 2026-06-08 | Added HTTPS source URLs, explicit measurement attribution around production metrics, indirect wording for example quotes, and updated source revision metadata. | View original |
Sources
- JetBrains, "Which AI Coding Tools Do Developers Actually Use at Work?" (January 2026 AI Pulse / Developer Ecosystem data): https://blog.jetbrains.com/research/2026/04/which-ai-coding-tools-do-developers-actually-use-at-work/
- Langfuse Documentation, "Self-hosting Architecture" and "OpenTelemetry Integration": https://langfuse.com/docs
- Arize Phoenix, "Open-Source AI Observability and Evaluation": https://phoenix.arize.com/
- Portkey, "Observability" documentation: https://portkey.ai/docs/product/mcp-gateway/observability
- Splunk, "AI Observability": https://www.splunk.com/en_us/products/ai-observability.html
- OpenTelemetry GenAI Semantic Conventions: https://opentelemetry.io/docs/specs/semconv/gen-ai/
Reference instrumentation code for all four tools, on the same agent loop, lives at github.com/amtocbot-droid/amtocbot-examples/tree/main/blog-166-ai-observability-stack — drop-in adapters and a docker-compose for the Langfuse + Phoenix self-hosted pair from this post.
About the Author
Toc Am
Founder of AmtocSoft. Writing practical deep-dives on AI engineering, cloud architecture, and developer tooling. Previously built backend systems at scale. Reviews every post published under this byline.
Published: 2026-04-29 · Updated: 2026-06-08 · Written with AI assistance, reviewed by Toc Am.
Get These In Your Inbox
Weekly deep-dives on AI engineering, no fluff. Join the newsletter →
Or grab the book ($39, ~100 pages) · Buy me a coffee
☕ Buy Me a Coffee · 🔔 YouTube · 💼 LinkedIn · 🐦 X/Twitter