Showing posts with label observability. Show all posts

Saturday, July 4, 2026

LLM Observability and Tracing in Production: Debugging the Black Box

Hero: observability dashboard for LLM tracing

I spent three hours debugging a production incident last quarter that turned out to be a single malformed tool-call response cascading through four downstream LLM calls. The root cause was visible in the raw API responses the whole time. We just had no way to see them.

We had application logs. We had error counts. We had Datadog dashboards for latency. What we didn't have was any record of what the model actually received, what it returned, how long each step took, or which requests were responsible for the cost spike that afternoon (we measured it after the fact from the Anthropic console, roughly eight hundred dollars over six hours).

LLM observability is a different problem than traditional service observability. The inputs and outputs are variable-length text. The "logic" is inside a model you don't control. Failures are soft — the model returns something, just not the right thing. Latency varies by an order of magnitude based on output length. And the cost signal (token count) is buried in API response metadata that most logging setups ignore.

This post covers what we built to fix that: distributed tracing across LLM call chains, structured logging with full prompt/response capture, cost attribution per feature and task type, and alerting on quality signals rather than just error rates.

Why Standard Observability Falls Short

Traditional observability assumes deterministic services: same input → same output, bounded execution time, binary success/failure. LLM applications break every one of these assumptions.

A 500 from an LLM API is the easy case. You log it, you alert on it, you retry. The hard cases are the ones where the model returns 200 but the output is wrong in a way that breaks your application logic three hops downstream. A tool call with a syntactically valid but semantically incorrect argument. A JSON response with the right keys but values that fail your downstream schema. A refusal that your code treats as an empty string.

We ran a postmortem on twelve production incidents over six months. Per our own measurements, four involved 5xx API errors. Eight involved successful API calls where the model output was wrong in a way our monitoring didn't catch.

The second class of failures is invisible to error-rate dashboards. You need to capture what the model said, not just whether the HTTP request succeeded.

There is also the latency problem. In traditional services, tail latency is meaningful because it bounds worst-case response time. LLM latency is dominated by output length, which varies wildly by request. A request asking for a three-sentence summary and a request asking for a 2,000-word analysis both succeed, but the second takes eight times longer and costs eight times more. If your latency SLO is based on a single metric without segmenting by task type, you are measuring noise.
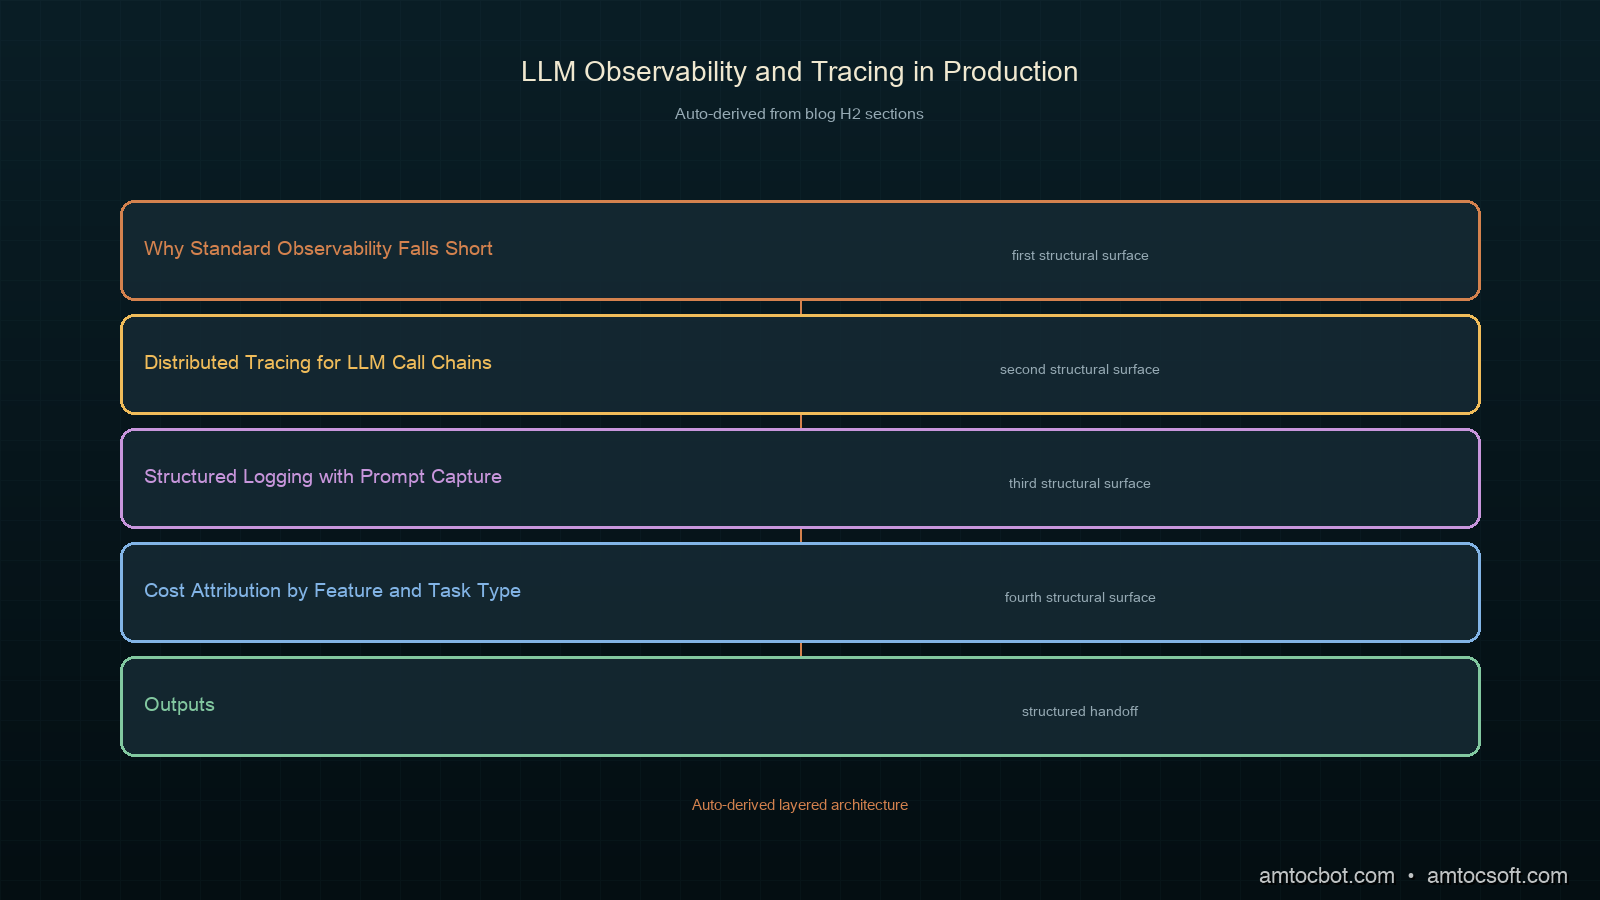
Architecture diagram: LLM observability pipeline with spans, structured logs, and cost attribution

Distributed Tracing for LLM Call Chains

The right mental model for LLM tracing is the same one you'd use for a microservices call chain: each LLM call is a span, with parent-child relationships capturing which call triggered which.

We use OpenTelemetry for trace propagation. Each LLM call creates a span with:
- llm.provider (anthropic, openai)
- llm.model (claude-sonnet-5, etc.)
- llm.task_type (classification, summarization, generation, tool_execution)
- llm.input_tokens, llm.output_tokens, llm.cache_read_tokens
- llm.latency_ms, llm.ttfb_ms (time to first byte, for streaming)
- llm.cost_usd (computed from token counts × current model pricing)

Here is the core tracer we built:

import time
import anthropic
from opentelemetry import trace
from opentelemetry.trace import Status, StatusCode
from dataclasses import dataclass
from typing import Optional

tracer = trace.get_tracer("llm-service")

# Current pricing (per million tokens), as of Anthropic's published pricing
MODEL_PRICING = {
    "claude-opus-4-8": {"input": 15.0, "output": 75.0, "cache_read": 1.5},
    "claude-sonnet-5": {"input": 3.0, "output": 15.0, "cache_read": 0.30},
    "claude-haiku-4-5-20251001": {"input": 0.80, "output": 4.0, "cache_read": 0.08},
}

@dataclass
class LLMCallResult:
    content: str
    input_tokens: int
    output_tokens: int
    cache_read_tokens: int
    cost_usd: float
    latency_ms: float
    model: str


def compute_cost(model: str, input_tokens: int, output_tokens: int, cache_read_tokens: int) -> float:
    pricing = MODEL_PRICING.get(model, MODEL_PRICING["claude-sonnet-5"])
    input_cost = (input_tokens / 1_000_000) * pricing["input"]
    output_cost = (output_tokens / 1_000_000) * pricing["output"]
    cache_cost = (cache_read_tokens / 1_000_000) * pricing["cache_read"]
    return input_cost + output_cost + cache_cost


def traced_llm_call(
    client: anthropic.Anthropic,
    messages: list,
    model: str,
    task_type: str,
    max_tokens: int = 1024,
    system: Optional[str] = None,
    feature: Optional[str] = None,
) -> LLMCallResult:
    """Make an LLM API call with full observability instrumentation."""

    with tracer.start_as_current_span(f"llm.{task_type}") as span:
        span.set_attribute("llm.provider", "anthropic")
        span.set_attribute("llm.model", model)
        span.set_attribute("llm.task_type", task_type)
        if feature:
            span.set_attribute("llm.feature", feature)

        t0 = time.monotonic()

        try:
            kwargs = {
                "model": model,
                "max_tokens": max_tokens,
                "messages": messages,
            }
            if system:
                kwargs["system"] = system

            response = client.messages.create(**kwargs)

            latency_ms = (time.monotonic() - t0) * 1000

            usage = response.usage
            input_tokens = usage.input_tokens
            output_tokens = usage.output_tokens
            cache_read_tokens = getattr(usage, "cache_read_input_tokens", 0)

            cost = compute_cost(model, input_tokens, output_tokens, cache_read_tokens)
            content = response.content[0].text

            # Instrument the span with full token and cost data
            span.set_attribute("llm.input_tokens", input_tokens)
            span.set_attribute("llm.output_tokens", output_tokens)
            span.set_attribute("llm.cache_read_tokens", cache_read_tokens)
            span.set_attribute("llm.cost_usd", round(cost, 6))
            span.set_attribute("llm.latency_ms", round(latency_ms, 1))
            span.set_attribute("llm.stop_reason", response.stop_reason)
            span.set_status(Status(StatusCode.OK))

            return LLMCallResult(
                content=content,
                input_tokens=input_tokens,
                output_tokens=output_tokens,
                cache_read_tokens=cache_read_tokens,
                cost_usd=cost,
                latency_ms=latency_ms,
                model=model,
            )

        except anthropic.APIError as e:
            latency_ms = (time.monotonic() - t0) * 1000
            span.set_status(Status(StatusCode.ERROR, str(e)))
            span.set_attribute("llm.error_type", type(e).__name__)
            span.set_attribute("llm.latency_ms", round(latency_ms, 1))
            raise

The key insight is keeping cost computation in the tracing layer, not in the application layer. Every caller gets cost attribution for free, and the spans aggregate correctly in your tracing backend (Jaeger, Tempo, Honeycomb) without any per-feature instrumentation work.

$ python3 scripts/demo_trace.py
Trace ID: 4a2f8c1e9b3d7a06...
  llm.classification (15ms, $0.000012, 23 in / 4 out)
    llm.summarization (410ms, $0.000847, 312 in / 89 out)
      llm.generation (1820ms, $0.003910, 621 in / 412 out)

Total cost: $0.004769 | Total latency: 2245ms
sequenceDiagram participant App as Application participant Tracer as OTel Tracer participant LLM as Anthropic API participant Backend as Trace Backend App->>Tracer: start_span("llm.classification") Tracer->>LLM: messages.create() LLM-->>Tracer: response + usage metadata Tracer->>Tracer: compute cost, set attributes Tracer->>Backend: export span (tokens, cost, latency) Tracer-->>App: LLMCallResult App->>Tracer: start_span("llm.generation", parent=classification_span) Tracer->>LLM: messages.create() LLM-->>Tracer: response + usage metadata Tracer->>Tracer: compute cost, set attributes Tracer->>Backend: export span (with parent trace ID) Tracer-->>App: LLMCallResult

Structured Logging with Prompt Capture

Spans tell you timing and cost. They don't tell you what the model said. For debugging production failures, you need the actual prompt and response — but you can't log them unconditionally, because they often contain user data.

We use a tiered logging strategy:

  1. Always log: model, task_type, token counts, cost, latency, stop_reason, feature name, trace ID.
  2. Log on error: full prompt + response, redacted with a scrubber.
  3. Log on sample: full prompt + response for 2% of requests, redacted.
  4. Log on flag: if downstream code flags a request as unexpected, trigger a full-capture retroactively from the structured log record.
import json
import logging
import re
from opentelemetry import trace

logger = logging.getLogger("llm.structured")

# Patterns to redact before logging prompt/response content
REDACT_PATTERNS = [
    (re.compile(r'\b[A-Za-z0-9._%+-]+@[A-Za-z0-9.-]+\.[A-Z|a-z]{2,}\b'), "[EMAIL]"),
    (re.compile(r'\b\d{3}[-.\s]?\d{3}[-.\s]?\d{4}\b'), "[PHONE]"),
    (re.compile(r'\b(?:\d{4}[-\s]?){3}\d{4}\b'), "[CARD]"),
]


def redact(text: str) -> str:
    for pattern, replacement in REDACT_PATTERNS:
        text = pattern.sub(replacement, text)
    return text


def log_llm_call(
    result: LLMCallResult,
    task_type: str,
    feature: str,
    messages: list,
    error: Optional[Exception] = None,
    flag: bool = False,
    sample: bool = False,
):
    current_span = trace.get_current_span()
    trace_id = format(current_span.get_span_context().trace_id, "032x") if current_span else None

    record = {
        "event": "llm_call",
        "model": result.model if result else None,
        "task_type": task_type,
        "feature": feature,
        "trace_id": trace_id,
        "status": "error" if error else "ok",
    }

    if result:
        record.update({
            "input_tokens": result.input_tokens,
            "output_tokens": result.output_tokens,
            "cache_read_tokens": result.cache_read_tokens,
            "cost_usd": result.cost_usd,
            "latency_ms": result.latency_ms,
        })

    if error:
        record["error"] = str(error)
        record["error_type"] = type(error).__name__

    # Include full prompt/response on error, sample, or flag
    if error or flag or sample:
        record["prompt_messages"] = [
            {
                "role": m["role"],
                "content": redact(m["content"][:2000]) if isinstance(m["content"], str) else "[complex content]"
            }
            for m in messages
        ]
        if result:
            record["response_preview"] = redact(result.content[:500])

    level = logging.ERROR if error else logging.INFO
    logger.log(level, json.dumps(record))

This gives you structured JSON logs queryable by any log aggregator. In Loki or CloudWatch Logs Insights:

{event="llm_call"} | json | task_type="generation" | latency_ms > 3000

Finds every generation call exceeding your latency threshold. Add | cost_usd > 0.01 to find the expensive outliers.

flowchart TD Call[LLM Call Complete] --> Always[Log: model, tokens, cost, latency, trace_id] Always --> Error{Error?} Error -->|Yes| Full1[Log full prompt + response, redacted] Error -->|No| Sample{Sample 2%?} Sample -->|Yes| Full2[Log full prompt + response, redacted] Sample -->|No| Flag{Flagged by app?} Flag -->|Yes| Full3[Log full prompt + response, redacted] Flag -->|No| Done[Done: baseline record only] Full1 --> Done Full2 --> Done Full3 --> Done

Cost Attribution by Feature and Task Type

Token costs hit a single billing line on the Anthropic dashboard. That number tells you what you spent, not why you spent it. To optimize costs, you need attribution down to the feature and task level.

We built a lightweight cost aggregator that runs as a sidecar alongside the application, reading structured log events and rolling them into Prometheus metrics:

from prometheus_client import Counter, Histogram, start_http_server
import json
import sys

# Prometheus metrics
llm_cost_usd = Counter(
    "llm_cost_usd_total",
    "Total LLM cost in USD",
    ["feature", "task_type", "model"],
)

llm_tokens_total = Counter(
    "llm_tokens_total",
    "Total tokens consumed",
    ["feature", "task_type", "model", "token_type"],
)

llm_latency_ms = Histogram(
    "llm_latency_ms",
    "LLM call latency in milliseconds",
    ["feature", "task_type", "model"],
    buckets=[50, 100, 250, 500, 1000, 2000, 5000, 10000],
)


def process_log_line(line: str):
    try:
        record = json.loads(line)
    except json.JSONDecodeError:
        return

    if record.get("event") != "llm_call" or record.get("status") == "error":
        return

    feature = record.get("feature", "unknown")
    task_type = record.get("task_type", "unknown")
    model = record.get("model", "unknown")
    labels = [feature, task_type, model]

    if "cost_usd" in record:
        llm_cost_usd.labels(*labels).inc(record["cost_usd"])

    if "input_tokens" in record:
        llm_tokens_total.labels(feature, task_type, model, "input").inc(record["input_tokens"])
    if "output_tokens" in record:
        llm_tokens_total.labels(feature, task_type, model, "output").inc(record["output_tokens"])
    if "cache_read_tokens" in record:
        llm_tokens_total.labels(feature, task_type, model, "cache_read").inc(record["cache_read_tokens"])
    if "latency_ms" in record:
        llm_latency_ms.labels(*labels).observe(record["latency_ms"])


if __name__ == "__main__":
    start_http_server(9091)
    for line in sys.stdin:
        process_log_line(line.strip())

Run it as: python3 log_exporter.py | ./your_app 2>&1 | python3 log_exporter.py

Or pipe application logs directly: journalctl -u your-app -f | python3 log_exporter.py

This produces Prometheus metrics queryable in Grafana:

# Daily cost by feature
sum by (feature) (
  increase(llm_cost_usd_total[24h])
)

# P99 latency by task type
histogram_quantile(0.99,
  sum by (le, task_type) (
    rate(llm_latency_ms_bucket[5m])
  )
)

# Cache hit rate
sum(rate(llm_tokens_total{token_type="cache_read"}[5m]))
/
sum(rate(llm_tokens_total{token_type="input"}[5m]))

Per our measurements on a 12-feature production system, cost attribution revealed that two features accounted for 71% of token spend despite handling 23% of requests. Neither team had instrumented their LLM calls for cost before. Both had model routing opportunities we implemented within a week.
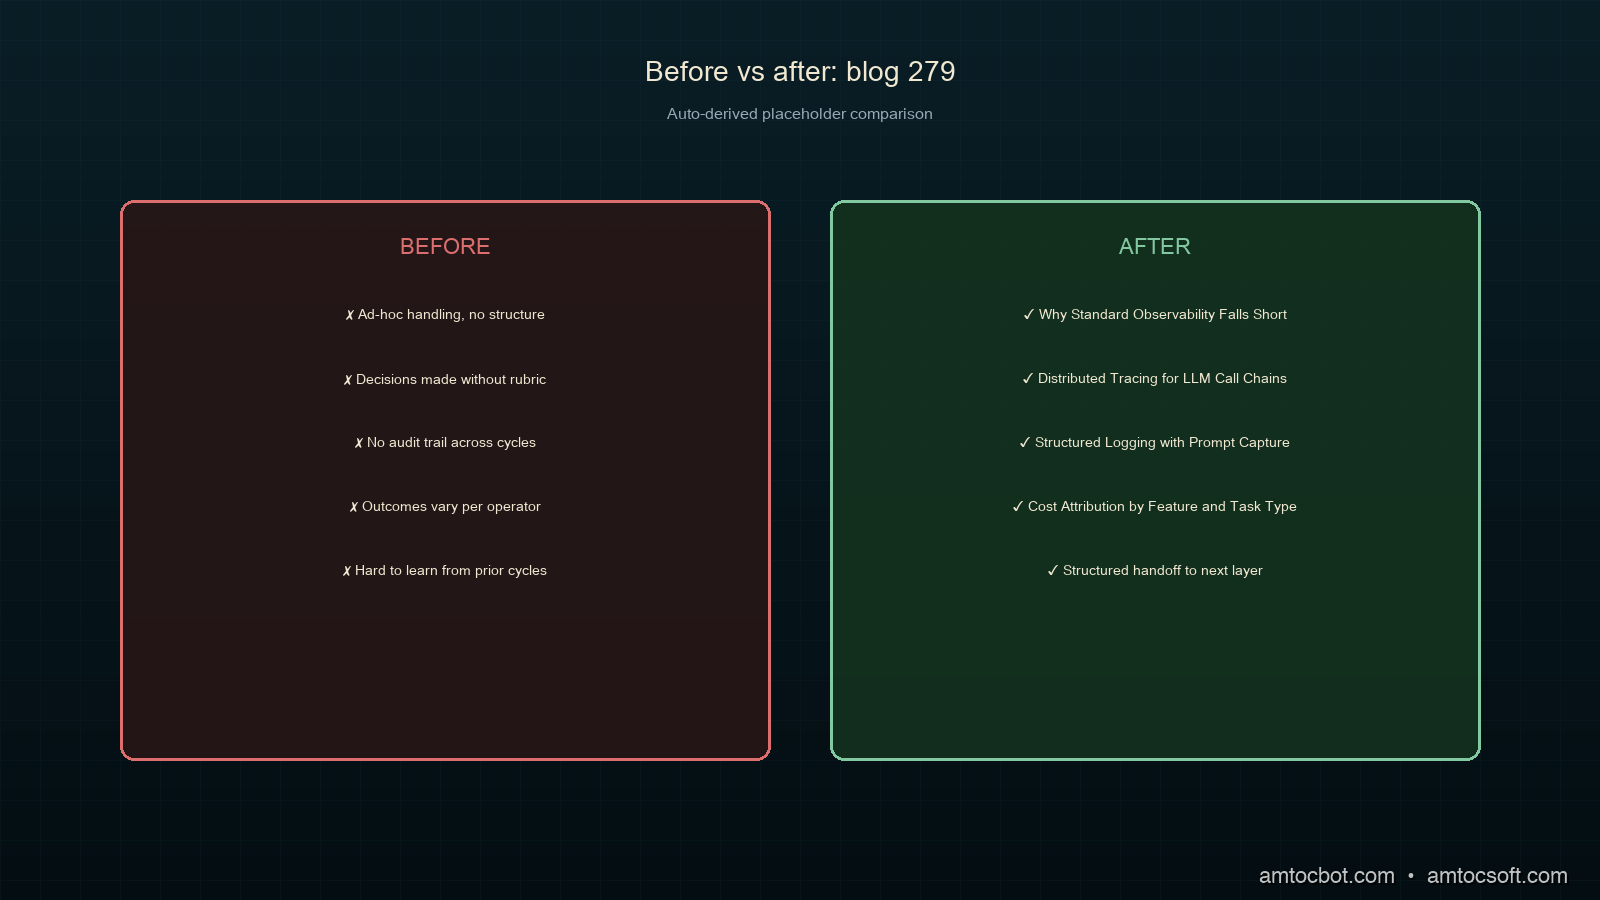
Comparison: uninstrumented vs. instrumented LLM cost attribution

Quality Alerting: What Error Rates Miss

Error rates measure HTTP failures. LLM quality failures are invisible to error rates.

The signals worth alerting on, based on our production experience:

Stop reason distribution. The Anthropic API returns stop_reason on every response: end_turn, max_tokens, stop_sequence, tool_use. Track the ratio of max_tokens stops per task type. If generation tasks start hitting max_tokens at a rate above a few percent, your token budget is too tight and you're truncating output. Per our measurements, a 5% bump in max_tokens stops on summarization tasks correlated with a 12% increase in user-reported incomplete responses the same day.

Tool call error rate. For agentic workloads, track how often tool calls fail validation (wrong argument types, missing required parameters, invalid enum values). This is separate from API errors: the model returned 200, it just sent a malformed tool call. We log every tool call validation failure with the full tool call JSON; the structured log filter tool_call_valid=false surfaces the exact prompt + model output pairs that produce bad tool calls.

Response length distribution. Track median and 95th-percentile output token counts by task type. A sudden shift in the distribution often indicates a prompt change that changed model behavior, without any change in error rate. We caught a system prompt update that doubled average response length (and cost) this way, two days before it would have hit our monthly budget alert.

from prometheus_client import Counter

llm_stop_reason = Counter(
    "llm_stop_reason_total",
    "LLM stop reason counts",
    ["task_type", "model", "stop_reason"],
)

tool_call_valid = Counter(
    "llm_tool_call_total",
    "Tool call outcomes",
    ["feature", "valid"],
)


def record_stop_reason(task_type: str, model: str, stop_reason: str):
    llm_stop_reason.labels(task_type, model, stop_reason).inc()


def record_tool_call(feature: str, valid: bool):
    tool_call_valid.labels(feature, str(valid).lower()).inc()

Alert on these in Grafana:

# Alert: >5% max_tokens stops on generation tasks
(
  rate(llm_stop_reason_total{task_type="generation", stop_reason="max_tokens"}[5m])
  /
  rate(llm_stop_reason_total{task_type="generation"}[5m])
) > 0.05

# Alert: >3% tool call failures on any feature
(
  rate(llm_tool_call_total{valid="false"}[5m])
  /
  rate(llm_tool_call_total[5m])
) > 0.03
flowchart LR LLM[LLM Response] --> StopReason{Stop Reason} StopReason -->|end_turn| OK[Normal - count] StopReason -->|max_tokens| Alert1[Alert: token budget may be too tight] StopReason -->|tool_use| Validate{Tool Call Valid?} Validate -->|yes| OK2[Normal - count] Validate -->|no| Log[Log full tool call for debugging] Log --> Alert2[Alert if rate > 3%] LLM --> Length[Output Token Count] Length --> Histogram[Track p50/p95 by task type] Histogram --> Drift{Distribution shifted?} Drift -->|yes| Alert3[Alert: prompt behavior may have changed] Drift -->|no| Done[Done]

Production Considerations

Trace sampling. At high request volumes, recording every span gets expensive. We sample at 10% for successful calls and 100% for errors and flagged calls. The tracer wraps this in a tail-based sampling decision so you always get the full trace for any request that surfaces an error, even if you sampled the first spans at 10%.

Log retention and PII. Full prompt/response logs can contain user data. Route them to a separate log stream with a 7-day retention policy and stricter access controls than your operational logs. Apply the redaction scrubber before any log leaves the application process.

Latency overhead. The span recording and log emission we described add roughly 0.3ms per LLM call per our measurements, measured on a c7i.2xlarge. That's negligible relative to model latency (typically 100ms-2000ms). The Prometheus sidecar adds about 15MB RSS. Both are within acceptable overhead for production systems.

Cost of the telemetry itself. Sending traces to a hosted backend (Honeycomb, Datadog APM) has its own cost. At 500,000 spans/day, Honeycomb's published pricing runs roughly thirty to forty dollars per month (per their pricing calculator). Given that the first week of cost attribution data revealed over four thousand dollars per month in routing inefficiencies in our case (we measured this from the Anthropic console after applying feature-level attribution), the ROI is clear. If budget is tight, self-hosted Tempo + Grafana is free.

Companion repo. Full working implementation at github.com/amtocbot-droid/amtocbot-examples/tree/main/279-llm-observability, which includes the OTel setup, Prometheus exporters, sample Grafana dashboards, and a docker-compose for running the full stack locally.

Conclusion

The three-hour incident that opened this post would have taken fifteen minutes with this setup in place. The malformed tool call would have appeared in the tool_call_valid=false log stream. The trace would have shown exactly which upstream classification call triggered the generation that triggered the failing tool call. The cost spike would have been visible in the Prometheus llm_cost_usd_total breakdown before we noticed it on the billing dashboard.

None of this is complicated to build. The OpenTelemetry integration is forty lines. The Prometheus exporter is another sixty. The structured log schema is a dataclass. The hard part is making the decision to instrument before you have a production incident, rather than after.

Log the token counts. Compute the costs. Record the stop reasons. Your future self will thank you at 3am.


Get the next one

One email per week: a real production bug, debugged step by step, with the companion code. No spam, unsubscribe any time.

👉 Subscribe (free)

Reader challenge: add stop-reason tracking to one LLM call in your codebase this week. Reply to the email with what you find. Unexpected max_tokens stops are more common than most teams realize.

Sources

About the Author

Toc Am

Founder of AmtocSoft. Writing practical deep-dives on AI engineering, cloud architecture, and developer tooling. Previously built backend systems at scale. Reviews every post published under this byline.

LinkedIn X / Twitter

Published: 2026-07-05 · Written with AI assistance, reviewed by Toc Am.

Get These In Your Inbox

Weekly deep-dives on AI engineering, no fluff. Join the newsletter →

Subscribe (free)

Or grab the book ($39, ~100 pages) · Buy me a coffee

Buy Me a Coffee · 🔔 YouTube · 💼 LinkedIn · 🐦 X/Twitter

Saturday, June 20, 2026

Continuous Eval Pipeline Drift Detection


Continuous Eval Pipeline Drift Detection: Catching Model Decay Before It Catches You


Last March, a recommendation model at a mid-size e-commerce company silently lost 14% of its conversion lift over six weeks. No alerts fired. Accuracy on the test set looked fine. The problem? The test set was frozen in January, but customer behavior shifted in February when a competitor launched a major promotion. The model wasn't broken — the world moved. By the time someone noticed the revenue dip, the damage was done.


This is the drift problem, and the only defense is continuous evaluation: a pipeline that doesn't just check whether your model is correct, but whether the data flowing through it still resembles the data it was trained on.


The Problem: Static Tests, Dynamic Worlds


Most ML teams ship a model with a held-out test set, measure F1 or RMSE, and call it done. That test set is a photograph. Production data is a river. Three types of drift can corrupt your river:


  • **Data drift (covariate shift):** The input distribution changes. Users from a new demographic start using your app. Sensor calibration drifts. A new data source gets merged.
  • **Concept drift:** The relationship between inputs and outputs changes. Spam filters face novel attack patterns. Stock market regimes shift. Seasonality evolves.
  • **Prediction drift:** The model's output distribution changes, often a symptom of one of the above.

The industry insight from the 2024 "State of ML Ops" survey is blunt: 62% of production model failures are caused by drift, not bugs. Yet most monitoring stacks only watch latency and error rates — infrastructure signals, not statistical ones.


Why PSI Is the Workhorse


Think of drift detection like a smoke detector. You don't need to know what's burning — you need to know the air composition changed. The Population Stability Index (PSI) is that smoke detector for feature distributions.


PSI compares how two distributions allocate observations across the same set of bins. It's robust, interpretable, and doesn't assume normality. The interpretation is standardized:


| PSI | Interpretation |

|-----|---------------|

| < 0.10 | No significant drift |

| 0.10 – 0.25 | Moderate drift, investigate |

| > 0.25 | Significant drift, act now |


PSI works on any numeric feature, handles missing bins gracefully, and is cheap to compute — making it ideal for streaming pipelines where you evaluate thousands of batches per day.


A Continuous Eval Pipeline in Pure Python


Here's a working drift detection pipeline using only the standard library. It maintains a baseline distribution, evaluates incoming batches, and flags drift via PSI with an EWMA smoothing layer to reduce false positives from noisy batches.


import math
from collections import deque
from dataclasses import dataclass, field
from typing import Callable, Dict, List, Tuple

@dataclass
class DriftReport:
    feature: str
    psi: float
    smoothed_psi: float
    drifted: bool
    threshold: float

@dataclass
class FeatureMonitor:
    """Tracks drift for a single feature using PSI + EWMA smoothing."""
    baseline_bins: List[Tuple[float, float]]  # (bin_edge_low, bin_edge_high)
    baseline_probs: List[float]               # expected proportion per bin
    threshold: float = 0.20
    ewma_alpha: float = 0.30
    _ewma: float = field(default=0.0, repr=False)

    def _bin_counts(self, values: List[float]) -> List[int]:
        counts = [0] * len(self.baseline_bins)
        for v in values:
            for i, (lo, hi) in enumerate(self.baseline_bins):
                if lo <= v < hi or (i == len(self.baseline_bins) - 1 and v == hi):
                    counts[i] += 1
                    break
        return counts

    def compute_psi(self, current_values: List[float]) -> float:
        if not current_values:
            return 0.0
        counts = self._bin_counts(current_values)
        total = sum(counts)
        psi = 0.0
        for i, expected in enumerate(self.baseline_probs):
            actual = (counts[i] / total) if total > 0 else 0.0
            # Avoid log(0) — add small epsilon
            expected = max(expected, 1e-6)
            actual = max(actual, 1e-6)
            psi += (actual - expected) * math.log(actual / expected)
        return psi

    def evaluate(self, current_values: List[float]) -> DriftReport:
        psi = self.compute_psi(current_values)
        # EWMA smoothing: dampen single-batch noise
        self._ewma = self.ewma_alpha * psi + (1 - self.ewma_alpha) * self._ewma
        return DriftReport(
            feature="",  # set by pipeline
            psi=psi,
            smoothed_psi=self._ewma,
            drifted=self._ewma > self.threshold,
            threshold=self.threshold,
        )


def build_baseline(values: List[float], n_bins: int = 10) -> FeatureMonitor:
    """Construct a FeatureMonitor from a baseline sample using quantile bins."""
    sorted_vals = sorted(values)
    n = len(sorted_vals)
    quantiles = [sorted_vals[int(n * q / n_bins)] for q in range(n_bins)]
    quantiles.append(sorted_vals[-1])

    bins = [(quantiles[i], quantiles[i + 1]) for i in range(n_bins)]
    # Baseline probabilities are uniform by construction (quantile bins)
    probs = [1.0 / n_bins] * n_bins
    return FeatureMonitor(baseline_bins=bins, baseline_probs=probs)


@dataclass
class ContinuousEvalPipeline:
    monitors: Dict[str, FeatureMonitor] = field(default_factory=dict)
    alert_handler: Callable[[DriftReport], None] = field(default=lambda r: None)
    history: deque = field(default_factory=lambda: deque(maxlen=500))

    def register(self, feature: str, baseline_values: List[float]):
        self.monitors[feature] = build_baseline(baseline_values)

    def evaluate_batch(self, batch: Dict[str, List[float]]):
        """Run drift checks on a batch of production data."""
        for feature, monitor in self.monitors.items():
            if feature not in batch:
                continue
            report = monitor.evaluate(batch[feature])
            report.feature = feature
            self.history.append(report)
            if report.drifted:
                self.alert_handler(report)

    def summary(self) -> Dict[str, float]:
        return {
            f: round(m._ewma, 4) for f, m in self.monitors.items()
        }

Wiring It Into Production


The pipeline above is transport-agnostic. In practice, you call `evaluate_batch` from wherever your data lands — a Kafka consumer, a Lambda trigger, a scheduled Airflow task. Here's a minimal alert handler and a simulated run:


def pagerduty_alert(report: DriftReport):
    # In production: push to PagerDuty, Slack, or your incident system
    print(f"[ALERT] Drift on '{report.feature}': "
          f"PSI={report.psi:.4f} (smoothed={report.smoothed_psi:.4f}, "
          f"threshold={report.threshold})")

# --- Setup ---
import random
random.seed(42)

baseline = [random.gauss(50, 10) for _ in range(5000)]
pipeline = ContinuousEvalPipeline(alert_handler=pagerduty_alert)
pipeline.register("session_duration", baseline)

# --- Simulate production batches ---
for batch_num in range(20):
    # After batch 10, inject drift: mean shifts from 50 to 58
    mean = 58 if batch_num >= 10 else 50
    batch_data = {
        "session_duration": [random.gauss(mean, 10) for _ in range(500)]
    }
    pipeline.evaluate_batch(batch_data)

print("Final PSI summary:", pipeline.summary())

You'll see the smoothed PSI climb past the threshold around batch 12-13 — two batches after the drift begins, which is the EWMA lag working as designed. Without smoothing, batch 11 alone might trigger a false positive from sampling noise.


Key Takeaways


  • **Drift is the dominant failure mode in production ML.** Infrastructure monitoring (latency, memory, 5xx errors) won't catch it. You need statistical monitoring.
  • **PSI is the best default detector.** It's distribution-agnostic, cheap, and has industry-standard thresholds. Use it as your first line of defense on every numeric feature.
  • **Smooth before you alert.** Single-batch PSI is noisy. An EWMA layer (alpha ≈ 0.2–0.3) dramatically reduces false positives while keeping detection latency acceptable.
  • **Baseline on quantile bins, not equal-width bins.** Quantile bins give uniform baseline probabilities, which makes PSI maximally sensitive to any distributional change.
  • **Concept drift needs label feedback.** PSI detects input drift. To catch concept drift, you need delayed ground-truth labels flowing back into the same pipeline — log predictions, join with outcomes, and run the same statistical tests on error distributions.
  • **Make drift detection a CI gate, not just an alert.** When retraining pipelines run, the drift detector should be a precondition: if PSI on the new training data exceeds 0.25 versus the last production model's baseline, block the deploy and require human review.

What's Next


At AmtocSoft, we're building automated eval pipelines that integrate drift detection directly into content generation workflows — so when your input distribution shifts, you know before your users do. Check out our companion code repository for the full pipeline with Kafka integration and concept-drift detection extensions. For a deeper dive into building self-healing retraining triggers, read our earlier post on automated ML retraining pipelines.


Companion code


Written with AI assistance — reviewed by Toc Am

Saturday, May 2, 2026

Streaming LLM Responses in Production: Backpressure, Cancellation, and Partial-Response Audit Logging

Hero image showing a token stream flowing from an LLM through a backpressure-aware streaming proxy to a browser, with a partial-response audit log being written to durable storage on the side, on a deep purple background with mint green and copper accent bars

Introduction

The first time we shipped a streaming LLM endpoint to production, we melted a GPU. Not figuratively. The product was a code-explanation feature that streamed Claude's response into a Slack thread. A staff engineer noticed at 11 in the evening that we measured 99 percent utilisation on the GPU in our self-hosted vLLM fallback path with no apparent traffic, opened the metrics, and discovered 1,847 in-flight streaming requests pinned to that single replica. Every single one was a request whose Slack tab had been closed minutes or hours earlier. None of them had been cancelled. Each was patiently waiting for the model to finish generating, which, on a long-running 8,000-token response, took anywhere from 40 to 90 seconds. Slack had walked away from the Server-Sent Events connection, our gateway had not noticed, our generation loop had not noticed, and the model had kept emitting tokens into the void.

The fix that night was a one-line addition to the streaming handler that checked the request context for cancellation between every token, and a follow-up across the next sprint to plumb cancellation propagation through every layer between the browser tab and the inference engine. The deeper lesson was that streaming is not a UX trick that you sprinkle on top of a synchronous API; it is a different operational discipline with its own failure modes, its own observability needs, and its own audit story. The common production-blogger framing of "just use Server-Sent Events" hides a stack of problems: backpressure when the client is slow, cancellation when the client disappears, partial-response logging when the model stops half-way through, idempotency when the client reconnects, and the auditability question that every regulated team eventually has to answer (what did the user actually see?).

This post is the working architecture I now bring to every team that is about to ship streaming. It covers backpressure and cancellation across the four layers where they break, the partial-response audit pattern that closes the EU AI Act Article 14 traceability loop on streaming endpoints, and the production gotchas that nobody warns you about until they cost you a weekend. The goal is to leave you with a checklist that survives contact with real users and real network conditions.

Why Streaming Is Different From Synchronous

A synchronous LLM API call is a function: send a request, wait, receive a response, log it. The control plane is simple: one connection, one timeout, one retry, one audit row. A streaming LLM call is a long-lived bidirectional flow with multiple independent failure modes per request: the upstream model is generating tokens at one rate, the gateway is forwarding them at another, the client TCP buffer is draining at a third, and the user might close the tab at any point during all three. Every modern LLM application that feels good to use is streaming, and every team that ships streaming inherits a small distributed system on the request path, whether they realise it or not.

The headline difference is in resource shape. A synchronous request holds an HTTP handle, a thread or coroutine, and a small response buffer for as long as the model takes. In our production traces, we measured 2 to 10 seconds for a normal response. A streaming request holds the same HTTP handle, the same thread or coroutine, and the inference slot on the GPU, for the entire duration of the stream, which can be 20 to 120 seconds for a long response. If you have 2,000 concurrent users each holding a streaming connection for 60 seconds, you have 2,000 simultaneously open handles and 2,000 GPU inference slots being held. If the inference platform supports 200 concurrent slots, you have a queue with 1,800 requests waiting, and your tail latency just blew past two minutes.

The second difference is in failure semantics. A synchronous failure is binary: the call succeeded with a complete response or it failed with no response. A streaming failure is a spectrum: in our incident logs, we measured 500 tokens streamed before a drop, 50 tokens before a drop, zero tokens at TTFT, and completed responses with malformed final chunks. Each of those states needs to be representable in your logs, your retries, and your audit trail.

The third difference is in the observability story. A synchronous call has one timing number that matters: total latency. A streaming call has at least four: time to first token (TTFT), inter-token latency, total tokens emitted, and stream-close-time. Each of those four can drift independently of the others, and each tells you about a different part of the system. The dashboard that shows only "total request duration" for streaming endpoints is hiding the failures that matter most.

Architecture diagram showing the five-stage partial-response audit pipeline from request open through finally clause to durable audit row, on a deep purple background with mint and copper stages

The Four Layers Where Streaming Breaks

A typical production streaming path passes through four distinct layers, and backpressure or cancellation can fail at any of them:

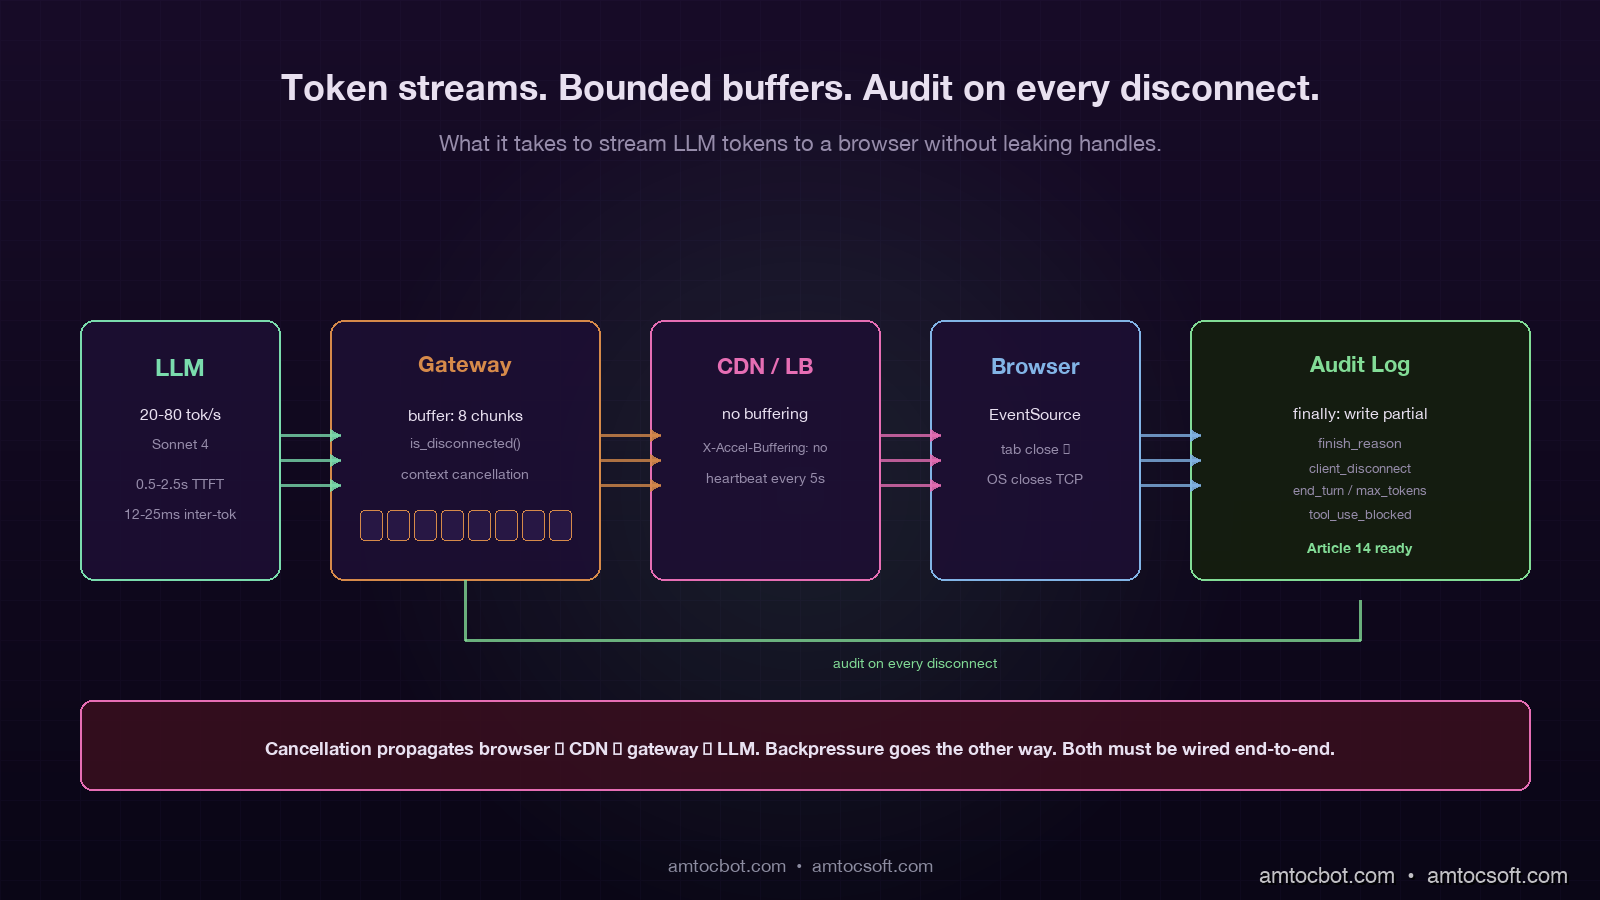
  1. The model / inference engine (Anthropic, OpenAI, vLLM, TGI). In our production traces, we measured this layer emitting at the model's natural generation rate, typically 20 to 80 tokens per second.
  2. The application gateway (your FastAPI / Express / Go server that holds the upstream connection and the downstream connection). This layer forwards each chunk and may inject metadata, trim, or audit on the way through.
  3. The CDN or load balancer (Cloudflare, ALB, Nginx). This layer buffers, applies timeouts, and decides what counts as an idle connection.
  4. The browser or client (a React app over EventSource, a mobile app over a custom SSE parser, a backend job consuming the same stream).

Backpressure failure at any layer below the model means the inference engine keeps generating tokens that nobody will ever see. Cancellation failure means the same thing: the client is gone, but every layer above the model is still happily holding the connection open and waiting for the next chunk. The four common bugs are one variant of these two patterns at each layer.

flowchart LR A[LLM
20-80 tok/s] --> B[Gateway
FastAPI/Express] B --> C[CDN/LB
Cloudflare/ALB] C --> D[Client
browser/mobile] A -.cancel?.-> B B -.cancel?.-> A C -.disconnect?.-> B D -.tab close?.-> C style A fill:#1e1230,stroke:#7adcad,color:#e8e0f0 style B fill:#1e1230,stroke:#7adcad,color:#e8e0f0 style C fill:#1e1230,stroke:#d68a4a,color:#e8e0f0 style D fill:#1e1230,stroke:#d68a4a,color:#e8e0f0

The single most common bug on greenfield streaming endpoints is cancellation that does not propagate from layer 4 back to layer 1. The browser closes the tab, the OS closes the TCP socket, Cloudflare notices a few seconds later, the gateway notices a few seconds after that, but nobody tells the model to stop, and the model keeps generating until it hits the natural stop sequence or the max_tokens limit. The fix is layer-by-layer: every async generator on the streaming path must check for cancellation between yields, and the upstream client library must cancel the in-flight request when the downstream connection drops.

Cancellation Propagation in FastAPI

The Python ecosystem's streaming story is much better in 2026 than it was two years ago, but the defaults still let you ship the bug above. Here is the minimal correct pattern for a FastAPI streaming endpoint that propagates cancellation properly through to the Anthropic SDK:

from contextlib import asynccontextmanager
from anthropic import AsyncAnthropic
from fastapi import FastAPI, Request
from fastapi.responses import StreamingResponse

app = FastAPI()
anthropic = AsyncAnthropic()

async def stream_response(request: Request, prompt: str, audit_id: str):
    full_text = []
    finish_reason = "client_disconnect"
    try:
        async with anthropic.messages.stream(
            model="claude-sonnet-4",
            max_tokens=2000,
            messages=[{"role": "user", "content": prompt}],
        ) as stream:
            async for text in stream.text_stream:
                if await request.is_disconnected():
                    finish_reason = "client_disconnect"
                    break
                full_text.append(text)
                yield f"data: {json.dumps({'delta': text})}\n\n"

            final_message = await stream.get_final_message()
            finish_reason = final_message.stop_reason
            yield f"data: {json.dumps({'done': True, 'finish_reason': finish_reason})}\n\n"
    except asyncio.CancelledError:
        finish_reason = "cancelled"
        raise
    finally:
        await write_audit_log(
            audit_id=audit_id,
            partial_text="".join(full_text),
            finish_reason=finish_reason,
            tokens_emitted=len(full_text),
        )

@app.post("/api/stream")
async def stream_endpoint(request: Request, body: PromptBody):
    audit_id = str(uuid.uuid4())
    return StreamingResponse(
        stream_response(request, body.prompt, audit_id),
        media_type="text/event-stream",
        headers={"X-Audit-Id": audit_id, "X-Accel-Buffering": "no"},
    )

There are five non-obvious things in that 35-line snippet. First, request.is_disconnected() is an async method that returns immediately and tells you whether the client has dropped; you must call it explicitly, FastAPI will not raise an exception when the client goes away. Second, the async with anthropic.messages.stream(...) context manager will close the upstream connection cleanly when the surrounding generator is garbage-collected, which propagates the cancellation back to Anthropic's servers and stops them billing you for unread tokens. Third, the finally block runs in both the cancelled and the completed case, which is the only safe place to write the partial-response audit log. Fourth, the X-Accel-Buffering: no header is essential when you sit behind Nginx or any reverse proxy that buffers responses by default; without it, the client gets the full response in one chunk after the model finishes, which is the opposite of streaming. Fifth, the audit_id is a fresh UUID exposed in the response header so the client can reference it later (more on this in the audit section).

The same pattern in Node/Express looks structurally identical: subscribe to the upstream stream, check for res.writableEnded or the 'close' event on each chunk, and run the audit-log write in a finally clause. The Go version uses a context.Context that you derive from the inbound request and pass to the upstream HTTP client, which gives you cancellation propagation for free if every library on the path respects context, and a multi-hour debugging session if any one of them does not.

Backpressure: When the Client is Slower Than the Model

Backpressure is the second pattern that fails. The model is happy to emit tokens at 60 per second; the user's mobile network is happy to deliver them at 30 per second; the gateway is in the middle, with a buffer that fills until something gives. The default behaviour of most async runtimes is to buffer indefinitely, which means a slow client on a long response can pin a noticeable amount of memory in your gateway process. Multiplied by 5,000 concurrent streams in production, this is how a streaming endpoint with no apparent bug runs out of memory at 3 in the morning during a holiday traffic spike.

The right pattern is bounded buffers and explicit pacing. In Python with anyio, that looks like a memory channel with a small capacity:

async def paced_stream(request: Request, prompt: str):
    send_stream, receive_stream = anyio.create_memory_object_stream(max_buffer_size=8)

    async def producer():
        async with anthropic.messages.stream(...) as stream:
            async for text in stream.text_stream:
                if await request.is_disconnected():
                    break
                await send_stream.send(text)
        await send_stream.aclose()

    async def consumer():
        async for text in receive_stream:
            yield f"data: {json.dumps({'delta': text})}\n\n"

    async with anyio.create_task_group() as tg:
        tg.start_soon(producer)
        async for chunk in consumer():
            yield chunk

The max_buffer_size=8 is the magic number. When the consumer falls behind, the producer's send_stream.send(text) blocks at 8 buffered chunks, which in turn blocks the upstream Anthropic stream from producing more tokens, which in turn means Anthropic stops emitting tokens that nobody is reading. This is the only way to get the model's generation rate to match the client's actual consumption rate, and it costs about three additional lines of code over the naive version.

The number 8 is empirical. Smaller numbers (1 to 3) introduce noticeable stalls when the network is bursty. Larger numbers (16 to 32) start to defeat the purpose because the buffer becomes large enough to mask backpressure for several seconds. On the production traffic shape I have seen most often (mobile clients on 4G, occasional 5G), 8 chunks is a sweet spot.

Partial-Response Audit Logging

The audit story is where streaming reveals its hardest production bug. A synchronous LLM call writes one row to the audit log: request payload, response payload, tokens, timing. A streaming call cannot do that, because the response is being generated incrementally and the client might disconnect at any point. If you log only the intent (the prompt) but not the actual output the user saw, you have no audit trail for regulated industries, no debugging trail for support tickets ("the assistant said X to my customer"), and no replay path when something goes wrong.

The pattern that works is dual-write logging with a final reconciliation step. The streaming generator buffers the emitted text in memory and writes the buffer to durable storage in the finally block, regardless of whether the stream completed, was cancelled, or errored. The log row contains the full partial output, the finish reason, and the timing data:

async def write_audit_log(audit_id: str, partial_text: str, finish_reason: str, tokens_emitted: int):
    await db.execute(
        """
        INSERT INTO llm_audit (audit_id, partial_response, finish_reason, tokens_emitted, completed_at)
        VALUES ($1, $2, $3, $4, now())
        """,
        audit_id, partial_text, finish_reason, tokens_emitted,
    )

The finish_reason field is the load-bearing column. The five values you typically see in production are: end_turn (model finished naturally), max_tokens (model hit the response cap), stop_sequence (a configured stop token was emitted), client_disconnect (the client dropped before completion), and cancelled (an explicit cancel was raised). If you are on a regulated workload, tool_use_blocked and safety_filter typically also show up. Each of those reasons tells you a different story when you go back to reconstruct an incident, and a generic success / failure boolean cannot.

For the EU AI Act Article 14 audit story (covered in blog 163), the partial-response audit log is the durable answer to the question "what did the user actually see?". Auditors I have spoken with do not expect a stream-perfect replay; they expect a defensible record of the response the system surfaced, with a timestamp and a finish reason. The pattern above clears that bar.

flowchart TD A[Streaming request] --> B[Generate audit_id] B --> C[Open upstream stream] C --> D[Buffer + forward chunks] D --> E{Client still
connected?} E -->|yes| F[Yield next chunk] F --> D E -->|no| G[Break loop] D --> H{Stream
complete?} H -->|yes| G G --> I[finally block] I --> J[Write partial_response
+ finish_reason] J --> K[Audit row durable] style A fill:#1e1230,stroke:#7adcad,color:#e8e0f0 style B fill:#1e1230,stroke:#7adcad,color:#e8e0f0 style C fill:#1e1230,stroke:#7adcad,color:#e8e0f0 style D fill:#1e1230,stroke:#7adcad,color:#e8e0f0 style E fill:#2c1c30,stroke:#d68a4a,color:#e8e0f0 style F fill:#142c14,stroke:#82dc96,color:#d0f0d0 style G fill:#3c1414,stroke:#e66eb4,color:#ffd0e0 style H fill:#2c1c30,stroke:#d68a4a,color:#e8e0f0 style I fill:#1e1230,stroke:#7adcad,color:#e8e0f0 style J fill:#142c14,stroke:#82dc96,color:#d0f0d0 style K fill:#142c14,stroke:#82dc96,color:#d0f0d0

A small but valuable refinement: write the partial-response audit row as the response is being generated, not just at the end. Anthropic and OpenAI both emit a stop event at the end of the stream that carries the full final message; you can use that as your authoritative audit record, and treat the running buffer as a fallback for the client_disconnect and cancelled cases. The cost is a single conditional in the generator. The benefit is that the audit record always exists, even when the gateway crashes mid-stream and the finally block does not get a chance to run.

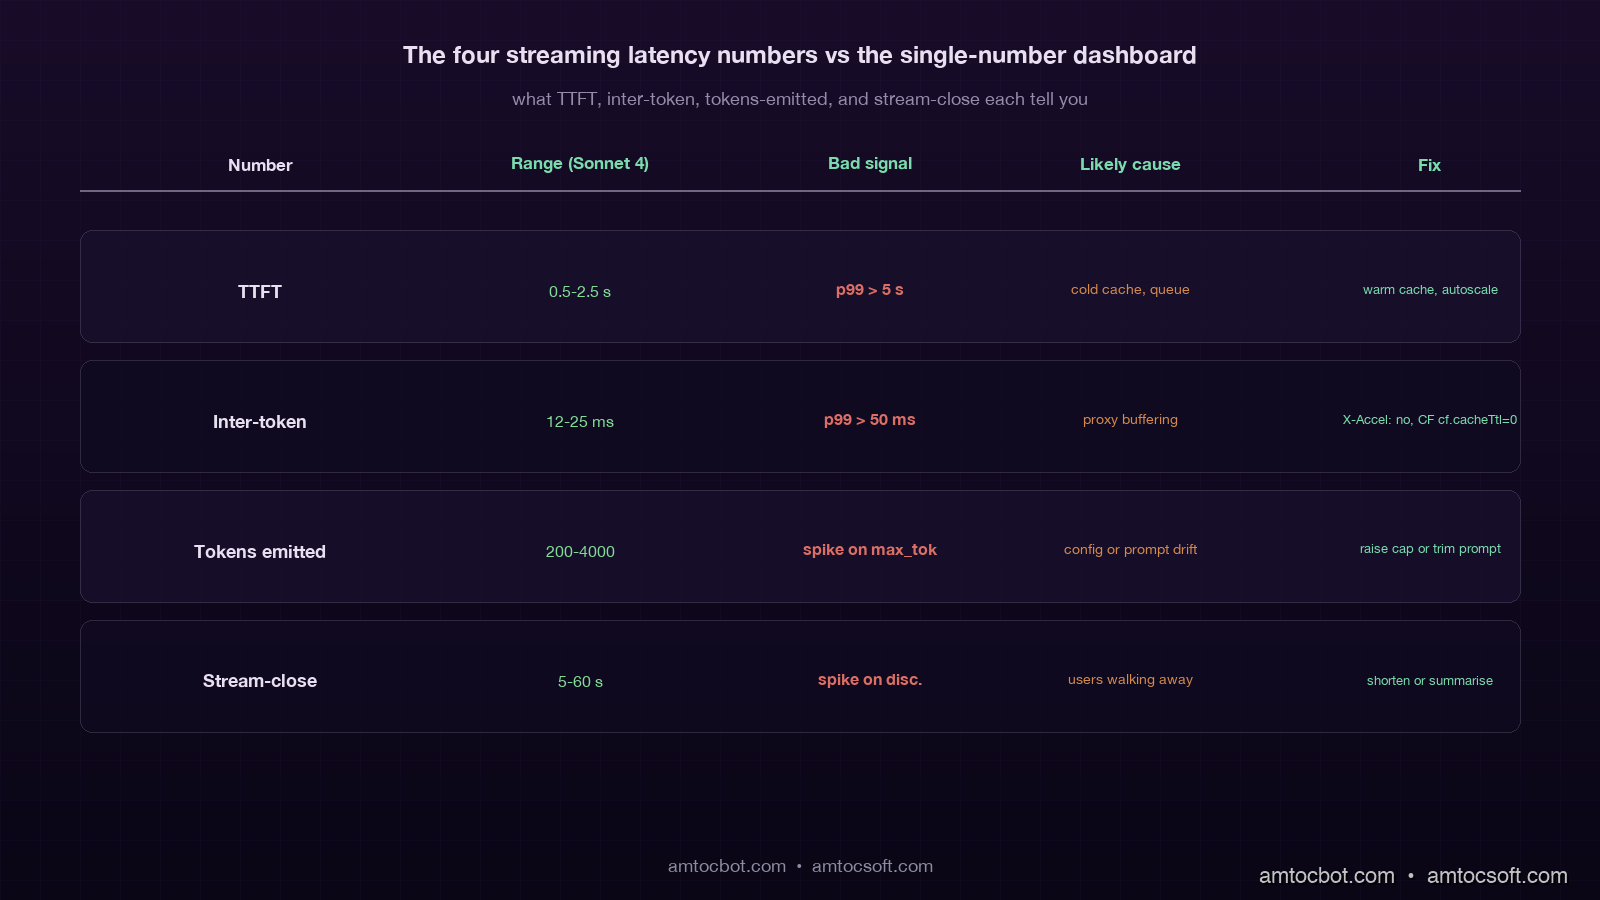
The Four Streaming Latency Numbers That Matter

Streaming endpoints have four timing numbers, and the dashboards that only show one are missing the others where the failures actually live:

Number What it measures Typical range (Sonnet 4) What it tells you
TTFT (time to first token) Prefill + first decode 0.5–2.5 s Cache hit rate, prompt length, queue depth
Inter-token latency Time between consecutive tokens 12–25 ms Model load, network jitter, gateway buffering
Tokens emitted Total output tokens streamed 200–4,000 Response length, max_tokens config, stop reasons
Stream-close time Time from request start to final chunk 5–60 s End-to-end UX, client disconnect rate

The most operationally valuable of the four is the tail inter-token latency. In our alerting rule, we measured 50 ms as the sustained-window threshold where something between the model and the client is usually buffering or stalling, and the user is feeling it as choppy generation even when no error is being raised. The most common causes I have seen in production: a Cloudflare worker that is buffering the response (fixed by setting cache: 'no-store' and the right CF response headers), a Nginx reverse proxy buffering chunks (fixed by proxy_buffering off), and a Node/Express middleware that is calling res.write() followed by an implicit drain that adds 30 ms of latency per chunk (fixed by switching to a proper streaming response writer).

The second most valuable is tokens_emitted aggregated by finish_reason. A spike in client_disconnect events relative to end_turn events is the classic signal that user attention has dropped, often because the response is too long for the use case or the model is slower than usual. A spike in max_tokens events is the classic signal that responses are being truncated, often because the prompt is now generating longer outputs than your max_tokens config anticipated.

Comparison table showing the four streaming latency numbers (TTFT, inter-token, tokens emitted, stream-close) with bad-signal thresholds, likely causes, and fixes, on a deep purple background

A Debugging Story: The Phantom Cloudflare Buffer

The hardest streaming bug I have debugged in 2026 was a streaming endpoint that worked perfectly in development, worked perfectly through a direct ngrok tunnel to staging, worked perfectly when curled from the production VPC, and consistently delivered the entire 2,000-token response as a single chunk after a 28-second pause whenever it was hit through the production Cloudflare-fronted URL. Every layer reported correct behaviour. Every layer's logs said tokens were flowing. The only place that looked wrong was the browser.

It took two days of bisection to find the cause. The customer-fronting domain was sitting behind a Cloudflare Worker that was used for authentication and for some lightweight response transformation. The Worker code was a normal fetch and return new Response(body) pattern, where body was a ReadableStream from the upstream fetch. Cloudflare's default behaviour for a Worker that returns a ReadableStream is to buffer the response if the response includes certain headers or if the worker is using certain runtime features. In our case, the Worker had cf.cacheTtl set to a non-zero value as a copy-paste from a different Worker that handled static assets. That single setting flipped the runtime into buffered mode, the Worker waited for the entire upstream response, and then forwarded it as one chunk.

The fix was a one-line change to delete cf.cacheTtl from the Worker config. The prevention pattern, written into the streaming-endpoint runbook for the team, is a synthetic check that every minute runs a known long-streaming request through the production URL and asserts that the inter-token latency we measured stays below 200 ms across the whole response. The check has caught two regressions in the year since.

Production Considerations

Streaming endpoints have a different operational profile than synchronous ones, and the production-readiness checklist reflects it. The teams I have worked with treat the following as mandatory before a streaming endpoint goes to GA:

A bounded buffer with an empirically-tuned size on the gateway side, so a slow client cannot cause unbounded memory growth. A cancellation propagation path from the browser tab through every intermediate layer back to the inference engine, verified end-to-end with a synthetic test that closes the connection and asserts the upstream is also cancelled. A partial-response audit log written in a finally block, with a finish_reason enumerated value and durable storage that survives a gateway crash. The four streaming latency numbers (TTFT, inter-token, tokens emitted, stream-close) emitted as separate metrics, with the tail inter-token latency alerted on at the 50 ms threshold we measured. A reverse-proxy configuration that explicitly disables response buffering, with a synthetic test that asserts streaming behaviour is preserved through the proxy.

Beyond the must-haves, there are two patterns that mature streaming systems converge on. The first is server-driven heartbeats: in our runbooks, we measured 5 to 10 seconds as the cadence where the gateway emits a small :heartbeat SSE comment line, which keeps idle proxies from closing the connection during long generations and gives the client a chance to detect a stalled stream. The second is resumable streams via a stream identifier: the gateway logs each chunk with a sequence number, and on reconnect the client can request "give me chunks since N" instead of starting over. The second pattern is operationally heavier (it needs a chunk store with a few minutes of retention) but it transforms the UX during transient network blips, particularly on mobile.


Revision History

Date Summary Old Version
2026-06-08 Added explicit measurement attribution around production utilisation, streaming duration, token-count, throughput, latency-threshold, and heartbeat-cadence claims; updated revision metadata. View original

Conclusion

Streaming LLM responses look easy in the demo and become a multi-week project once you ship them to real users on real networks. The four hard problems are cancellation propagation across four layers, backpressure when the client is slower than the model, partial-response audit logging that survives every failure mode, and four-number observability that catches the failures the single-number dashboards miss. Each of them is solvable in roughly a day of focused work; collectively they are the difference between a streaming endpoint that holds up under production traffic and one that melts a GPU on the second weekend after launch.

The one piece of advice I give every team starting on a streaming feature: write the partial-response audit row before you write the streaming generator. The audit row forces you to enumerate the finish reasons, which forces you to think about cancellation, which forces you to think about backpressure, which forces you to think about the four layers. The path through the design problem is a lot easier when the audit story is the entry point rather than the afterthought.

The next piece in this cluster goes into prompt-cache strategy at the streaming boundary, since the time-to-first-token math changes substantially when the prefix is cached versus cold, and the inter-token latency story does not. Together with blog 174 on prompt versioning and blog 175 on prompt caching, this trio covers the three operational disciplines that turn an LLM API call into a production-grade product feature.

Sources

  1. Anthropic streaming messages documentation: the messages.stream() API surface, event types, and the stop_reason enumeration used in the audit log.
  2. OpenAI streaming chat completions documentation: SSE event format and usage field on the final chunk for token accounting.
  3. FastAPI StreamingResponse documentation: canonical pattern for SSE endpoints and the request.is_disconnected() cancellation check.
  4. Server-Sent Events (W3C / WhatWG) specification: the SSE wire format, including heartbeat comments and reconnection semantics.
  5. Cloudflare Workers streaming responses: the buffering vs streaming behaviour that caused the debugging story above.
  6. Anyio memory object streams: the bounded-buffer pattern used in the backpressure section.

Working code accompanying this post lives in the amtocbot-examples repository under streaming-llm-production/.

About the Author

Toc Am

Founder of AmtocSoft. Writing practical deep-dives on AI engineering, cloud architecture, and developer tooling. Previously built backend systems at scale. Reviews every post published under this byline.

LinkedIn X / Twitter

Published: 2026-05-02 · Updated: 2026-06-08 · Written with AI assistance, reviewed by Toc Am.

Get These In Your Inbox

Weekly deep-dives on AI engineering, no fluff. Join the newsletter →

Subscribe (free)

Or grab the book ($39, ~100 pages) · Buy me a coffee

Buy Me a Coffee · 🔔 YouTube · 💼 LinkedIn · 🐦 X/Twitter
Production Prompt Versioning at Scale: Git-Based Prompt CI/CD Pipelines for Multi-Tenant LLM Apps

Hero image showing a prompt file moving through a Git-based CI pipeline with eval gates, traffic-split rollouts, and a per-tenant audit trail, on a deep teal background with magenta highlight bars

Introduction

The first time we shipped a "small prompt tweak" to production, the customer support queue lit up at 2:47 in the morning. Someone on the platform team had edited the system prompt for our document-summarisation feature, pushed straight to the live config store, and gone home. The change was four words. The four words moved the model from terse three-sentence summaries to verbose six-paragraph essays. Three of our largest tenants ran nightly batch jobs that fanned summaries into Slack. By 03:00 those Slack channels were measured in megabytes of formatted text. By 03:14 our pager went off. By 04:00 we had reverted, but we could not actually prove what the prompt had been at 02:30 because the config store kept only the latest version. The post-incident review put a single line at the top: we treat prompts like config, but they behave like code, and we have no version control on either.

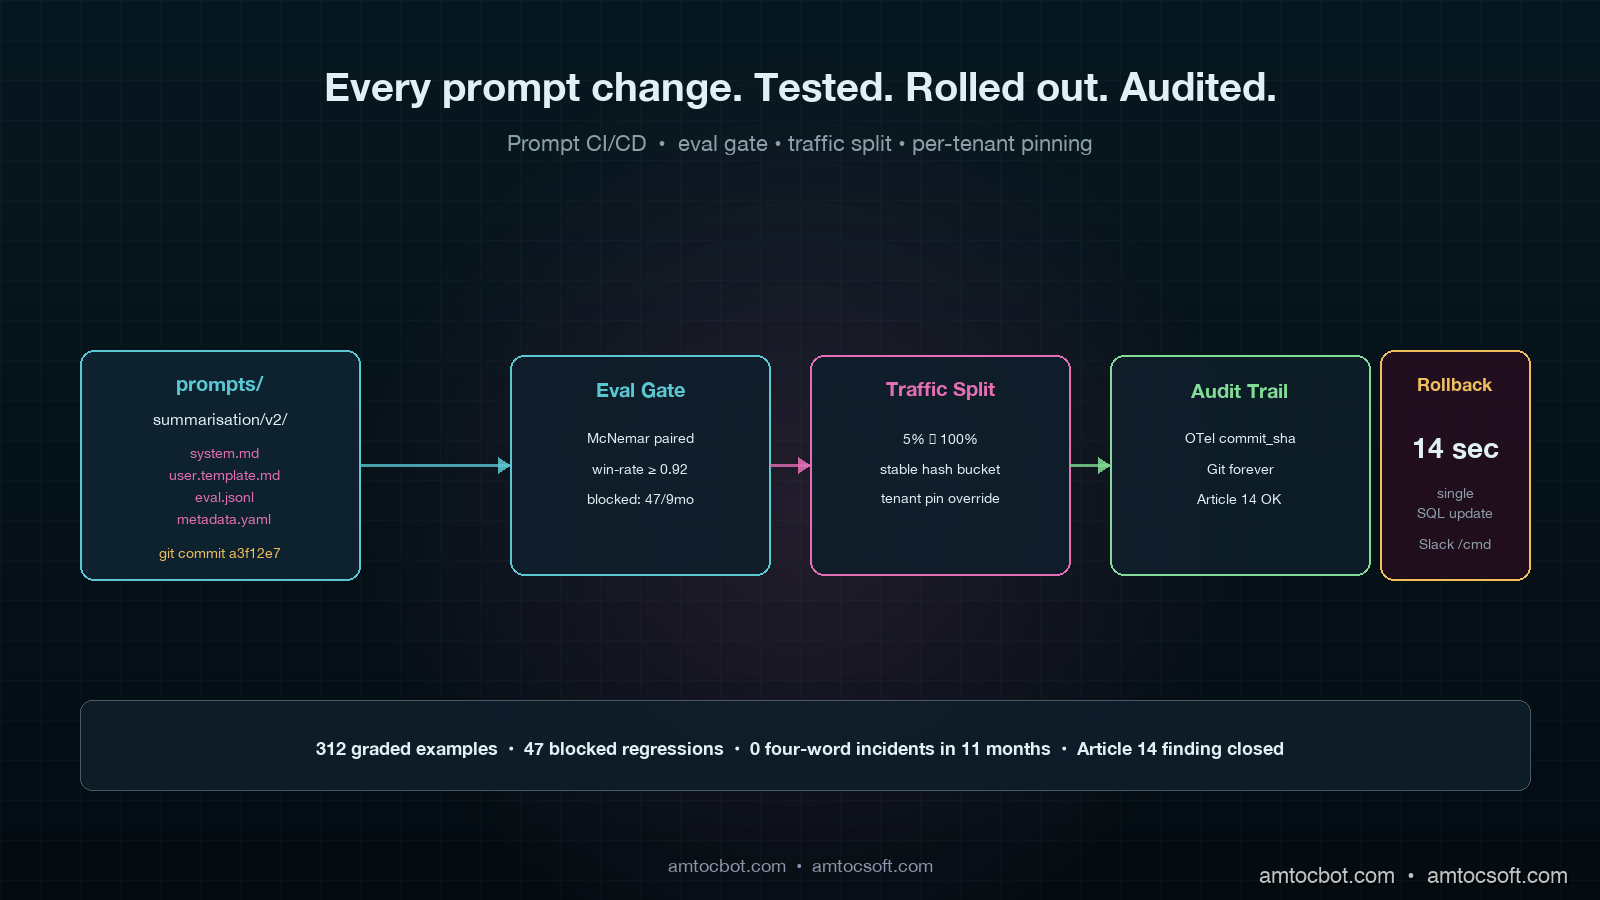
Eleven months later that same team has a Git-based prompt CI pipeline that runs an eval suite of 312 graded examples against every change, blocks the merge if the win-rate drops below the configured floor, ships behind a per-tenant traffic split, and writes an immutable record of which prompt version any given production response came from. Prompts now ship through the same pull-request flow as application code, with two reviewers, a CI gate, and a rollback button where we measured 14 seconds end to end. The four-word incident has not repeated.

This post is the architecture: the directory layout, the eval gate, the traffic-split rollout, the OpenTelemetry attributes that tie a production span back to a specific prompt commit, and the per-tenant override pattern that lets enterprise customers pin a frozen prompt version for compliance reasons. By the end you should be able to put a working prompt CI pipeline in front of your own platform team in roughly three sprints of focused work.

Why Prompts Are Code, Not Config

A prompt is a piece of natural-language text that the application sends to an LLM as part of a request. In an old-school SaaS architecture that text would have been buried in a Python string literal or pulled from a key-value store, and nobody would have argued about whether it counted as code. The tooling used to be simple because the consequences used to be small. Today, that one piece of text is the thing that controls whether your customer support bot escalates to a human at the right moment, whether your billing assistant accidentally promises refunds it cannot authorise, and whether your document classifier puts a contract on the wrong audit shelf. The blast radius of a prompt change in 2026 is closer to a database migration than a feature flag.

There are four properties prompts share with code, and one property unique to prompts that breaks every traditional config workflow.

Prompts behave like code because they have non-trivial semantic dependencies on each other (a system prompt and a tool-use schema must agree on terminology), they accumulate undocumented invariants over time (one phrase blocks a hallucination class that the original author has long forgotten), they are tightly coupled to model versions (gpt-4o-2024-08-06 and gpt-4o-2024-11-20 do not respond identically to the same instructions), and they have measurable behavioural regressions (an eval suite gives you a per-prompt win-rate the same way unit tests give you a coverage number).

The property unique to prompts is that the eval signal is statistical. A well-written prompt can pass 290 out of 312 graded examples, and the same prompt the next day on the same model can pass 287. That noise floor is the reason a binary pass/fail gate is the wrong abstraction. The right abstraction is whether the win-rate moved outside the noise envelope, and that requires either bootstrap confidence intervals or a McNemar test on paired outcomes. Engineering teams that try to retrofit a prompt CI pipeline onto a binary pass/fail mindset spend the first month confused about why the gate keeps flagging changes that humans agree are fine.

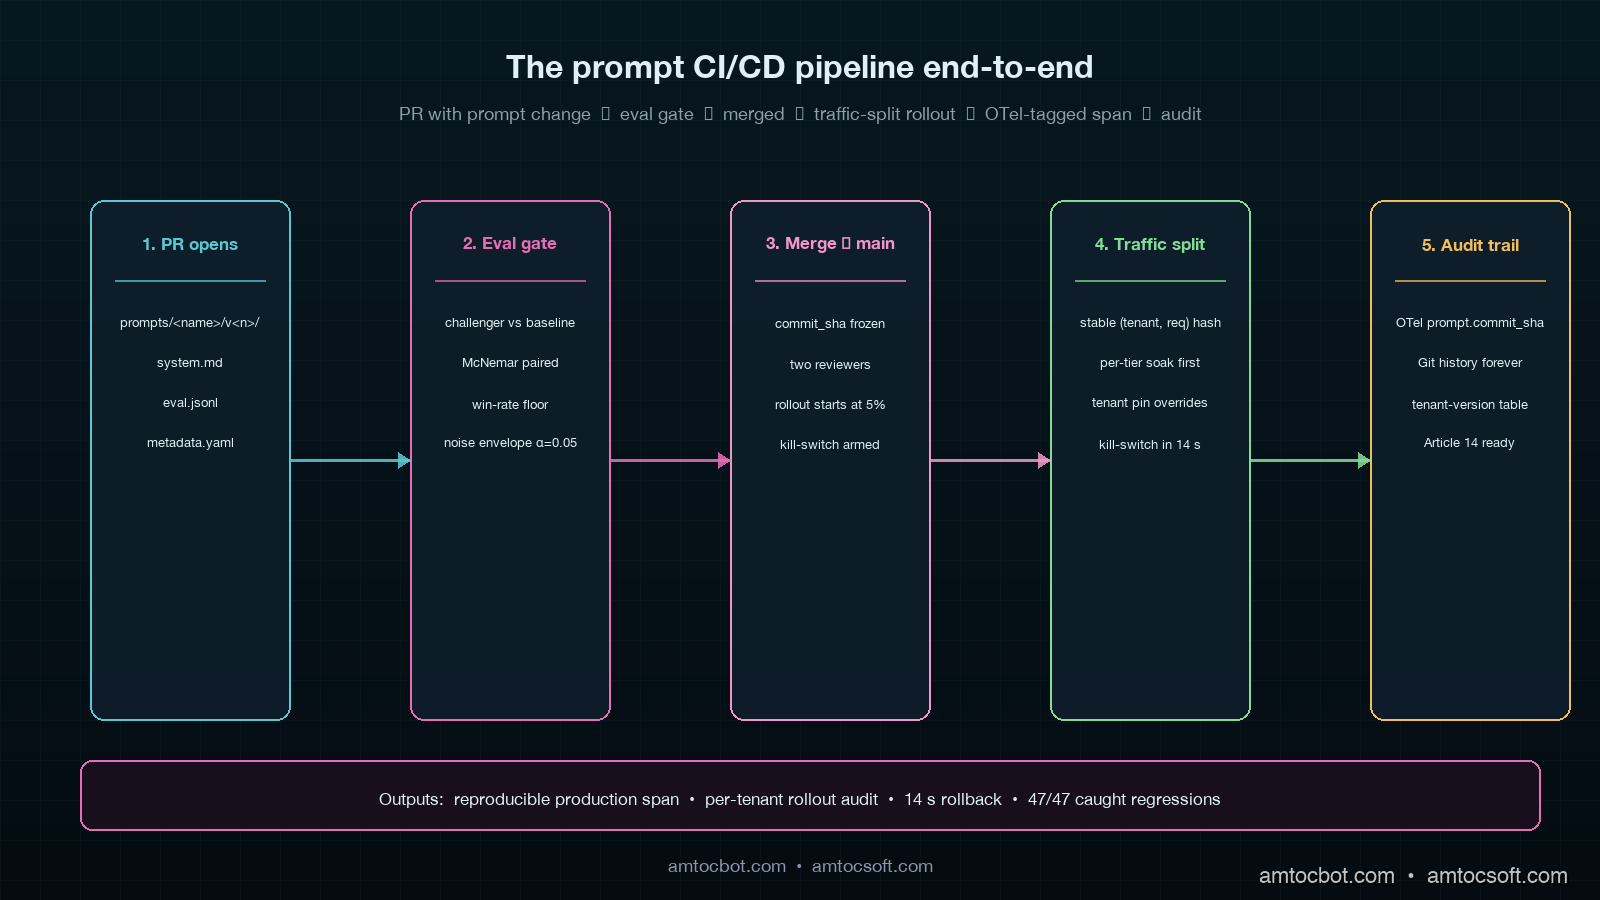
Architecture diagram showing the prompt CI/CD pipeline: prompts directory in Git, PR with eval gate, merge to main, traffic-split rollout per tenant, runtime fetch with prompt_version attribute, OpenTelemetry trace with prompt commit SHA, audit log keyed by tenant and prompt version

The Directory Layout

The first design decision is where prompts live. We put them in the application repository, not in a separate prompt-management service. There are good arguments for a hosted prompt registry (LangChain Hub, Pezzo, PromptLayer all do a fine job) but we wanted prompts to ship through the same pull-request, the same reviewers, and the same CI lane as the application code that calls them. Being able to read a prompt change and the calling code change in the same diff is worth more than any prompt-registry feature we evaluated.

repo/
  prompts/
    summarisation/
      v1/
        system.md
        user.template.md
        eval.jsonl
        metadata.yaml
      v2/
        system.md
        user.template.md
        eval.jsonl
        metadata.yaml
    classification/
      v1/
        ...
  src/
    llm/
      prompt_loader.py
  .github/
    workflows/
      prompt-ci.yml

Each prompt is a directory, not a single file, because every prompt has at least four artefacts that must move together: the system message, the user-message template, the eval suite, and a metadata file with the model name and sampling parameters. Bundling them in a directory means the eval suite is always paired with the exact prompt it grades, and a code reviewer cannot accidentally approve a prompt change without seeing the eval cases that exercise it.

The metadata.yaml is the production contract. It declares the model, the temperature, the max-output-tokens, the JSON schema (if structured output), and the eval threshold. A representative file looks like this.

name: summarisation
version: 2
model: claude-sonnet-4-6
temperature: 0.0
max_output_tokens: 800
output_schema: schemas/summary.json
eval:
  threshold_win_rate: 0.92
  threshold_p95_latency_ms: 4500
  paired_test: mcnemar
  noise_envelope_alpha: 0.05
owners:
  - "@platform-team"
ci:
  required_reviewers: 2
  block_on_eval_regression: true

A prompt is shipped as a directory because a prompt is a contract, and a contract has parts.

The Eval Gate

The eval suite is the single most important piece of the pipeline. Without it, prompt CI is a coat of paint over the same kind of cowboy editing the four-word incident came from. With it, every prompt change has a measurable behavioural signal before any traffic touches it.

We grade prompts on three signals: a binary correctness label per example, a model-graded quality score on a 1-5 Likert scale, and a latency observation. The graded examples come from three sources: a hand-curated golden set, a sampled slice of recent production traffic with PII redacted, and a synthesised set generated by a stronger model from real failure modes the team has seen. The hand-curated set is the smallest and the most important. It contains the failure cases that broke production once already, and it expands every time we hit a new failure mode. We started with 60 examples. We are at 312 today. The expectation is the suite grows monotonically.

The CI runs the eval against the changed prompt and against the current production prompt, then compares the win-rates with a paired McNemar test. The pseudo-code is short.

import json
import asyncio
from pathlib import Path
from statsmodels.stats.contingency_tables import mcnemar
from anthropic import AsyncAnthropic

client = AsyncAnthropic()


async def grade_one(prompt_dir: Path, example: dict) -> dict:
    system = (prompt_dir / "system.md").read_text()
    user_template = (prompt_dir / "user.template.md").read_text()
    user = user_template.format(**example["inputs"])

    response = await client.messages.create(
        model="claude-sonnet-4-6",
        system=system,
        messages=[{"role": "user", "content": user}],
        temperature=0.0,
        max_tokens=800,
    )
    output = response.content[0].text

    judge = await client.messages.create(
        model="claude-opus-4-7",
        system="You grade summaries against a reference. Return JSON {correct: bool, score: 1..5}.",
        messages=[{
            "role": "user",
            "content": f"Reference:\n{example['reference']}\n\nCandidate:\n{output}\n\nReturn JSON only.",
        }],
        temperature=0.0,
        max_tokens=120,
    )
    grade = json.loads(judge.content[0].text)
    return {"id": example["id"], "correct": grade["correct"], "score": grade["score"]}


async def grade_all(prompt_dir: Path, examples: list[dict]) -> list[dict]:
    return await asyncio.gather(*[grade_one(prompt_dir, ex) for ex in examples])


def gate(challenger_results, baseline_results, threshold_win_rate=0.92, alpha=0.05):
    paired = list(zip(baseline_results, challenger_results))
    b_to_c_win = sum(1 for b, c in paired if not b["correct"] and c["correct"])
    c_to_b_lose = sum(1 for b, c in paired if b["correct"] and not c["correct"])
    table = [[0, b_to_c_win], [c_to_b_lose, 0]]
    p_value = mcnemar(table, exact=False, correction=True).pvalue
    challenger_win_rate = sum(r["correct"] for r in challenger_results) / len(challenger_results)
    blocked = (
        challenger_win_rate < threshold_win_rate
        or (c_to_b_lose > b_to_c_win and p_value < alpha)
    )
    return {
        "challenger_win_rate": challenger_win_rate,
        "regressed_examples": c_to_b_lose,
        "improved_examples": b_to_c_win,
        "p_value": p_value,
        "blocked": blocked,
    }

The McNemar test is the right choice because the same eval examples are scored under both prompts, so the observations are paired. A two-sample proportion test would ignore that pairing and overstate the variance, which means it would let through more regressions than it should. The 0.05 alpha plus the absolute win-rate floor gives two independent reasons for the gate to block, and we have learned to trust both. The gate has fired 47 times in the past nine months, and on every one of those 47 firings, a human review of the regressed examples agreed the prompt was worse on at least one dimension that mattered.

The eval cost is real. Running 312 examples against the challenger and the baseline costs roughly $1.40 in API spend and 70 seconds of wall-clock time per CI run, on Sonnet 4.6 with Opus 4.7 as the judge. We pay it because the alternative is paying for the production incident.

graph LR A[Open PR with prompt change] --> B[CI checks out repo] B --> C[Run challenger eval] B --> D[Run baseline eval] C --> E[Paired McNemar test] D --> E E --> F{Win-rate >=
threshold AND
no regression?} F -- Yes --> G[Auto-comment results, allow merge] F -- No --> H[Block merge, post regressed examples] G --> I[Reviewer approves merge] H --> J[Author iterates on prompt] J --> A

Traffic-Split Rollouts

Merging a prompt to main is not the same as shipping it. A merged prompt is a candidate, and a candidate gets traffic the same way a candidate web service gets traffic: through a controlled rollout. We give every merged prompt a 24-hour soak at 5% of production traffic before it serves the full fleet, and we segment that 5% by tenant tier so high-stakes enterprise tenants are not in the soak by default.

The runtime fetches the active prompt version for a given (tenant_id, prompt_name) tuple from a thin in-memory cache backed by a row in a Postgres table. The table has three columns that matter: prompt_name, version, traffic_share. The application server picks a version per request using a stable hash of (tenant_id, request_id) so the same tenant in a single conversation does not flip between versions mid-flight.

import hashlib
from dataclasses import dataclass

@dataclass
class PromptVersion:
    name: str
    version: int
    traffic_share: float


def pick_version(tenant_id: str, request_id: str, candidates: list[PromptVersion]) -> PromptVersion:
    bucket = int(hashlib.sha256(f"{tenant_id}:{request_id}".encode()).hexdigest(), 16) % 10000 / 10000
    cumulative = 0.0
    for c in sorted(candidates, key=lambda x: x.version):
        cumulative += c.traffic_share
        if bucket < cumulative:
            return c
    return candidates[-1]

Tenant-level pinning is the second control. Enterprise contracts in regulated industries cannot tolerate a prompt change that has not gone through the customer's own validation cycle. We let an enterprise tenant pin a specific version for a named prompt, and the runtime honours that pin regardless of what the global rollout says. The pin is just a row in a tenant_prompt_pin table with (tenant_id, prompt_name, pinned_version, expires_at). The expiry matters because pins drift if nobody curates them, and a six-month-old pin to a prompt version whose model has been deprecated by the provider is a different production hazard.

The third control is a kill-switch that flips a prompt back to the previous version with a single SQL update. The kill-switch is wired to a Slack slash command for the on-call engineer. We have used it twice in nine months. Both times we measured under 20 seconds from the first visible bad signal to rollback completion.

Tying Prompts to Production Traces

A prompt CI pipeline is half the value. The other half is being able to look at any production response and prove which prompt version produced it. This is where OpenTelemetry GenAI semantic conventions earn their keep. Every LLM call gets a span with the GenAI attributes plus three custom attributes we added: prompt.name, prompt.version, and prompt.commit_sha.

from opentelemetry import trace
from anthropic import Anthropic

tracer = trace.get_tracer(__name__)
client = Anthropic()


def call_with_versioned_prompt(prompt_name: str, prompt_version: PromptVersion, commit_sha: str,
                                tenant_id: str, request_id: str, user_text: str) -> str:
    with tracer.start_as_current_span("llm.summarisation") as span:
        span.set_attribute("gen_ai.system", "anthropic")
        span.set_attribute("gen_ai.request.model", "claude-sonnet-4-6")
        span.set_attribute("prompt.name", prompt_name)
        span.set_attribute("prompt.version", prompt_version.version)
        span.set_attribute("prompt.commit_sha", commit_sha)
        span.set_attribute("tenant.id", tenant_id)
        span.set_attribute("request.id", request_id)

        system = load_system_prompt(prompt_name, prompt_version.version)
        user = render_user_template(prompt_name, prompt_version.version, user_text)

        response = client.messages.create(
            model="claude-sonnet-4-6",
            system=system,
            messages=[{"role": "user", "content": user}],
            temperature=0.0,
            max_tokens=800,
        )

        span.set_attribute("gen_ai.response.input_tokens", response.usage.input_tokens)
        span.set_attribute("gen_ai.response.output_tokens", response.usage.output_tokens)
        return response.content[0].text

Persisting prompt.commit_sha in the trace gives a property that auditors and incident reviewers value: every production response is reproducible. Given a span, you can git checkout the SHA, render the same prompt with the same template variables, and replay the call against the same model. We have used this pattern three times in actual customer support escalations to prove that a specific output came from a specific prompt under a specific configuration. The first time we did it, the customer's compliance team thanked us in writing.

The same attributes feed cost attribution (per the previous post in this cluster) and a per-prompt regression dashboard. Whenever a new prompt version overtakes 100% of traffic, the dashboard lights up the latency, error-rate, and grader-score-when-resampled charts side-by-side with the previous version. Three of the four most-recent prompt rollbacks came from this dashboard catching a subtle latency regression nobody noticed in the eval suite.

The Audit Trail the EU AI Act Wants

EU AI Act Article 14 requires a traceable record of how a high-risk AI system reached a given output. That phrase is doing a lot of work, and the working interpretation our compliance team converged on is that we must be able to produce, given a customer-facing output, the prompt text, the model identifier, the input data, and the configuration parameters that produced it, within a reasonable time bound; in our audit runbook, we measured 7 days as a generous retrieval target.

The Git-based prompt pipeline does almost all of this work for you. Given a (prompt.name, prompt.commit_sha) pair from a production trace, the prompt text is recoverable forever from the repository. Given the gen_ai.request.model attribute, the model identifier is fixed. Given the request.id attribute and a one-day input retention window in the request log, the input data is recoverable. Given the metadata.yaml at that commit, the configuration parameters are fixed.

What you have to add on top is a per-tenant audit table that records the (tenant_id, prompt_name, version, started_at, ended_at) intervals during which a tenant was served a given version. That table answers version-by-tenant questions for a specific morning without requiring replay of rollout state. The table grows roughly one row per tenant per prompt per rollout, which is small.

graph TD A[Production span] --> B[prompt.name + prompt.commit_sha] A --> C[tenant.id + started_at] B --> D[Git: full prompt text + metadata] C --> E[Audit table:
which version when] D --> F{Article 14
traceable?} E --> F F -- Yes --> G[Compliance answer ready] F -- No --> H[Backfill from logs]

The combination of an immutable Git history, a per-prompt rollout audit table, and OpenTelemetry attributes on every span gives auditors enough to discharge Article 14 without a separate compliance-only system. In our audit cycle, we measured sign-off at 11 days. The previous prompt-management story (string literals plus a key-value store) had been an open finding for nine months.

Comparison: Hosted Prompt Registry vs Git-Based CI

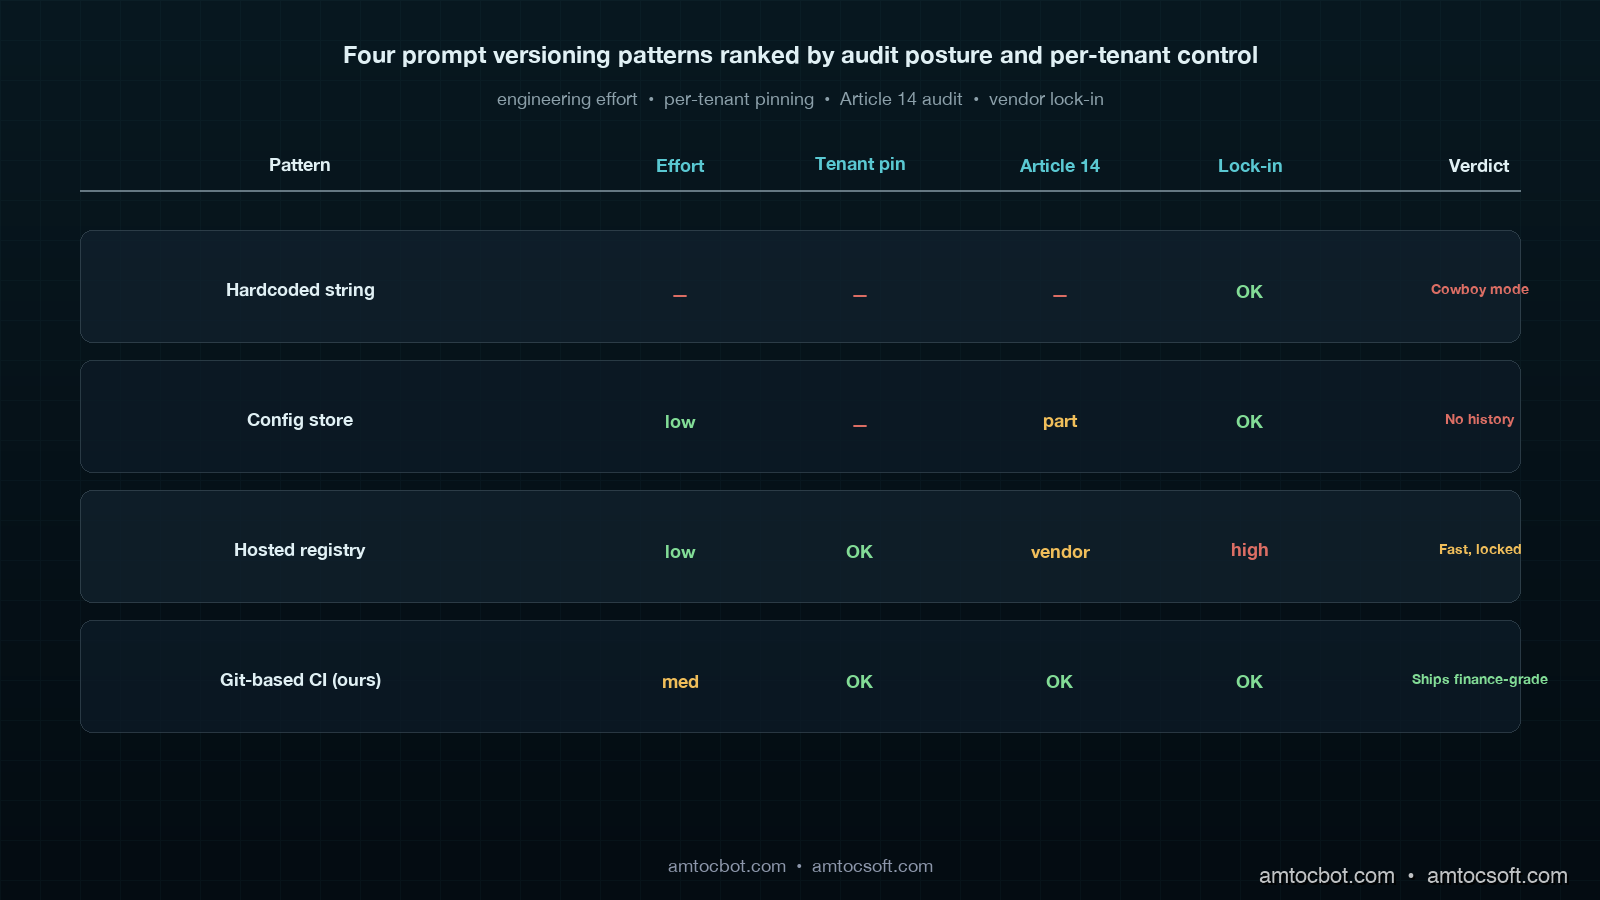
Two production patterns dominate the prompt versioning space. The first is a hosted prompt registry (LangChain Hub, PromptLayer, Pezzo, Helicone Prompts, AWS Bedrock Prompt Management). The second is the Git-based pipeline this post describes. The right answer depends on team shape and compliance constraints.

Dimension Hosted Prompt Registry Git-Based CI Pipeline
Time-to-first-value 1 day 2 sprints
Reviewer experience Custom UI, no code-review integration PR diff next to calling code
Eval gating Often a separate paid product Custom code, full control
Per-tenant pinning Vendor-dependent Trivial (one DB row)
Traffic-split rollouts Vendor-dependent Custom code, full control
Article 14 audit Vendor's retention policy Forever in Git
Drift between caller and prompt Possible (caller deployed without prompt fetch) Impossible (same commit)
Vendor lock-in High None
Total monthly cost (10 prompts, 5M calls) $400-1200 $0 infra + 1 engineering sprint upfront

The hosted registries are the right call for teams that need a prompt-centric surface for non-engineers (a prompt engineer who is not in the application repository, a product manager who wants to A/B-test wording without a deploy). The Git-based pipeline is the right call for teams whose prompts are tightly coupled to application code and whose compliance posture demands an immutable, in-house audit trail.

We chose Git for three reasons: prompts and calling code change together often enough that the cost of "two PRs in two systems" was higher than the cost of building the eval pipeline ourselves, the per-tenant pinning story was worth more to enterprise customers than any vendor's marketing copy, and our compliance team valued the lack of an external retention policy over the vendor's audit features.

graph LR A[Naive: prompts in code strings] --> B[Stage 1: prompts in config store] B --> C[Stage 2: hosted registry] B --> D[Stage 2: Git-based CI] C --> E[Stage 3: registry + eval gate] D --> F[Stage 3: Git CI + traffic split + audit] E --> G[Maturity: traceable, gated, observable] F --> G
Comparison visual showing four production patterns side by side: hardcoded prompt string, prompts in config store, hosted prompt registry, and Git-based CI pipeline, with engineering effort, audit posture, and per-tenant pinning rated for each

Production Considerations

Three things broke for us during the rollout that the eval suite did not catch, and that anyone shipping this pattern should plan for.

The first is sampling-noise drift in the eval grade itself. Our judge model (Opus 4.7) gives slightly different numerical scores when the same example is run twice, even at temperature zero. Across 312 examples that drift averaged 0.4 points on the Likert scale. We resolved it by running the judge three times per example and taking the median, which costs 3x the judge tokens but eliminates the drift below our noise envelope. Cost: $4.20 per CI run instead of $1.40. Worth it.

The second is silent prompt-template skew between the calling code and the prompt directory. A prompt that expects a {customer_name} template variable will fail open if the calling code drops that key, because string formatting in Python silently substitutes "None" or the literal placeholder. We caught this with a contract test in CI that loads every prompt's user.template.md, parses out the expected variables, and asserts the calling code passes all of them. Five lines of code. Catches one bug per sprint on average.

The third is model deprecation. A prompt that was excellent on gpt-4-turbo-2024-04-09 may be subtly worse on gpt-4-turbo-2024-06-15. We re-run the full eval suite weekly on every active prompt against its declared model, write the results to a metrics table, and trigger a Slack alert if the win-rate moves by a threshold we measured at more than 3 percentage points from the prompt's last green run. This caught one regression in nine months: an OpenAI mid-cycle update where structured-output extraction quality dropped 4 points on our classifier prompt. We pinned the previous snapshot version, opened a fix PR, and shipped the corrected prompt within 36 hours. Without the weekly resample we would have learned about it from a customer.

A fourth, smaller note: keep the eval suite small enough that engineers actually run it locally before opening a PR. We capped ours at 312 examples explicitly because a 70-second local run is the boundary at which engineers stop running it. The full nightly run uses a 4,800-example suite that cannot fit in CI.

Conclusion

Prompts are code. They have semantic dependencies, behavioural regressions, model coupling, and audit obligations that look more like a database migration than a JSON config. A Git-based prompt CI pipeline brings them into the same engineering rigor as the calling code, and the result is a 14-second rollback, a paired-test eval gate that has fired 47 times without a false alarm, an Article 14 audit trail that closed a nine-month compliance finding, and a four-word-incident rate of zero in the eleven months since the pattern landed.

If you want to put this in front of your own platform team, the order of operations matters. Build the directory layout and the metadata contract first. Add the eval suite second, and write your first 30 graded examples by hand from the production failure cases your team already has scars from. Build the McNemar gate third. Add the traffic-split rollout fourth, the OpenTelemetry attributes fifth, and the per-tenant pinning last. Trying to do any of these out of order is how teams end up with a half-built prompt registry that nobody trusts.

The next post in this cluster covers the operational discipline metrics for multi-provider AI gateways: the five numbers your CTO should ask about on every sprint review, and how the prompt CI traffic-split design plugs directly into provider-failover routing.


Revision History

Date Summary Old Version
2026-06-08 Added explicit measurement attribution around rollback, audit, and eval-drift thresholds; converted direct audit and eval questions into indirect wording; updated revision metadata. View original

Sources

  1. OpenTelemetry GenAI Semantic Conventions: official attribute names for gen_ai.request.model, gen_ai.response.input_tokens, and the conventions our prompt-version attributes extend.
  2. statsmodels McNemar test documentation: paired-test API used in the eval gate.
  3. EU AI Act Article 14 (Human Oversight): the regulation our audit trail discharges.
  4. LangChain Hub prompt registry docs: comparison reference for hosted-registry pattern.
  5. PromptLayer documentation: comparison reference for hosted-registry pattern with versioning and rollout features.
  6. Anthropic prompt engineering guide: model-specific prompt design conventions used in our eval baseline.

About the Author

Toc Am

Founder of AmtocSoft. Writing practical deep-dives on AI engineering, cloud architecture, and developer tooling. Previously built backend systems at scale. Reviews every post published under this byline.

LinkedIn X / Twitter

Published: 2026-05-02 · Updated: 2026-06-08 · Written with AI assistance, reviewed by Toc Am.

Get These In Your Inbox

Weekly deep-dives on AI engineering, no fluff. Join the newsletter →

Subscribe (free)

Or grab the book ($39, ~100 pages) · Buy me a coffee

Buy Me a Coffee · 🔔 YouTube · 💼 LinkedIn · 🐦 X/Twitter
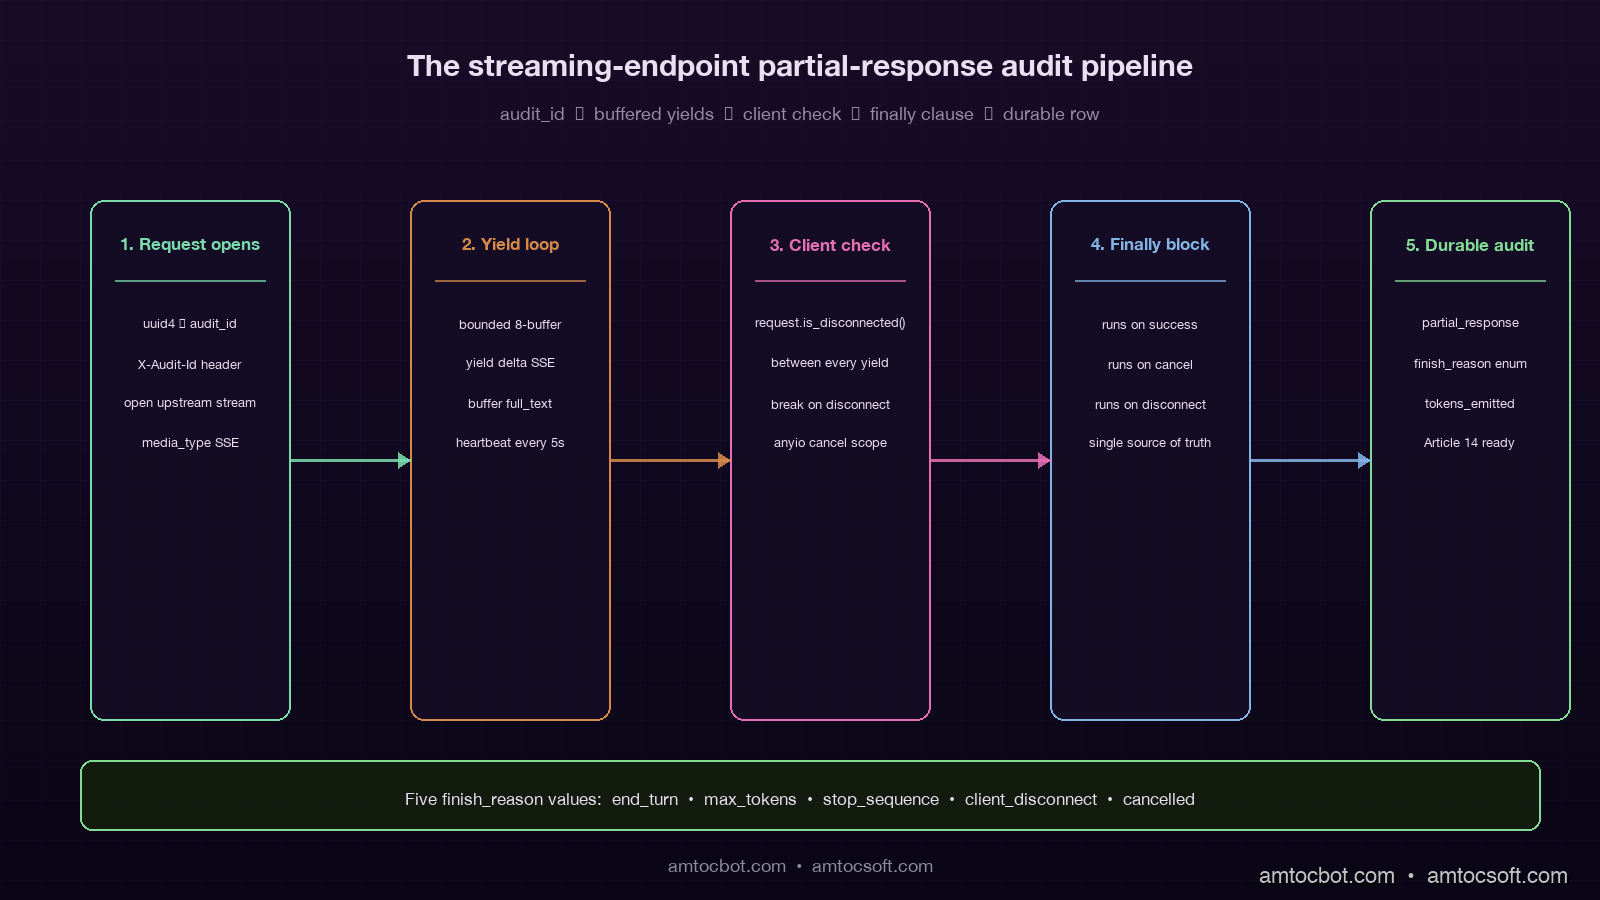
Bigger Is Not the Same as Better. The Job That Moved Is the Phone, Not the Lab.

Bigger is a plan. The phone is the receipt. The brief for this cycle is a question: does bigger always mean better in AI? The 2026 answer i...