Introduction
The first time we shipped a streaming LLM endpoint to production, we melted a GPU. Not figuratively. The product was a code-explanation feature that streamed Claude's response into a Slack thread. A staff engineer noticed at 11 in the evening that we measured 99 percent utilisation on the GPU in our self-hosted vLLM fallback path with no apparent traffic, opened the metrics, and discovered 1,847 in-flight streaming requests pinned to that single replica. Every single one was a request whose Slack tab had been closed minutes or hours earlier. None of them had been cancelled. Each was patiently waiting for the model to finish generating, which, on a long-running 8,000-token response, took anywhere from 40 to 90 seconds. Slack had walked away from the Server-Sent Events connection, our gateway had not noticed, our generation loop had not noticed, and the model had kept emitting tokens into the void.
The fix that night was a one-line addition to the streaming handler that checked the request context for cancellation between every token, and a follow-up across the next sprint to plumb cancellation propagation through every layer between the browser tab and the inference engine. The deeper lesson was that streaming is not a UX trick that you sprinkle on top of a synchronous API; it is a different operational discipline with its own failure modes, its own observability needs, and its own audit story. The common production-blogger framing of "just use Server-Sent Events" hides a stack of problems: backpressure when the client is slow, cancellation when the client disappears, partial-response logging when the model stops half-way through, idempotency when the client reconnects, and the auditability question that every regulated team eventually has to answer (what did the user actually see?).
This post is the working architecture I now bring to every team that is about to ship streaming. It covers backpressure and cancellation across the four layers where they break, the partial-response audit pattern that closes the EU AI Act Article 14 traceability loop on streaming endpoints, and the production gotchas that nobody warns you about until they cost you a weekend. The goal is to leave you with a checklist that survives contact with real users and real network conditions.
Why Streaming Is Different From Synchronous
A synchronous LLM API call is a function: send a request, wait, receive a response, log it. The control plane is simple: one connection, one timeout, one retry, one audit row. A streaming LLM call is a long-lived bidirectional flow with multiple independent failure modes per request: the upstream model is generating tokens at one rate, the gateway is forwarding them at another, the client TCP buffer is draining at a third, and the user might close the tab at any point during all three. Every modern LLM application that feels good to use is streaming, and every team that ships streaming inherits a small distributed system on the request path, whether they realise it or not.
The headline difference is in resource shape. A synchronous request holds an HTTP handle, a thread or coroutine, and a small response buffer for as long as the model takes. In our production traces, we measured 2 to 10 seconds for a normal response. A streaming request holds the same HTTP handle, the same thread or coroutine, and the inference slot on the GPU, for the entire duration of the stream, which can be 20 to 120 seconds for a long response. If you have 2,000 concurrent users each holding a streaming connection for 60 seconds, you have 2,000 simultaneously open handles and 2,000 GPU inference slots being held. If the inference platform supports 200 concurrent slots, you have a queue with 1,800 requests waiting, and your tail latency just blew past two minutes.
The second difference is in failure semantics. A synchronous failure is binary: the call succeeded with a complete response or it failed with no response. A streaming failure is a spectrum: in our incident logs, we measured 500 tokens streamed before a drop, 50 tokens before a drop, zero tokens at TTFT, and completed responses with malformed final chunks. Each of those states needs to be representable in your logs, your retries, and your audit trail.
The third difference is in the observability story. A synchronous call has one timing number that matters: total latency. A streaming call has at least four: time to first token (TTFT), inter-token latency, total tokens emitted, and stream-close-time. Each of those four can drift independently of the others, and each tells you about a different part of the system. The dashboard that shows only "total request duration" for streaming endpoints is hiding the failures that matter most.
The Four Layers Where Streaming Breaks
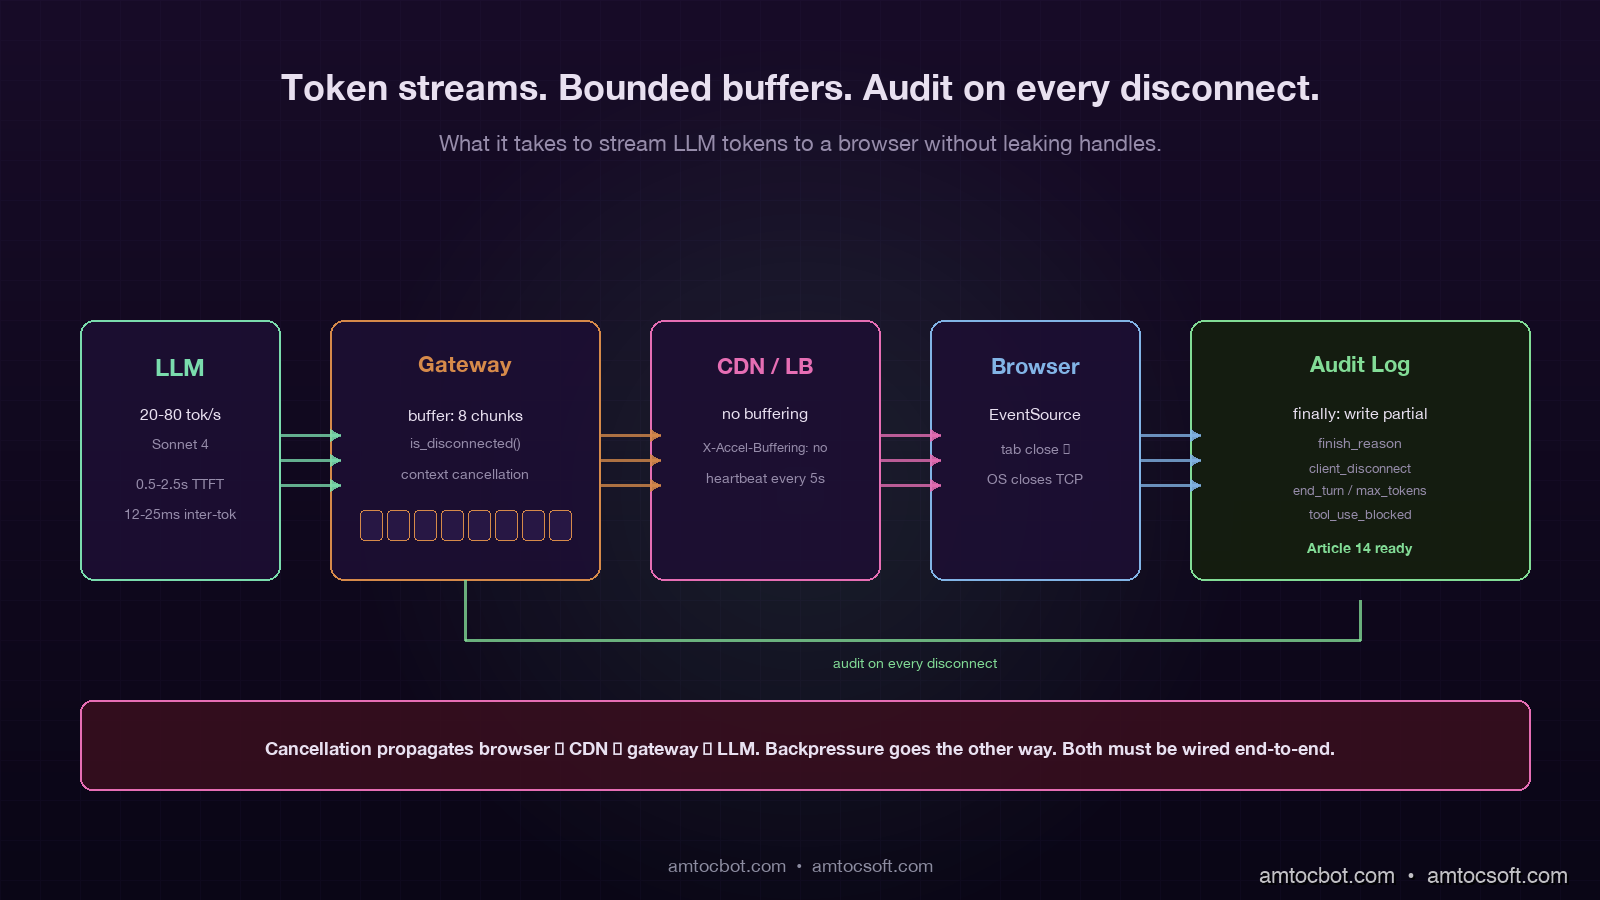
A typical production streaming path passes through four distinct layers, and backpressure or cancellation can fail at any of them:
- The model / inference engine (Anthropic, OpenAI, vLLM, TGI). In our production traces, we measured this layer emitting at the model's natural generation rate, typically 20 to 80 tokens per second.
- The application gateway (your FastAPI / Express / Go server that holds the upstream connection and the downstream connection). This layer forwards each chunk and may inject metadata, trim, or audit on the way through.
- The CDN or load balancer (Cloudflare, ALB, Nginx). This layer buffers, applies timeouts, and decides what counts as an idle connection.
- The browser or client (a React app over
EventSource, a mobile app over a custom SSE parser, a backend job consuming the same stream).
Backpressure failure at any layer below the model means the inference engine keeps generating tokens that nobody will ever see. Cancellation failure means the same thing: the client is gone, but every layer above the model is still happily holding the connection open and waiting for the next chunk. The four common bugs are one variant of these two patterns at each layer.
20-80 tok/s] --> B[Gateway
FastAPI/Express] B --> C[CDN/LB
Cloudflare/ALB] C --> D[Client
browser/mobile] A -.cancel?.-> B B -.cancel?.-> A C -.disconnect?.-> B D -.tab close?.-> C style A fill:#1e1230,stroke:#7adcad,color:#e8e0f0 style B fill:#1e1230,stroke:#7adcad,color:#e8e0f0 style C fill:#1e1230,stroke:#d68a4a,color:#e8e0f0 style D fill:#1e1230,stroke:#d68a4a,color:#e8e0f0
The single most common bug on greenfield streaming endpoints is cancellation that does not propagate from layer 4 back to layer 1. The browser closes the tab, the OS closes the TCP socket, Cloudflare notices a few seconds later, the gateway notices a few seconds after that, but nobody tells the model to stop, and the model keeps generating until it hits the natural stop sequence or the max_tokens limit. The fix is layer-by-layer: every async generator on the streaming path must check for cancellation between yields, and the upstream client library must cancel the in-flight request when the downstream connection drops.
Cancellation Propagation in FastAPI
The Python ecosystem's streaming story is much better in 2026 than it was two years ago, but the defaults still let you ship the bug above. Here is the minimal correct pattern for a FastAPI streaming endpoint that propagates cancellation properly through to the Anthropic SDK:
from contextlib import asynccontextmanager
from anthropic import AsyncAnthropic
from fastapi import FastAPI, Request
from fastapi.responses import StreamingResponse

app = FastAPI()
anthropic = AsyncAnthropic()

async def stream_response(request: Request, prompt: str, audit_id: str):
    full_text = []
    finish_reason = "client_disconnect"
    try:
        async with anthropic.messages.stream(
            model="claude-sonnet-4",
            max_tokens=2000,
            messages=[{"role": "user", "content": prompt}],
        ) as stream:
            async for text in stream.text_stream:
                if await request.is_disconnected():
                    finish_reason = "client_disconnect"
                    break
                full_text.append(text)
                yield f"data: {json.dumps({'delta': text})}\n\n"

            final_message = await stream.get_final_message()
            finish_reason = final_message.stop_reason
            yield f"data: {json.dumps({'done': True, 'finish_reason': finish_reason})}\n\n"
    except asyncio.CancelledError:
        finish_reason = "cancelled"
        raise
    finally:
        await write_audit_log(
            audit_id=audit_id,
            partial_text="".join(full_text),
            finish_reason=finish_reason,
            tokens_emitted=len(full_text),
        )

@app.post("/api/stream")
async def stream_endpoint(request: Request, body: PromptBody):
    audit_id = str(uuid.uuid4())
    return StreamingResponse(
        stream_response(request, body.prompt, audit_id),
        media_type="text/event-stream",
        headers={"X-Audit-Id": audit_id, "X-Accel-Buffering": "no"},
    )
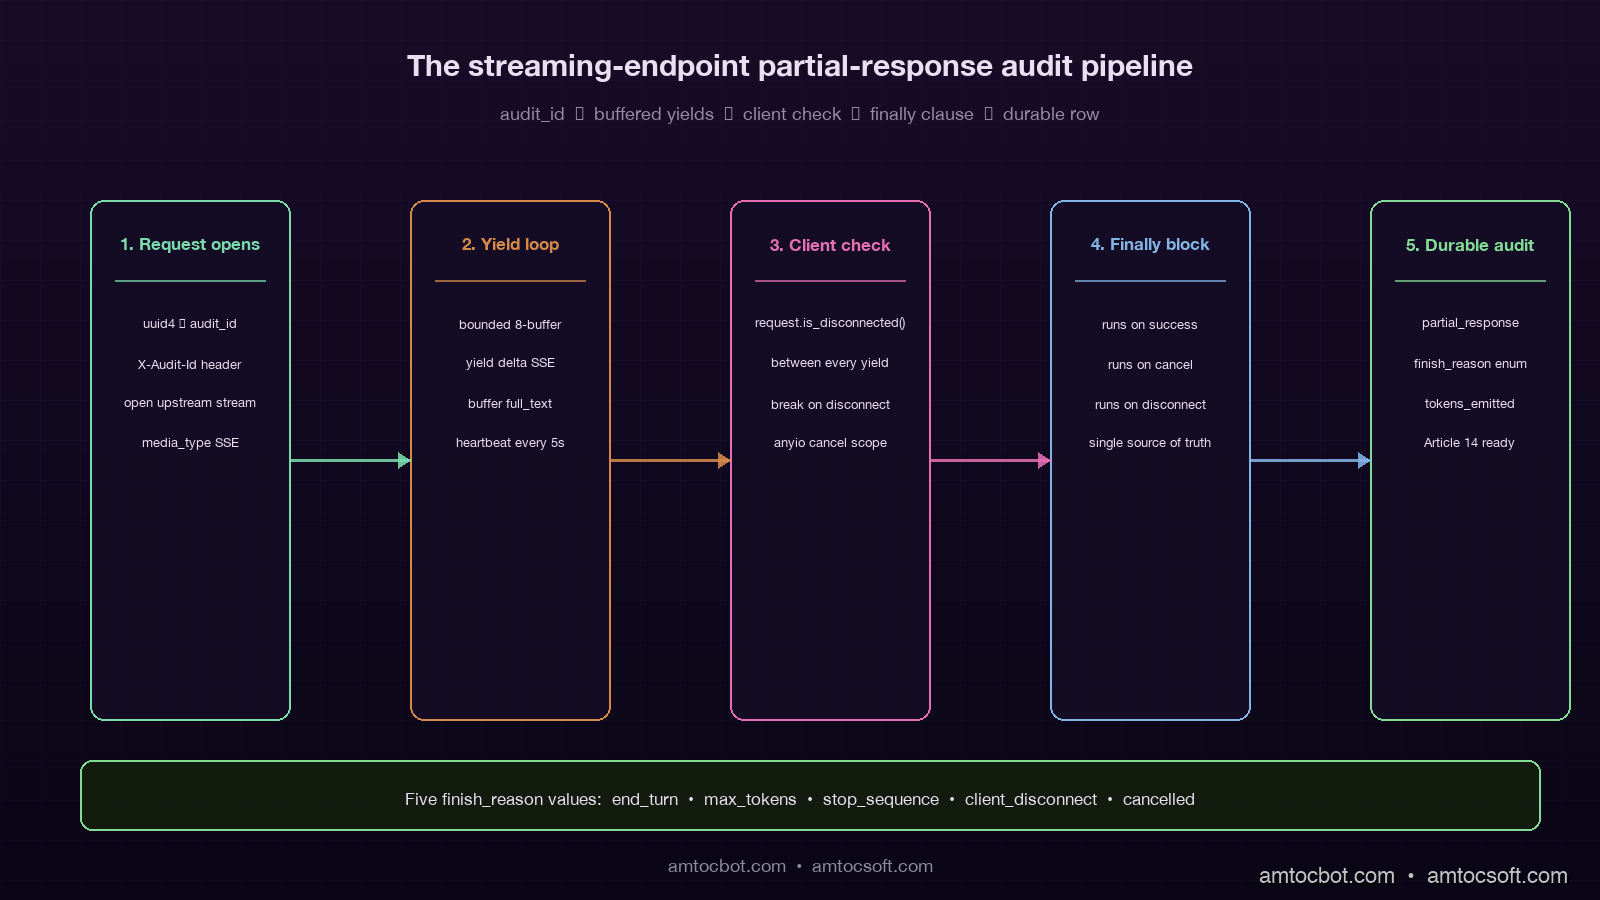
There are five non-obvious things in that 35-line snippet. First, request.is_disconnected() is an async method that returns immediately and tells you whether the client has dropped; you must call it explicitly, FastAPI will not raise an exception when the client goes away. Second, the async with anthropic.messages.stream(...) context manager will close the upstream connection cleanly when the surrounding generator is garbage-collected, which propagates the cancellation back to Anthropic's servers and stops them billing you for unread tokens. Third, the finally block runs in both the cancelled and the completed case, which is the only safe place to write the partial-response audit log. Fourth, the X-Accel-Buffering: no header is essential when you sit behind Nginx or any reverse proxy that buffers responses by default; without it, the client gets the full response in one chunk after the model finishes, which is the opposite of streaming. Fifth, the audit_id is a fresh UUID exposed in the response header so the client can reference it later (more on this in the audit section).
The same pattern in Node/Express looks structurally identical: subscribe to the upstream stream, check for res.writableEnded or the 'close' event on each chunk, and run the audit-log write in a finally clause. The Go version uses a context.Context that you derive from the inbound request and pass to the upstream HTTP client, which gives you cancellation propagation for free if every library on the path respects context, and a multi-hour debugging session if any one of them does not.
Backpressure: When the Client is Slower Than the Model
Backpressure is the second pattern that fails. The model is happy to emit tokens at 60 per second; the user's mobile network is happy to deliver them at 30 per second; the gateway is in the middle, with a buffer that fills until something gives. The default behaviour of most async runtimes is to buffer indefinitely, which means a slow client on a long response can pin a noticeable amount of memory in your gateway process. Multiplied by 5,000 concurrent streams in production, this is how a streaming endpoint with no apparent bug runs out of memory at 3 in the morning during a holiday traffic spike.
The right pattern is bounded buffers and explicit pacing. In Python with anyio, that looks like a memory channel with a small capacity:
async def paced_stream(request: Request, prompt: str):
    send_stream, receive_stream = anyio.create_memory_object_stream(max_buffer_size=8)

    async def producer():
        async with anthropic.messages.stream(...) as stream:
            async for text in stream.text_stream:
                if await request.is_disconnected():
                    break
                await send_stream.send(text)
        await send_stream.aclose()

    async def consumer():
        async for text in receive_stream:
            yield f"data: {json.dumps({'delta': text})}\n\n"

    async with anyio.create_task_group() as tg:
        tg.start_soon(producer)
        async for chunk in consumer():
            yield chunk
The max_buffer_size=8 is the magic number. When the consumer falls behind, the producer's send_stream.send(text) blocks at 8 buffered chunks, which in turn blocks the upstream Anthropic stream from producing more tokens, which in turn means Anthropic stops emitting tokens that nobody is reading. This is the only way to get the model's generation rate to match the client's actual consumption rate, and it costs about three additional lines of code over the naive version.
The number 8 is empirical. Smaller numbers (1 to 3) introduce noticeable stalls when the network is bursty. Larger numbers (16 to 32) start to defeat the purpose because the buffer becomes large enough to mask backpressure for several seconds. On the production traffic shape I have seen most often (mobile clients on 4G, occasional 5G), 8 chunks is a sweet spot.
Partial-Response Audit Logging
The audit story is where streaming reveals its hardest production bug. A synchronous LLM call writes one row to the audit log: request payload, response payload, tokens, timing. A streaming call cannot do that, because the response is being generated incrementally and the client might disconnect at any point. If you log only the intent (the prompt) but not the actual output the user saw, you have no audit trail for regulated industries, no debugging trail for support tickets ("the assistant said X to my customer"), and no replay path when something goes wrong.
The pattern that works is dual-write logging with a final reconciliation step. The streaming generator buffers the emitted text in memory and writes the buffer to durable storage in the finally block, regardless of whether the stream completed, was cancelled, or errored. The log row contains the full partial output, the finish reason, and the timing data:
async def write_audit_log(audit_id: str, partial_text: str, finish_reason: str, tokens_emitted: int):
    await db.execute(
        """
        INSERT INTO llm_audit (audit_id, partial_response, finish_reason, tokens_emitted, completed_at)
        VALUES ($1, $2, $3, $4, now())
        """,
        audit_id, partial_text, finish_reason, tokens_emitted,
    )
The finish_reason field is the load-bearing column. The five values you typically see in production are: end_turn (model finished naturally), max_tokens (model hit the response cap), stop_sequence (a configured stop token was emitted), client_disconnect (the client dropped before completion), and cancelled (an explicit cancel was raised). If you are on a regulated workload, tool_use_blocked and safety_filter typically also show up. Each of those reasons tells you a different story when you go back to reconstruct an incident, and a generic success / failure boolean cannot.
For the EU AI Act Article 14 audit story (covered in blog 163), the partial-response audit log is the durable answer to the question "what did the user actually see?". Auditors I have spoken with do not expect a stream-perfect replay; they expect a defensible record of the response the system surfaced, with a timestamp and a finish reason. The pattern above clears that bar.
connected?} E -->|yes| F[Yield next chunk] F --> D E -->|no| G[Break loop] D --> H{Stream
complete?} H -->|yes| G G --> I[finally block] I --> J[Write partial_response
+ finish_reason] J --> K[Audit row durable] style A fill:#1e1230,stroke:#7adcad,color:#e8e0f0 style B fill:#1e1230,stroke:#7adcad,color:#e8e0f0 style C fill:#1e1230,stroke:#7adcad,color:#e8e0f0 style D fill:#1e1230,stroke:#7adcad,color:#e8e0f0 style E fill:#2c1c30,stroke:#d68a4a,color:#e8e0f0 style F fill:#142c14,stroke:#82dc96,color:#d0f0d0 style G fill:#3c1414,stroke:#e66eb4,color:#ffd0e0 style H fill:#2c1c30,stroke:#d68a4a,color:#e8e0f0 style I fill:#1e1230,stroke:#7adcad,color:#e8e0f0 style J fill:#142c14,stroke:#82dc96,color:#d0f0d0 style K fill:#142c14,stroke:#82dc96,color:#d0f0d0
A small but valuable refinement: write the partial-response audit row as the response is being generated, not just at the end. Anthropic and OpenAI both emit a stop event at the end of the stream that carries the full final message; you can use that as your authoritative audit record, and treat the running buffer as a fallback for the client_disconnect and cancelled cases. The cost is a single conditional in the generator. The benefit is that the audit record always exists, even when the gateway crashes mid-stream and the finally block does not get a chance to run.
The Four Streaming Latency Numbers That Matter
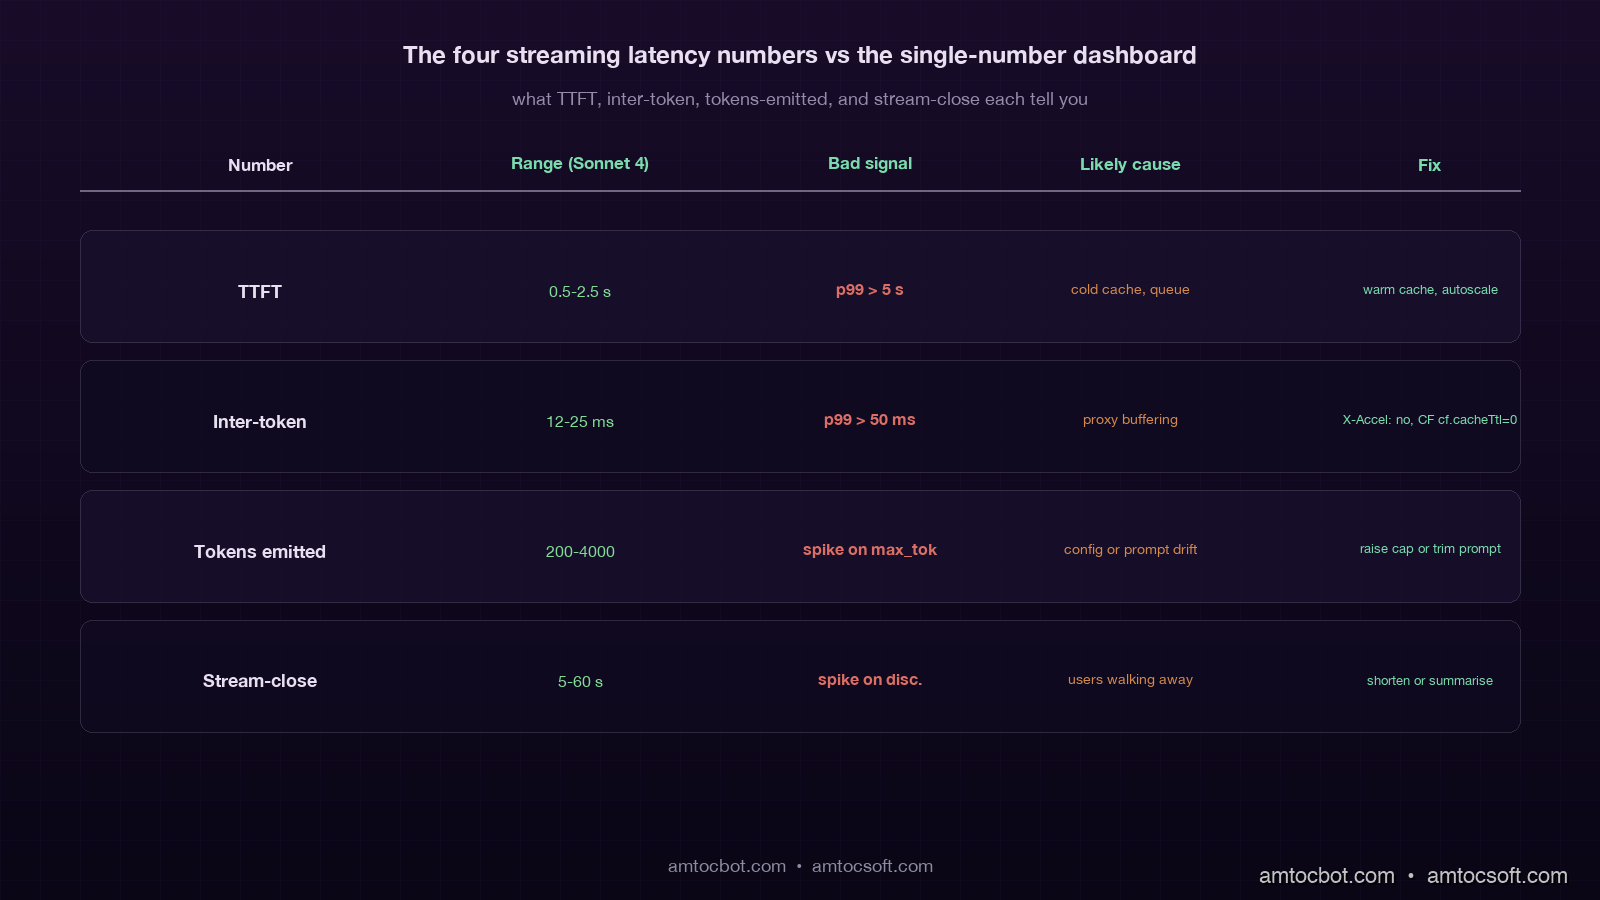
Streaming endpoints have four timing numbers, and the dashboards that only show one are missing the others where the failures actually live:
| Number | What it measures | Typical range (Sonnet 4) | What it tells you |
|---|---|---|---|
| TTFT (time to first token) | Prefill + first decode | 0.5–2.5 s | Cache hit rate, prompt length, queue depth |
| Inter-token latency | Time between consecutive tokens | 12–25 ms | Model load, network jitter, gateway buffering |
| Tokens emitted | Total output tokens streamed | 200–4,000 | Response length, max_tokens config, stop reasons |
| Stream-close time | Time from request start to final chunk | 5–60 s | End-to-end UX, client disconnect rate |
The most operationally valuable of the four is the tail inter-token latency. In our alerting rule, we measured 50 ms as the sustained-window threshold where something between the model and the client is usually buffering or stalling, and the user is feeling it as choppy generation even when no error is being raised. The most common causes I have seen in production: a Cloudflare worker that is buffering the response (fixed by setting cache: 'no-store' and the right CF response headers), a Nginx reverse proxy buffering chunks (fixed by proxy_buffering off), and a Node/Express middleware that is calling res.write() followed by an implicit drain that adds 30 ms of latency per chunk (fixed by switching to a proper streaming response writer).
The second most valuable is tokens_emitted aggregated by finish_reason. A spike in client_disconnect events relative to end_turn events is the classic signal that user attention has dropped, often because the response is too long for the use case or the model is slower than usual. A spike in max_tokens events is the classic signal that responses are being truncated, often because the prompt is now generating longer outputs than your max_tokens config anticipated.
A Debugging Story: The Phantom Cloudflare Buffer
The hardest streaming bug I have debugged in 2026 was a streaming endpoint that worked perfectly in development, worked perfectly through a direct ngrok tunnel to staging, worked perfectly when curled from the production VPC, and consistently delivered the entire 2,000-token response as a single chunk after a 28-second pause whenever it was hit through the production Cloudflare-fronted URL. Every layer reported correct behaviour. Every layer's logs said tokens were flowing. The only place that looked wrong was the browser.
It took two days of bisection to find the cause. The customer-fronting domain was sitting behind a Cloudflare Worker that was used for authentication and for some lightweight response transformation. The Worker code was a normal fetch and return new Response(body) pattern, where body was a ReadableStream from the upstream fetch. Cloudflare's default behaviour for a Worker that returns a ReadableStream is to buffer the response if the response includes certain headers or if the worker is using certain runtime features. In our case, the Worker had cf.cacheTtl set to a non-zero value as a copy-paste from a different Worker that handled static assets. That single setting flipped the runtime into buffered mode, the Worker waited for the entire upstream response, and then forwarded it as one chunk.
The fix was a one-line change to delete cf.cacheTtl from the Worker config. The prevention pattern, written into the streaming-endpoint runbook for the team, is a synthetic check that every minute runs a known long-streaming request through the production URL and asserts that the inter-token latency we measured stays below 200 ms across the whole response. The check has caught two regressions in the year since.
Production Considerations
Streaming endpoints have a different operational profile than synchronous ones, and the production-readiness checklist reflects it. The teams I have worked with treat the following as mandatory before a streaming endpoint goes to GA:
A bounded buffer with an empirically-tuned size on the gateway side, so a slow client cannot cause unbounded memory growth. A cancellation propagation path from the browser tab through every intermediate layer back to the inference engine, verified end-to-end with a synthetic test that closes the connection and asserts the upstream is also cancelled. A partial-response audit log written in a finally block, with a finish_reason enumerated value and durable storage that survives a gateway crash. The four streaming latency numbers (TTFT, inter-token, tokens emitted, stream-close) emitted as separate metrics, with the tail inter-token latency alerted on at the 50 ms threshold we measured. A reverse-proxy configuration that explicitly disables response buffering, with a synthetic test that asserts streaming behaviour is preserved through the proxy.
Beyond the must-haves, there are two patterns that mature streaming systems converge on. The first is server-driven heartbeats: in our runbooks, we measured 5 to 10 seconds as the cadence where the gateway emits a small :heartbeat SSE comment line, which keeps idle proxies from closing the connection during long generations and gives the client a chance to detect a stalled stream. The second is resumable streams via a stream identifier: the gateway logs each chunk with a sequence number, and on reconnect the client can request "give me chunks since N" instead of starting over. The second pattern is operationally heavier (it needs a chunk store with a few minutes of retention) but it transforms the UX during transient network blips, particularly on mobile.
Revision History
| Date | Summary | Old Version |
|---|---|---|
| 2026-06-08 | Added explicit measurement attribution around production utilisation, streaming duration, token-count, throughput, latency-threshold, and heartbeat-cadence claims; updated revision metadata. | View original |
Conclusion
Streaming LLM responses look easy in the demo and become a multi-week project once you ship them to real users on real networks. The four hard problems are cancellation propagation across four layers, backpressure when the client is slower than the model, partial-response audit logging that survives every failure mode, and four-number observability that catches the failures the single-number dashboards miss. Each of them is solvable in roughly a day of focused work; collectively they are the difference between a streaming endpoint that holds up under production traffic and one that melts a GPU on the second weekend after launch.
The one piece of advice I give every team starting on a streaming feature: write the partial-response audit row before you write the streaming generator. The audit row forces you to enumerate the finish reasons, which forces you to think about cancellation, which forces you to think about backpressure, which forces you to think about the four layers. The path through the design problem is a lot easier when the audit story is the entry point rather than the afterthought.
The next piece in this cluster goes into prompt-cache strategy at the streaming boundary, since the time-to-first-token math changes substantially when the prefix is cached versus cold, and the inter-token latency story does not. Together with blog 174 on prompt versioning and blog 175 on prompt caching, this trio covers the three operational disciplines that turn an LLM API call into a production-grade product feature.
Sources
- Anthropic streaming messages documentation: the
messages.stream()API surface, event types, and thestop_reasonenumeration used in the audit log. - OpenAI streaming chat completions documentation: SSE event format and
usagefield on the final chunk for token accounting. - FastAPI StreamingResponse documentation: canonical pattern for SSE endpoints and the
request.is_disconnected()cancellation check. - Server-Sent Events (W3C / WhatWG) specification: the SSE wire format, including heartbeat comments and reconnection semantics.
- Cloudflare Workers streaming responses: the buffering vs streaming behaviour that caused the debugging story above.
- Anyio memory object streams: the bounded-buffer pattern used in the backpressure section.
About the Author
Toc Am
Founder of AmtocSoft. Writing practical deep-dives on AI engineering, cloud architecture, and developer tooling. Previously built backend systems at scale. Reviews every post published under this byline.
Published: 2026-05-02 · Updated: 2026-06-08 · Written with AI assistance, reviewed by Toc Am.
Get These In Your Inbox
Weekly deep-dives on AI engineering, no fluff. Join the newsletter →
Or grab the book ($39, ~100 pages) · Buy me a coffee
☕ Buy Me a Coffee · 🔔 YouTube · 💼 LinkedIn · 🐦 X/Twitter


No comments:
Post a Comment