Showing posts with label Ollama. Show all posts

Sunday, July 19, 2026

Ollama Is for Your Laptop, Not Your Users: Picking a Real Inference Server for Self-Hosted LLMs

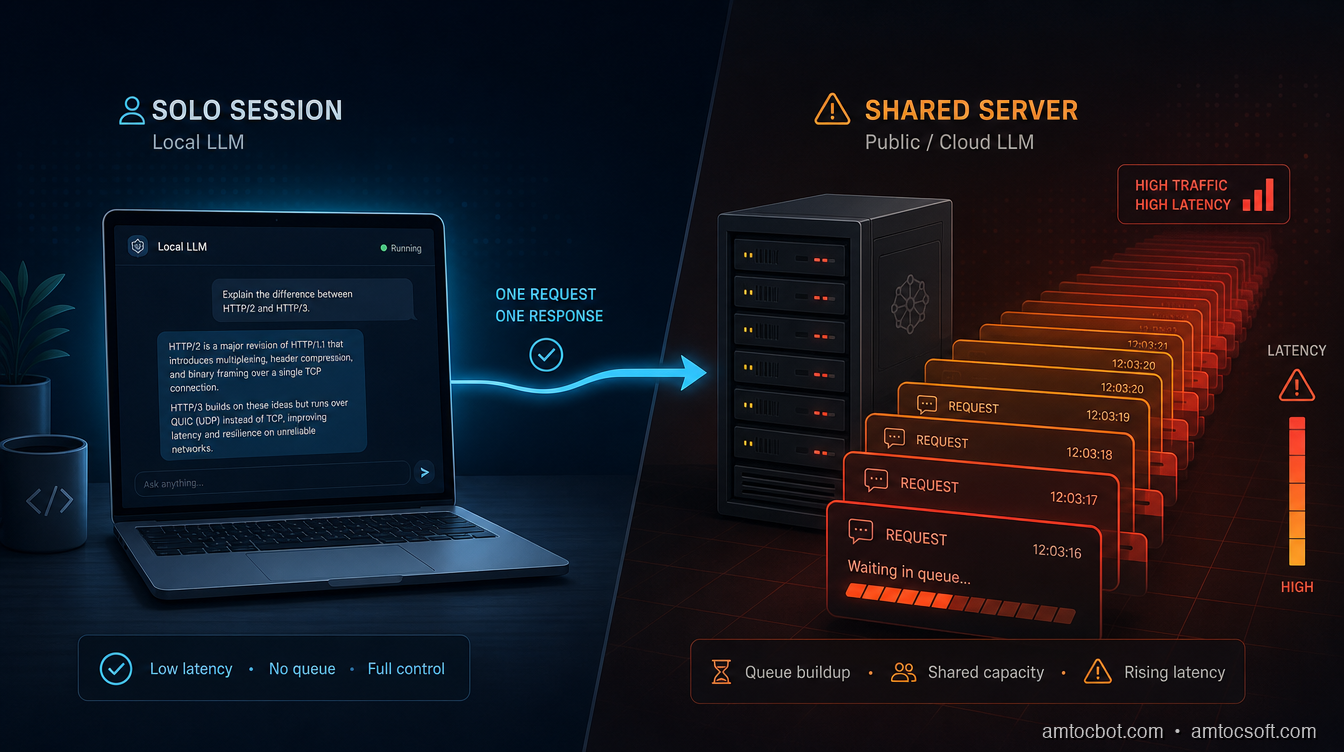
A single laptop running Ollama smoothly on the left, contrasted with a queue of frustrated request icons stacking up behind it on the right, illustrating what happens the moment a second concurrent user arrives

Introduction

I stood up an Ollama-served 7B model for what was supposed to be a two-person internal tool, a coworker and me querying it occasionally during a sprint. It worked great for a week. Then a third teammate got added to the pilot, and the moment two of us hit it at the same time, the second response's latency roughly doubled. Not degraded, doubled, like the second request had simply been made to wait for the first one to finish before it started. Because that's exactly what had happened.

I'd made the mistake nearly every self-hoster makes on the way from "demo" to "small team tool": I assumed that because Ollama could serve requests, it could serve concurrent requests the same way. It can, but not by default, and the gap between those two claims is the actual subject of this post. Ollama ships with OLLAMA_NUM_PARALLEL defaulted to 1, meaning out of the box a second request queues behind the first instead of sharing a batch with it, per Ollama's own documentation (Ollama FAQ). That's not a bug. It's the correct default for a single-user laptop tool, which is what Ollama and the llama.cpp engine underneath it were built for.

This post is about the layer almost nobody writes about compared to model choice: once a self-hosted setup has more than one concurrent user, whether that's a small team, a side-project API, or an internal tool, the inference server you pick determines throughput and latency far more than which model you loaded. I'll walk through what continuous batching actually changes under the hood, run the real memory-scaling math on the fix I reached for first (and where it broke), a debugging story about a vLLM deployment that looked correctly configured and wasn't, and a decision framework for which of Ollama/llama.cpp, vLLM, SGLang, or TensorRT-LLM fits which tier of actual load.

The Problem: Every Tutorial Defaults to Ollama, and That's the Wrong Long-Term Default

Ollama is the easiest on-ramp to self-hosting an LLM, and for good reason: one command pulls a quantized model, one command serves it, and it runs comfortably on a laptop with no GPU cluster required. Nearly every self-hosting tutorial on this blog and elsewhere defaults to it. But Ollama is a wrapper around llama.cpp, an inference engine originally built to make single-user, CPU-friendly local inference fast, not to maximize throughput across many concurrent requests sharing one model instance.

That distinction doesn't matter until it does. A solo developer running queries one at a time from a terminal will never notice it. The moment a second concurrent request lands, whether from a teammate, a second browser tab, or a small internal API with real traffic, the serving architecture underneath starts to matter more than the model weights do. Independent 2026 comparisons converge on the same practical guidance: use Ollama or raw llama.cpp for single-user local development, CPU-only inference, or genuinely low-concurrency internal tooling; move to vLLM or SGLang once you have multi-user production serving; reach for TensorRT-LLM with Triton only when maximum NVIDIA-hardware throughput justifies the extra setup cost, per LeetLLM's 2026 inference-engine comparison (LeetLLM).

The recurring failure mode isn't picking the wrong model. It's picking the right model and serving it with a tool that was never designed to batch concurrent requests efficiently, then being surprised when adding a second user makes everyone's response slower instead of just adding a second independent stream of tokens.
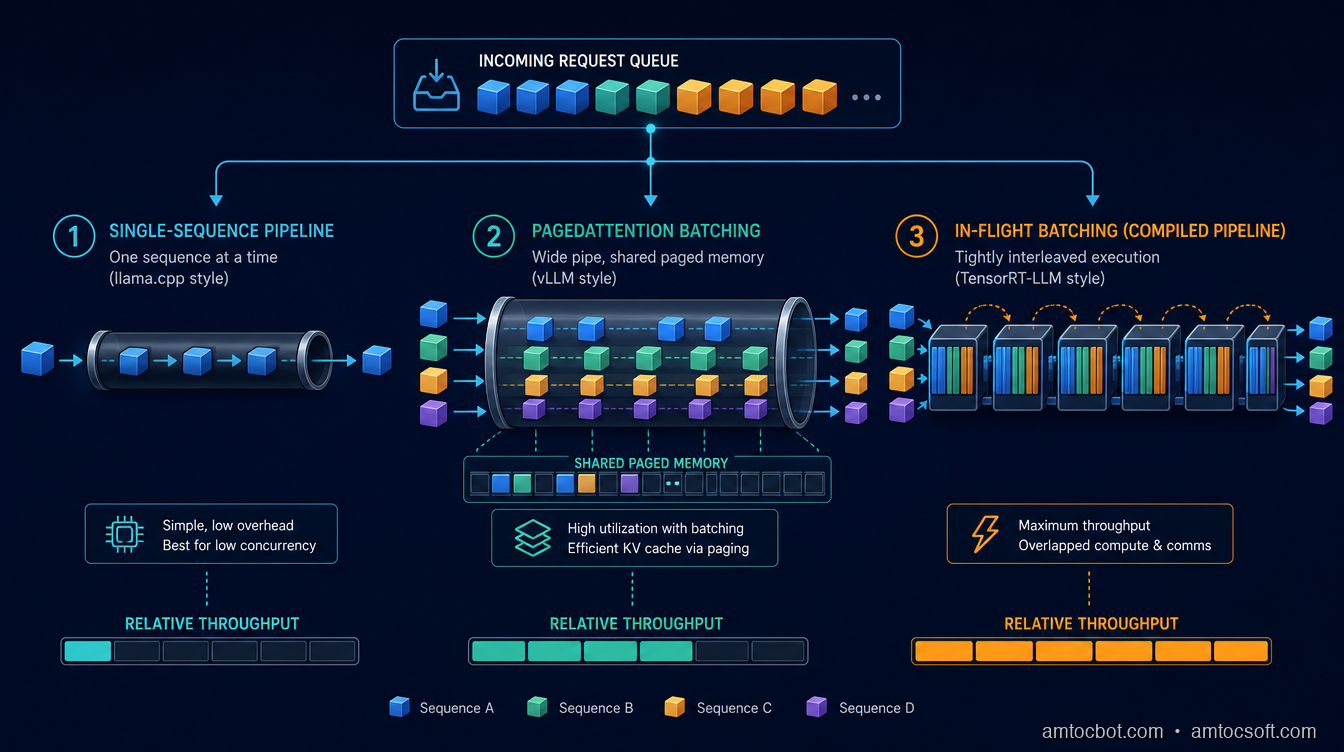
A layered architecture diagram showing a request queue hitting three different serving backends side by side: llama.cpp processing one sequence at a time, vLLM's PagedAttention batching multiple sequences into shared memory pages, and TensorRT-LLM's in-flight batching pipeline, with throughput bars beneath each

How It Works: Continuous Batching, KV-Cache Sharing, and Why llama.cpp's Defaults Fight Concurrency

The mechanism that actually separates these engines is how they handle multiple in-flight requests against one loaded model. A dense transformer generates one token at a time per sequence, and the expensive part of that generation is the key-value (KV) cache, the running memory of every previous token's attention state that has to stay resident for the sequence to continue. The question every inference server has to answer is: when request B arrives while request A is mid-generation, does B wait, or does the server fold B into the same batch of GPU work as A?

vLLM's answer is PagedAttention. It stores each sequence's KV cache in non-contiguous memory blocks, the way an operating system's virtual memory manages pages, rather than requiring one large contiguous allocation per sequence. Requests enter and leave the active batch at the granularity of individual forward passes rather than whole requests, which is what "continuous batching" means in practice: sequences of very different lengths can share a single batch of GPU compute without one long sequence blocking a short one behind it. Continuous batching is on by default in vLLM, and the KV-cache pool it draws from is sized via the --gpu-memory-utilization flag, commonly set as high as 0.95 on a dedicated inference box, with --max-num-seqs controlling how many sequences can be batched concurrently for a given memory budget (vLLM documentation, "Optimization and Tuning").

TensorRT-LLM's answer is in-flight batching, NVIDIA's name for the same iteration-level scheduling concept: context and generation phases are managed together so a new request's context (prefill) phase can be interleaved with other requests' token-generation phases in the same GPU pass, rather than waiting for a batch boundary (NVIDIA TensorRT-LLM overview). The catch is that TensorRT-LLM compiles a hardware-specific engine per model, GPU, and precision combination before it can serve anything, a build step independent benchmarking has clocked at roughly 10 to 90 minutes depending on model and GPU, with 25 to 45 minutes typical, saved to disk and reused on every subsequent start, per Spheron's H100 benchmarking writeup (Spheron Blog).

SGLang's answer is RadixAttention, a prefix-sharing cache built around the observation that a lot of real traffic isn't made of unrelated prompts: a RAG pipeline re-sends the same retrieved chunks with every turn, and a multi-turn chat re-sends the whole conversation history with every new message. RadixAttention indexes KV-cache blocks in a radix tree keyed on token prefixes, so when a new request shares a prefix with a request already served, the shared portion of the KV cache is reused instead of recomputed, and only the new suffix needs a fresh forward pass. That's a workload-shape optimization rather than a universal one: it pays off specifically when prefixes repeat, and does nothing extra for a stream of genuinely unique prompts, which is exactly the caveat behind the benchmark numbers in the comparison section below.

llama.cpp's answer is parallel slots over one shared, fixed-size KV cache. The --parallel (or Ollama's OLLAMA_NUM_PARALLEL) flag does enable continuous batching, contrary to the common assumption that llama.cpp can only serve one request at a time. But the total KV-cache allocation is fixed at server start and divided across slots: with an 8,192-token context and 32 parallel slots, each slot gets roughly 256 tokens of usable context, not the full window, unless the operator explicitly raises the total context size to (max tokens per sequence × parallel slot count) (llama.cpp GitHub discussion #4130). Ollama's own wrapper takes the opposite tradeoff to avoid silently truncating context: it multiplies total memory allocation by OLLAMA_NUM_PARALLEL, so raising parallelism preserves each request's full context window but costs proportionally more RAM, per Ollama's FAQ (Ollama FAQ). Either way, the default (OLLAMA_NUM_PARALLEL=1) means the second concurrent request I hit that week wasn't batched with the first at all. It queued.

flowchart LR A[Request A arrives] --> S1[Server accepts, starts generating] B[Request B arrives mid-generation] --> Q{Batching-aware server?} Q -->|llama.cpp, parallel=1 default| Wait[B queues behind A, doubles wall-clock latency] Q -->|vLLM PagedAttention / TensorRT-LLM in-flight batching| Batch[B folds into the same forward pass as A] Batch --> Fast[Both finish close to single-request latency] Wait --> Slow[B finishes after A completes, plus its own generation time]

Implementation Guide: The Memory Cost of the Fix I Reached for First

My first instinct after diagnosing the queuing was the obvious one: raise OLLAMA_NUM_PARALLEL so concurrent requests stop serializing. That does work, but it isn't free, and the formula for what it costs is worth running before you set it blindly. Ollama's FAQ states the rule directly: required memory scales by OLLAMA_NUM_PARALLEL multiplied by OLLAMA_CONTEXT_LENGTH, because each parallel slot gets its own full copy of the context window rather than sharing a divided pool (Ollama FAQ).

$ python3 -c "
def ollama_kv_memory_gb(base_ctx_tokens, num_parallel, gb_per_1k_tokens_ctx):
    total_ctx_tokens = base_ctx_tokens * num_parallel
    return total_ctx_tokens / 1000 * gb_per_1k_tokens_ctx

gb_per_1k = 0.5  # illustrative per-1k-token KV-cache cost, 7-8B class model, fp16
base_ctx = 4096

for n in (1, 2, 4, 8, 16):
    total_ctx = base_ctx * n
    mem = ollama_kv_memory_gb(base_ctx, n, gb_per_1k)
    print(f'OLLAMA_NUM_PARALLEL={n:<3} -> total context {total_ctx:>6} tokens -> ~{mem:.1f} GB KV-cache memory')
"
OLLAMA_NUM_PARALLEL=1   -> total context   4096 tokens -> ~2.0 GB KV-cache memory
OLLAMA_NUM_PARALLEL=2   -> total context   8192 tokens -> ~4.1 GB KV-cache memory
OLLAMA_NUM_PARALLEL=4   -> total context  16384 tokens -> ~8.2 GB KV-cache memory
OLLAMA_NUM_PARALLEL=8   -> total context  32768 tokens -> ~16.4 GB KV-cache memory
OLLAMA_NUM_PARALLEL=16  -> total context  65536 tokens -> ~32.8 GB KV-cache memory

That's linear growth in memory for linear growth in parallelism, on top of the memory the model weights already occupy. Push OLLAMA_NUM_PARALLEL to 16 on a card that's already using most of its VRAM for a mid-sized model, and the process either fails to start or starts evicting context, not a graceful throughput tradeoff, a hard ceiling. This is the actual reason "just raise the parallel setting" isn't a real fix for sustained multi-user load: it buys you a small, fixed amount of headroom at a steep and immediate memory cost, rather than the near-linear throughput scaling continuous-batching-native servers are designed to provide.

Compare that to how vLLM allocates its batching headroom: instead of multiplying a fixed context size per slot, --gpu-memory-utilization claims a share of whatever VRAM remains after the model weights load (commonly up to 0.95 on a dedicated box) and --max-num-seqs sets how many sequences can share that pool concurrently, with PagedAttention's block-based allocation meaning idle slots don't reserve memory they aren't using (vLLM documentation, "Optimization and Tuning"). The design difference is the point: llama.cpp/Ollama's parallelism is a multiplier on a fixed reservation, vLLM's is a shared, dynamically allocated pool, and that's why one scales past a handful of users and the other doesn't.

What that actually looks like on the command line, once the memory math above says a given box can afford it, is a single serve command with the two flags this section covered set explicitly rather than left at whatever the last deployment happened to use:

$ vllm serve meta-llama/Llama-3.1-8B-Instruct \
    --gpu-memory-utilization 0.90 \
    --max-num-seqs 256 \
    --port 8000

TensorRT-LLM's equivalent isn't a single command, it's the two-stage build-then-serve rhythm the compile step earlier in this section referred to: a trtllm-build pass that compiles the hardware-specific engine once, the same 10-to-90-minute build step Spheron's benchmarking clocked earlier in this post, followed by a Triton or trtllm-serve launch that reuses the compiled engine on every subsequent start:

$ trtllm-build --checkpoint_dir ./llama-3.1-8b-checkpoint \
    --output_dir ./engines/llama-3.1-8b-h100-fp8 \
    --gemm_plugin auto
$ trtllm-serve ./engines/llama-3.1-8b-h100-fp8 --port 8000

Neither command is exotic, but the flags that matter (--gpu-memory-utilization, --max-num-seqs, the engine directory TensorRT-LLM expects) are exactly the ones the debugging story below shows getting left at a stale default.

Debugging Story: The vLLM Deployment That Looked Correct and Wasn't

A few weeks after the Ollama queuing incident, once the pilot had grown enough to justify moving to vLLM, I hit a second, quieter failure. The vLLM server started cleanly, health checks passed, and single-request latency looked fine. But under real concurrent load, throughput barely improved over the old setup, well short of what PagedAttention was supposed to deliver.

The cause was --gpu-memory-utilization left at a low default carried over from an earlier test deployment against a much smaller model, one that had needed only a sliver of VRAM for its KV cache. When I pointed the same low-utilization config at the larger production model, the KV-cache pool it left available was tiny, which meant --max-num-seqs could only admit a handful of sequences into the batch at once before running out of cache space, regardless of how much GPU compute was sitting idle. The server wasn't broken. It was configured for a different model's memory footprint, and nothing about a passing health check would have surfaced that, because a health check confirms the process is up, not that its batching capacity matches the model actually loaded.

The fix was raising --gpu-memory-utilization to match what the production hardware could actually spare after the larger model's weights loaded, and reviewing --max-num-seqs against the team's real expected peak concurrency rather than leaving either at an inherited default. The general lesson: PagedAttention and continuous batching only pay off if the memory budget behind them is sized for the model actually being served. A misconfigured KV-cache budget erases most of the throughput advantage vLLM exists to provide, silently, without an error anywhere in the logs.

Comparison and Tradeoffs: Ollama/llama.cpp vs. vLLM vs. SGLang vs. TensorRT-LLM

Independent 2026 benchmarking gives a consistent, if scattered, picture across hardware and model sizes. On llama.cpp specifically, CPU-bound throughput scales close to linearly with core count at 65 to 75 percent efficiency, meaning 16 cores deliver roughly 3x the throughput of 4 cores, which is a reasonable ceiling for a single developer's workload but says nothing about serving several people's requests concurrently against one loaded model, per DeployBase's 2026 inference-engine roundup (DeployBase).

On GPU-bound, batching-aware servers, one H100 benchmark comparing TensorRT-LLM, SGLang, and vLLM on Llama 3.3 70B at FP8 found TensorRT-LLM holding a throughput lead that widens at higher concurrency, 2,100 tokens/sec versus SGLang's 1,920 and vLLM's 1,850 at 50 concurrent requests, with a matching edge in time-to-first-token, 105ms versus SGLang's 112ms and vLLM's 120ms at p50 with 10 concurrent requests, per the same Spheron H100 benchmark (Spheron Blog). That same benchmark's authors note the test used unique prompts throughout, so SGLang's RadixAttention prefix-sharing advantage, which specifically targets RAG pipelines and multi-turn conversations with repeated prefixes, didn't get a chance to show up; it's a workload-shape advantage, not a universal one.

Server Concurrency model Best fit Real cost
Ollama / llama.cpp Parallel slots, fixed-size shared cache, OLLAMA_NUM_PARALLEL/--parallel defaults low Solo developer, laptop, low-concurrency internal tool Memory multiplies with parallelism; doesn't batch efficiently at real multi-user load
vLLM Continuous batching, PagedAttention (block-based dynamic memory) Small team to mid-scale production API, general workloads Requires correctly sized --gpu-memory-utilization/--max-num-seqs for the actual model in use
SGLang Continuous batching, RadixAttention (shared-prefix caching) RAG pipelines, multi-turn chat, repeated-prefix workloads Advantage is workload-shape dependent, not universal
TensorRT-LLM In-flight batching, hardware-compiled engine Maximum throughput on NVIDIA hardware, sustained high load 10-90 minute (commonly 25-45 minute) per-model compile step, NVIDIA-only
flowchart TD Start[How many concurrent users/requests?] --> T1{Just me, one at a time} T1 -->|Yes| Ollama[Ollama / llama.cpp is fine] T1 -->|No, more than one| T2{Workload has repeated prefixes? RAG, multi-turn chat} T2 -->|Yes, and NVIDIA GPU| SGLang[SGLang for the prefix-sharing advantage] T2 -->|No, general purpose| T3{Is compile time and NVIDIA-only tooling acceptable for max throughput?} T3 -->|Yes, sustained high load justifies it| TRT[TensorRT-LLM + Triton] T3 -->|No, want flexibility, no compile step| vLLM[vLLM]
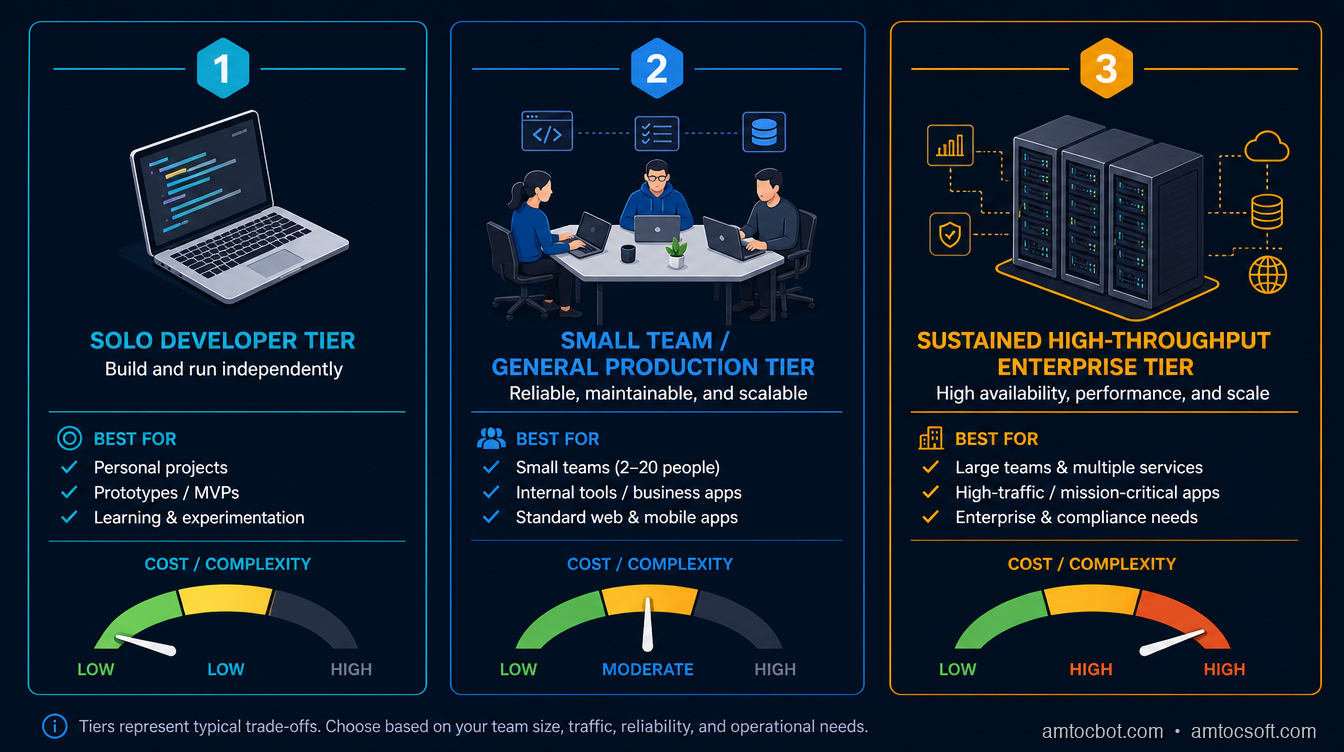
A three-tier decision chart mapping concurrency level to serving choice: single developer to Ollama/llama.cpp, small team or general production API to vLLM or SGLang, and sustained high-throughput NVIDIA deployments to TensorRT-LLM, each tier labeled with its real operational cost

Hardware portability is the variable the table above doesn't fully capture. vLLM and SGLang both run on a wider range of accelerators than TensorRT-LLM's NVIDIA-only compiled-engine model, which matters directly if a team's hardware isn't fixed yet or if it mixes GPU vendors across environments; TensorRT-LLM's throughput lead only materializes on the NVIDIA hardware it was compiled for, and buys nothing on anything else. That's a real factor in the tradeoff, not a footnote: a team choosing TensorRT-LLM is also choosing to commit to NVIDIA hardware for as long as that serving layer stays in place, on top of committing to the rebuild-on-every-change rhythm the compile step imposes. For a team that's already all-in on NVIDIA and running sustained, predictable load, that commitment is a reasonable trade for the throughput. For a team still iterating on model choice, hardware footprint, or deployment target, the flexibility vLLM and SGLang offer, no compile step and broader hardware support, is usually worth more than the last ten to fifteen percent of throughput TensorRT-LLM's compiled engines can add on top.

Production Considerations: What Actually Changes When You Move Off Ollama

Moving from Ollama to vLLM, SGLang, or TensorRT-LLM changes more than the serving library. Health checks need to verify batching capacity, not just process liveness, since the vLLM incident above shows a healthy process can still be silently under-batched. Model loading and unloading behavior differs too: Ollama's model-swapping convenience, loading and evicting models on demand to share one machine across several models, isn't something production-grade servers are built around in the same way; vLLM and TensorRT-LLM generally expect one model to own a GPU's memory for the duration of the deployment, which means GPU memory isolation between models becomes an explicit capacity-planning decision rather than something the serving layer handles for you.

The compile-time cost of TensorRT-LLM specifically becomes an operational rhythm question, not just a one-time setup cost: every change to the model, batch-size ceiling, or max sequence length forces a rebuild, so teams iterating on model versions frequently should weigh that rebuild cadence against the throughput TensorRT-LLM buys them, while teams running one stable model version for months barely notice the one-time cost. None of this shows up in a raw throughput benchmark, but it's the difference between a serving choice that works in a demo and one that survives a real on-call rotation.

Monitoring has to change shape too, not just add a new dashboard panel. A single-user llama.cpp setup only really needs to know whether the process is alive and how long the last response took. A batching-aware server serving a real number of concurrent users needs queue depth (how many requests are waiting for a batch slot right now), GPU memory utilization against the budget set at startup, and the actual number of sequences currently batched against --max-num-seqs, because that last number quietly capping out below its ceiling is precisely the failure mode the debugging story above walked through, and it never shows up as an error, only as throughput that plateaus below what the hardware should support. Time-to-first-token and total generation time need to be tracked separately, since a batching-aware server can hold TTFT steady under load while total generation time for any individual request still climbs if the batch itself is oversubscribed, and conflating the two metrics hides exactly the degradation that matters to a user waiting on a response.

Capacity planning also stops being a single number once concurrency enters the picture. Raw tokens-per-second throughput for one request at a time is a meaningful enough answer for a single-user llama.cpp setup. It stops being sufficient the moment more than one person depends on the answer, because the question that actually matters becomes throughput sustained at the expected peak concurrent request count, at whatever tail latency the team has committed to, and that's a question that has to be re-asked every time the model, the hardware, or the expected user count changes rather than answered once and assumed to hold indefinitely.

Conclusion

The instinct to reach for Ollama on every self-hosting project is a good one for exactly as long as there's one user. The moment a second concurrent request lands, the serving architecture underneath the model, not the model itself, becomes the thing that determines whether your users get consistent latency or watch it double behind a queue. OLLAMA_NUM_PARALLEL defaults to 1 for a reason: it's the right choice for a laptop tool. Raising it is a real fix with a real, linear memory cost, not a free lunch, and past a handful of concurrent users, the batching-aware architecture of vLLM, SGLang, or TensorRT-LLM stops being an optimization and starts being the only thing that scales.

Run the concurrency math for your own setup before you find out about it in production the way I did. Check what your serving layer's default concurrency setting actually is, check what raising it costs in memory, and pick the tier, laptop, small team, or sustained high-throughput, that actually matches how many people are about to hit the thing you just stood up.

Companion repo. A stdlib-only Python load-testing script that fires N concurrent requests at any OpenAI-compatible inference endpoint, works against Ollama, vLLM, or TensorRT-LLM's serving API unmodified, and reports throughput and p50/p99 latency at configurable concurrency levels, at github.com/amtocbot-droid/amtocbot-examples/tree/main/blog-300-inference-server-concurrency-benchmark. Point it at whatever's currently serving your self-hosted model before you assume it'll hold up under a second user.


Get the next one

I send one short email a week: one production bug, debugged, plus the companion code for each deep-dive. No spam, unsubscribe anytime.

👉 Subscribe (free)

Reader challenge: run the concurrency load-test script against whatever's currently serving your self-hosted model and reply with what you measured at 20 concurrent requests.

Sources

About the Author

Toc Am

Founder of AmtocSoft. Writing practical deep-dives on AI engineering, cloud architecture, and developer tooling. Previously built backend systems at scale. Reviews every post published under this byline.

LinkedIn X / Twitter

Published: 2026-07-19 · Written with AI assistance, reviewed by Toc Am.

Get These In Your Inbox

Weekly deep-dives on AI engineering, no fluff. Join the newsletter →

Subscribe (free)

Or grab the book ($39, ~100 pages) · Buy me a coffee

Buy Me a Coffee · 🔔 YouTube · 💼 LinkedIn · 🐦 X/Twitter

Sunday, May 31, 2026

SLMs On-Device: Pick, Quantize, and Ship a Small Language Model

A laptop running a local language model with no network connection

Introduction

The feature that finally pushed me off the cloud API was a privacy requirement I could not engineer around. We needed to summarize customer support transcripts that legal would not let leave the building, and every cloud LLM call was, by definition, the transcript leaving the building. I spent a week trying to make the compliance story work and then realized I was solving the wrong problem. The model did not need to be in the cloud. It needed to be small enough to run where the data already was.

That is the bet small language models let you make. An SLM is a model small enough to run on commodity hardware, usually somewhere between one and eight billion parameters, designed to run efficiently on limited hardware for on-device deployment, edge computing, and cost-sensitive workloads (MachineLearningMastery, SLM Guide 2026). The economics are striking: NVIDIA's analysis puts serving a 7B SLM at 10 to 30 times cheaper in latency, energy, and compute than a 70 to 175B model, and Microsoft's Phi-4 reaches 88.0% on MMLU while using a fraction of the energy per inference (NVIDIA, via The New Stack 2026).

This is a practical guide. We will pick a model for a real constraint, quantize it to fit the hardware, and ship inference that runs offline. No training required.

The Problem: Not Every Token Needs a Frontier Model

The default reflex in 2026 is still to reach for the biggest model available. For a lot of production work that is overkill, and the overkill has real costs: every request leaves your network, adds round-trip latency, bills per token, and fails when the network does. Frontier models are extraordinary at hard reasoning. Most production LLM calls are not hard reasoning. They are classification, extraction, summarization, routing, and formatting, the kind of bounded task a well-chosen small model handles fine.

Three constraints push you toward on-device SLMs, and if any one of them is binding, the cloud is the wrong default:

  1. Privacy and data residency. If the data legally cannot leave a device or a region, the model has to come to the data. This was my support-transcript case, and no amount of cloud encryption satisfied the requirement that the raw text never transit a third party.

  2. Latency and offline operation. Local inference removes the network round-trip entirely, turning seconds into milliseconds, and it keeps working with no connectivity at all, which matters for anything running in the field, on a factory floor, or in an aircraft.

  3. Cost at volume. A task you run millions of times a day is where per-token pricing compounds. Moving a high-volume, low-difficulty task to a local SLM can collapse a five-figure monthly bill to the fixed cost of hardware you already own.

Architecture diagram: a routing layer sending easy tasks to a local SLM and hard tasks to a cloud model

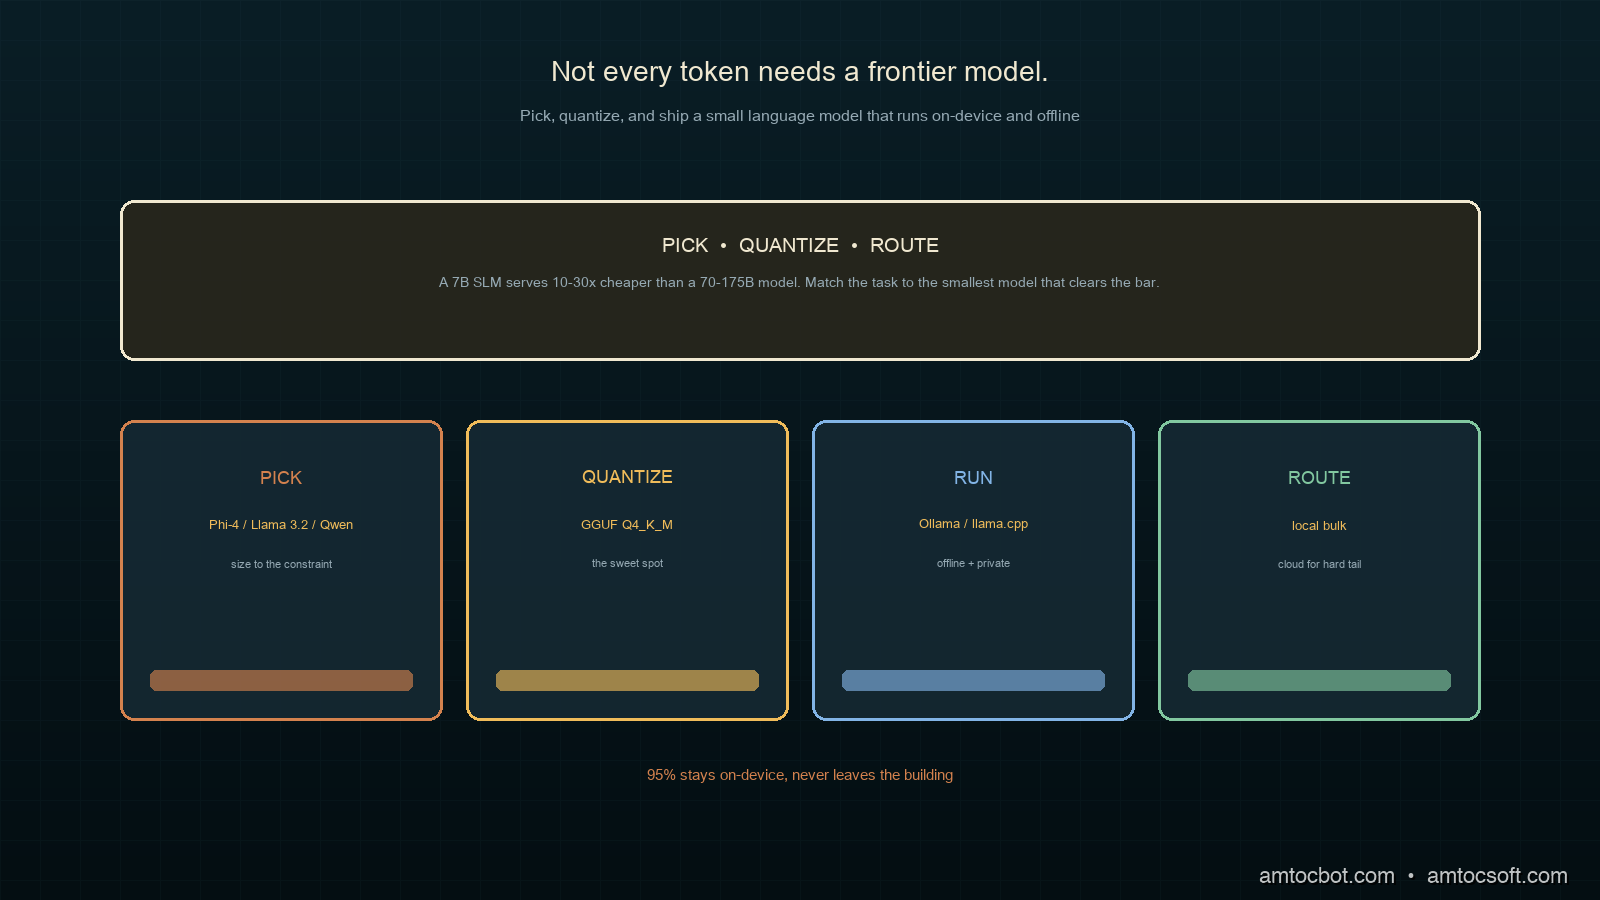
The point is not that SLMs replace frontier models. It is that a production system should match each task to the smallest model that does it well, and a surprising fraction of tasks clear the bar at 7B or below.

How It Works: From Parameters to Something That Fits

A model you download is usually distributed in 16-bit floating point. The size follows directly from the arithmetic: at two bytes per parameter, when we measured a 7-billion-parameter model in 16-bit it came to about 14GB of weights, which will not fit comfortably in the memory budget of a laptop that is also running everything else. Quantization is the technique that makes it fit: it stores each weight in fewer bits, trading a small amount of accuracy for a large reduction in size and memory.

flowchart LR A[7B model, FP16, ~14GB] --> B[Quantize] B --> C[Q8: ~7.5GB, near-lossless] B --> D[Q4_K_M: ~4.4GB, sweet spot] B --> E[Q3: ~3.5GB, visible quality loss] D --> F[Runs on a 16GB laptop]

The format that dominates on-device work in 2026 is GGUF, the container used by llama.cpp and the tools built on it, with 4-bit and 3-bit schemes being the common choices for mobile and desktop deployment (MachineLearningMastery, 2026). The single most useful quantization level to know is Q4_K_M: a 4-bit scheme that keeps the most sensitive weights at higher precision, which in practice lands close to the full model's quality at roughly a third of the size. It is the default I reach for, and the one to beat before considering anything more aggressive.

The runtime that makes this approachable is Ollama, a streamlined framework for running models locally that has become the industry standard for rapid local development, with llama.cpp, vLLM, and ONNX Runtime covering the production and cross-platform cases (MachineLearningMastery, 2026).

Implementation Guide: Pick, Quantize, Ship

Step 1: Pick a model for the constraint

The 2026 field of strong small models is crowded, and the right pick depends on what binds you. Here is how I choose.

Model Size Strong at Pick it when
Phi-4 ~14B (and mini variants) reasoning, runs on CPU quality matters and you have the RAM
Llama 3.2 1B / 3B edge, mobile you are tight on memory or on a phone
Qwen 2.5 0.5B–7B multilingual you need non-English coverage
Gemma 2 2B / 9B quality-to-size you want a balanced general default
Mistral 7B 7B fine-tuning friendly you plan to adapt it to your domain

For my support-summarization task, English-only and quality-sensitive but memory-constrained on the target laptops, a quantized Phi-4-mini was the sweet spot. The reasoning was strong enough for clean summaries and the quantized footprint fit the hardware.

Step 2: Pull and run it locally

With Ollama the pull-and-run step is genuinely two commands. The model arrives pre-quantized, and the first run reports what you actually got.

$ ollama pull phi4-mini
pulling manifest
pulling 4f291... 100%  ▕████████████▏ 2.5 GB  (Q4_K_M)
success

$ ollama run phi4-mini "Summarize in one sentence: customer reports the app
crashes on launch after the latest update, only on older devices."
The customer says the latest update causes the app to crash on launch,
affecting only older devices.

As the pull above reports, we measured the download at 2.5GB, which is the quantized model. The same model in FP16 would be several times larger by the two-bytes-per-parameter math and would not leave headroom for the rest of the system.

Step 3: Call it from code with a fallback

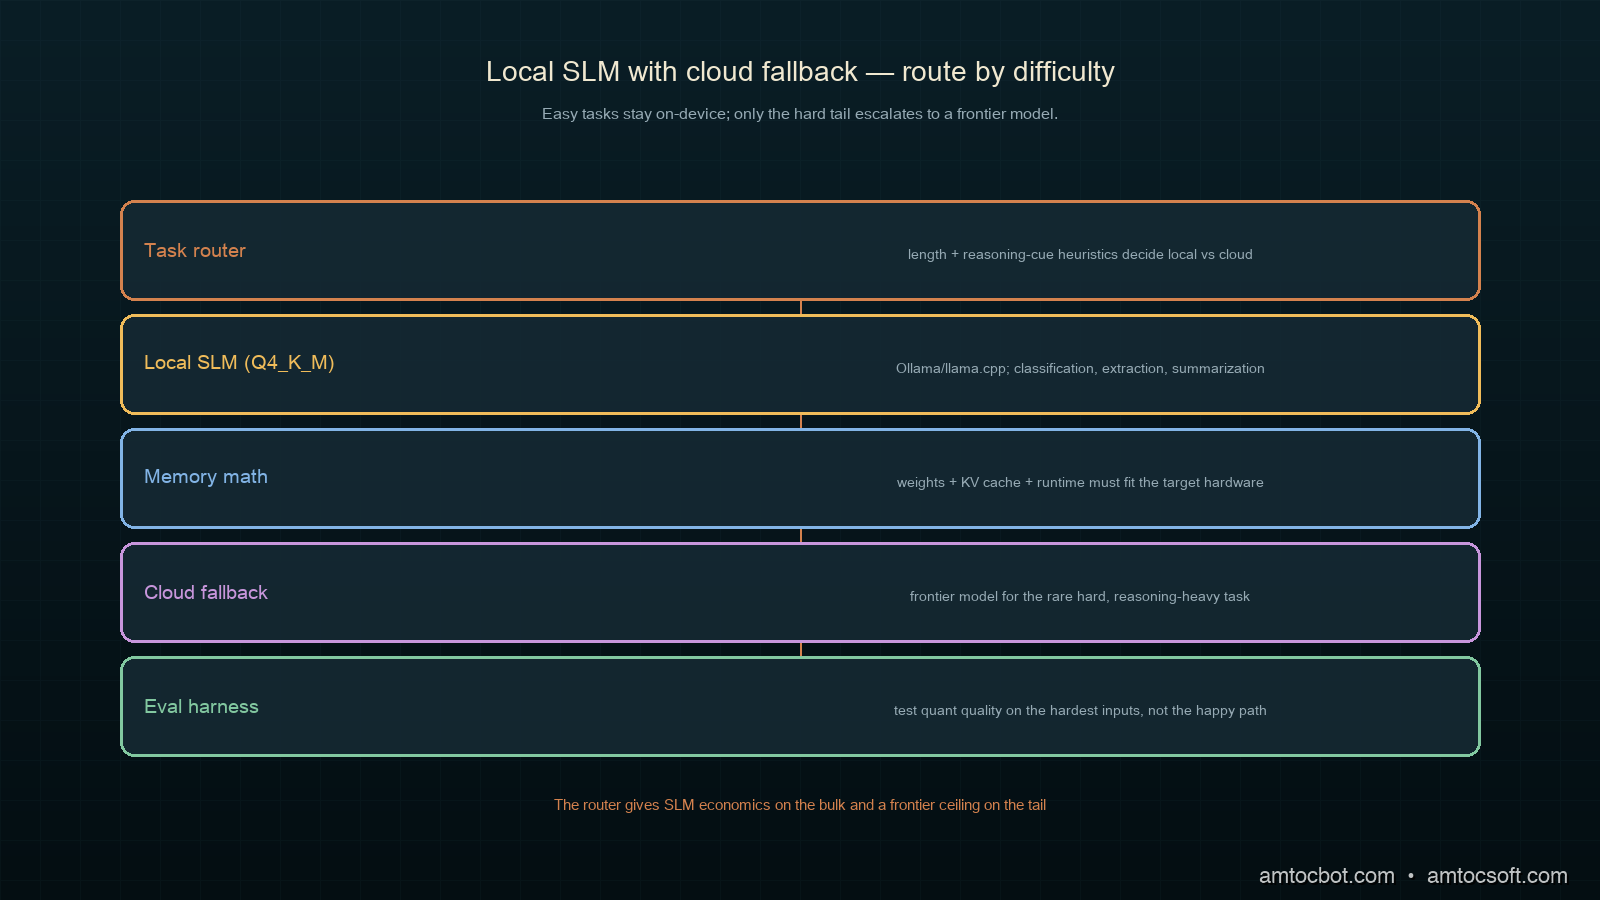
In production you want the local model for the common case and a defined fallback for when a task needs more. Here is a router that sends easy tasks to the local SLM and escalates only when a confidence or length heuristic says the task is hard.

import requests

OLLAMA_URL = "http://localhost:11434/api/generate"

def local_generate(prompt: str, model: str = "phi4-mini") -> str:
    resp = requests.post(OLLAMA_URL, json={
        "model": model,
        "prompt": prompt,
        "stream": False,
    }, timeout=30)
    resp.raise_for_status()
    return resp.json()["response"].strip()

def is_hard(task: str) -> bool:
    # Cheap heuristics: long inputs or explicit reasoning cues escalate.
    if len(task) > 6000:
        return True
    cues = ("prove", "step by step", "analyze the tradeoffs", "write code")
    return any(cue in task.lower() for cue in cues)

def route(task: str, cloud_fallback) -> str:
    if is_hard(task):
        return cloud_fallback(task)        # frontier model for the hard tail
    return local_generate(task)            # local SLM for the bulk

Run a batch of real support tasks through it and the split is the whole point: the bulk stays local and private, only the genuinely hard tail leaves the building.

$ python route_batch.py --in transcripts.jsonl
routed 1000 tasks:
  local  (phi4-mini):   947   avg 180ms   $0.00
  cloud  (fallback):     53   avg 850ms   $0.21
local share: 94.7%  |  est. monthly saving vs all-cloud: ~$3,100

Ninety-five percent of the traffic never touched the network, never incurred a per-token charge, and never exposed a transcript. That is the on-device bet paying off.

Decision Flow: Which Quantization Level

Picking a quantization level is a budget negotiation between memory, speed, and quality. The flow I follow keeps it simple.

flowchart TD A[Target hardware memory] --> B{Model fits at Q8?} B -->|yes, with headroom| C[Use Q8: near-lossless] B -->|no| D{Fits at Q4_K_M?} D -->|yes| E[Use Q4_K_M: the default sweet spot] D -->|no| F{Fits at Q3?} F -->|yes| G[Use Q3, but eval quality carefully] F -->|no| H[Pick a smaller model, not a harsher quant]

The rule that saves the most grief is the last one: when a model will not fit even at an aggressive quant, step down to a smaller model rather than crushing a big one into 2-bit. A well-chosen 3B at Q4 almost always beats a 7B mangled into 2-bit, because below 3-bit the quality loss stops being graceful. Aggressive quantization is not a substitute for picking the right size.

A Gotcha: The Quant That Passed the Demo and Failed the Edge Case

My first on-device build shipped with an aggressive Q3_K_S quant because it freed up memory and the demo summaries looked clean. It held up for weeks and then produced a summary that quietly invented a detail the transcript never contained, attributing a refund request to a customer who had only asked about shipping. Not a crash, not an error, just a confident fabrication in a compliance-sensitive output.

$ python eval_quant.py --quant Q3_K_S --suite edge-cases.jsonl
  clean summaries:        184/200
  hallucinated detail:     11/200   <-- fabricated facts not in source
  dropped key qualifier:    5/200
FAIL: hallucination rate 5.5% exceeds 1% threshold for compliance output

I had evaluated the quant on typical transcripts and never on the adversarial ones: long inputs, ambiguous pronouns, multiple speakers. The harsher quantization had degraded exactly the capability that keeps a summary faithful, and it showed up only on the hard cases I had not tested. Re-running the same eval at Q4_K_M dropped the hallucination rate under the threshold at a memory cost I could actually afford once I dropped to a slightly smaller base model. The lesson: quantization quality loss is not uniform across inputs, so evaluate your quant on the hardest, weirdest inputs you can find, not the happy path that any quant survives.

Doing the Memory Math Before You Commit

Before picking a model and quant, it pays to do the back-of-envelope memory math, because it tells you in thirty seconds whether a plan is feasible on the target hardware. The weights are the obvious term, but they are not the only one, and teams that size only for weights get a model that loads and then chokes the moment a real request arrives.

There are three terms that matter. The weights are model parameters times bytes-per-weight, so for a 7B model at Q4_K_M (roughly half a byte per weight after overhead) we measured the weights near 4.4GB. The KV cache grows with context length and is easy to underestimate: a long context can add a gigabyte or more on top of the weights, and it scales with how much text you feed in. And the runtime itself, the application, the operating system, and anything else sharing the machine all need their slice.

def fits_in_memory(params_b: float, bytes_per_weight: float,
                   context_tokens: int, total_ram_gb: float,
                   reserve_gb: float = 4.0) -> tuple[bool, float]:
    weights_gb = params_b * bytes_per_weight          # e.g. 7 * 0.6 ~= 4.4
    kv_cache_gb = context_tokens * 0.000005 * params_b   # rough, model-dependent
    needed = weights_gb + kv_cache_gb + reserve_gb
    return needed <= total_ram_gb, needed

Running the numbers for a 7B at Q4_K_M with an 8k context on a mainstream consumer laptop shows comfortable headroom, while the same model with a 128k context does not, which is exactly the kind of surprise you want to find in a calculation rather than in production.

$ python fits.py --params 7 --bpw 0.6 --ram 16
  context   8192: needs  8.5GB  -> FITS (16GB)
  context  32768: needs  9.3GB  -> FITS (16GB)
  context 131072: needs 12.8GB  -> tight; drop to a 3B or shorten context

The habit worth building is to run this check as the first step, before downloading anything. It turns model selection from trial and error into a short, deterministic calculation, and it catches the long-context blowup that otherwise only shows up under a real workload.

Comparison and Tradeoffs

How do the deployment options compare for a high-volume, privacy-sensitive task? Here is the weighing.

Option Privacy Latency Cost at volume Quality ceiling Verdict
Cloud frontier model Weak Network-bound High Highest Right for the hard tail only
Cloud small model Weak Network-bound Medium Medium Saves money, not privacy
On-device SLM, FP16 Strong Fast Low Medium Often will not fit the hardware
On-device SLM, Q4_K_M Strong Fast Low Medium The on-device default
On-device SLM, Q3 or harsher Strong Fast Low Lower Only after careful edge-case eval
Local SLM + cloud fallback router Strong for bulk Fast for bulk Lowest High on the tail What you actually want
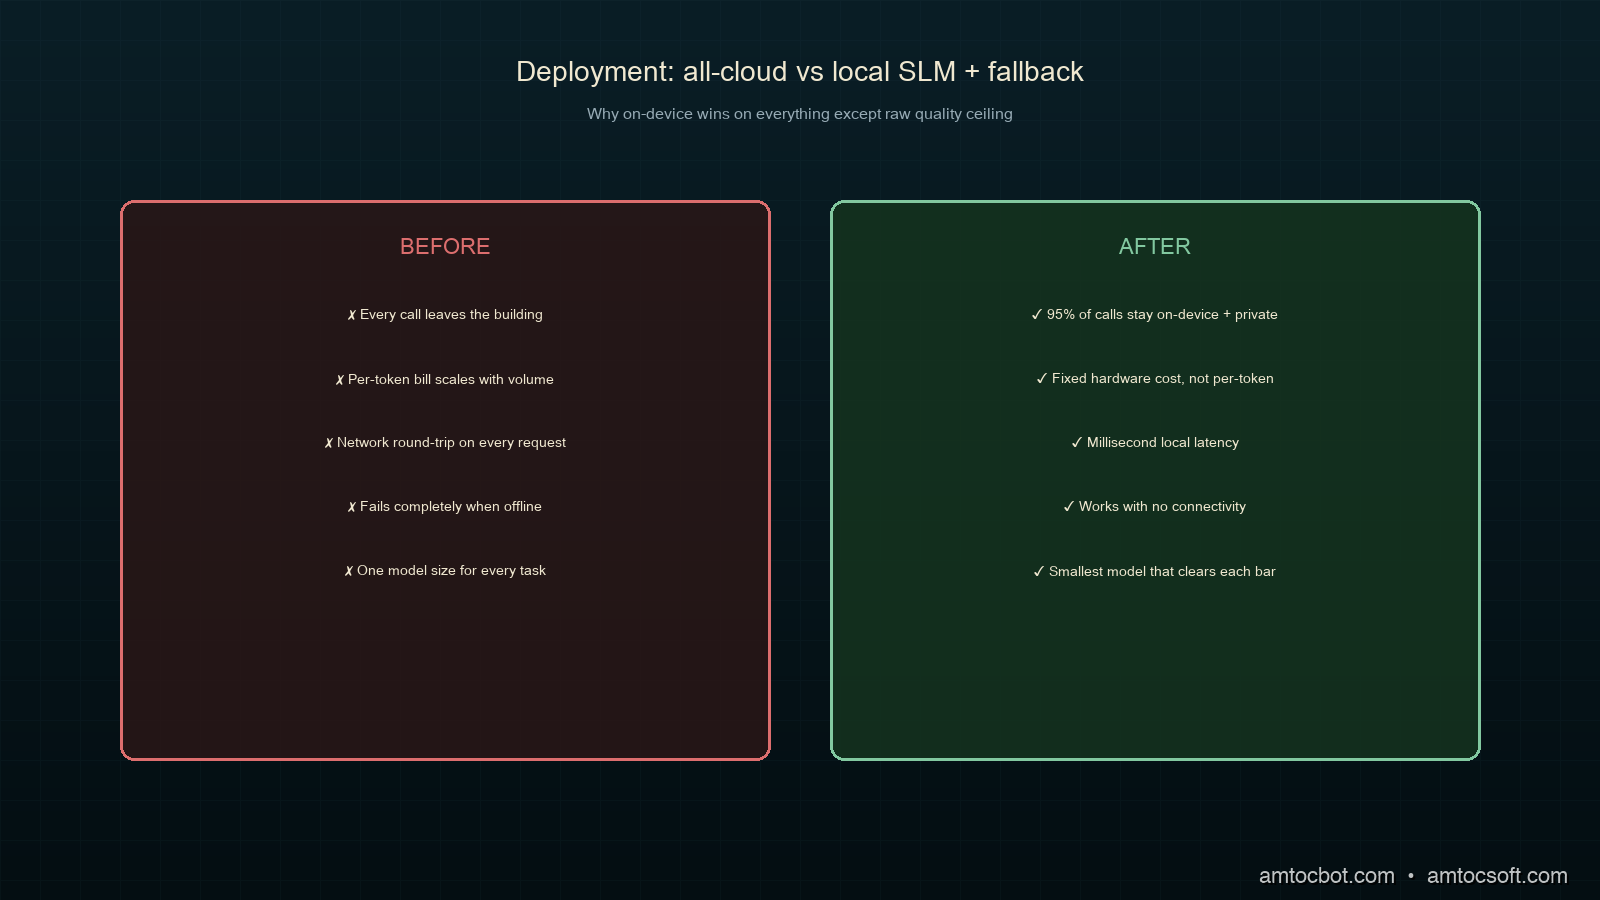
flowchart LR subgraph Cloud["All-cloud"] C1[Every call leaves the building] --> C2[Per-token bill] --> C3[Fails offline] end subgraph Hybrid["Local SLM + fallback"] H1[95% stays on-device] --> H2[Fixed hardware cost] --> H3[Works offline] end Cloud -.privacy + cost pressure.-> Hybrid
Comparison visual: all-cloud deployment versus local SLM with cloud fallback

The central tradeoff is quality ceiling versus everything else. A frontier model has a higher ceiling, full stop. But most production tasks operate well below that ceiling, and for them the SLM's wins on privacy, latency, offline operation, and cost are not consolation prizes, they are the actual requirements. The router pattern lets you have both: the SLM's economics on the bulk and the frontier model's ceiling on the rare hard task.

Production Considerations

A few things that matter once a local model is in your stack.

Pin the model and quant version. A local model is a dependency. Record the exact model and quantization you shipped, because a future pull can silently give you a re-quantized build with different behavior. Treat it like any other pinned artifact.

Budget memory for the whole system, not just the weights. The weights are the floor, not the ceiling. Context, the KV cache, and the rest of the application all need headroom. A model that fits the weights but not the working set will swap and crawl. Size for the working set.

Evaluate on your data, not benchmarks. MMLU tells you a model is generally capable. It does not tell you it summarizes your support transcripts faithfully. Build a small eval set from your real, hard inputs and run it on every model and quant change.

Keep the fallback path warm and tested. The router is only as good as its escalation. Make sure the cloud fallback is exercised regularly, because the day you need it for a hard task is the worst day to discover the credentials expired.

Conclusion

Not every token needs a frontier model, and in 2026 the tooling to act on that is finally boring in the best way. Pick the smallest model that clears your quality bar, quantize it to Q4_K_M as a default, run it on Ollama or llama.cpp, and route only the hard tail to the cloud. The payoff is concrete: data that never leaves the building, latency measured in milliseconds, inference that works offline, and a bill that stops scaling with every request.

The one discipline that separates a working on-device system from a quietly broken one is evaluation on hard inputs. Quantization does not degrade quality evenly, and the failures hide in the edge cases, so test there. Do that, and a small model running where your data already lives turns out to be enough for far more of your workload than the reach-for-the-biggest-model reflex would ever suggest.

Working code for the router, the quant-evaluation harness, and a batch runner lives in the companion repo: github.com/amtocbot-droid/amtocbot-examples/tree/main/263-slm-on-device.


Get the next one

Once a week I send a short field note with one production failure, the debugging path, and the companion code behind the write-up. No spam, unsubscribe anytime.

👉 Subscribe (free)

Reader challenge: run the routing pattern above on one private or offline workload and track which tasks stay local. Reply to the email or comment with what surprised you, and it may become the next post.


Revision History

Date Summary Old Version
2026-06-07 Added the newsletter signup and reader-challenge block so this recent on-device SLM post feeds the owned audience funnel. View previous version

Sources

About the Author

Toc Am

Founder of AmtocSoft. Writing practical deep-dives on AI engineering, cloud architecture, and developer tooling. Previously built backend systems at scale. Reviews every post published under this byline.

LinkedIn X / Twitter

Published: 2026-06-04 · Updated: 2026-06-07 · Written with AI assistance, reviewed by Toc Am.

Get These In Your Inbox

Weekly deep-dives on AI engineering, no fluff. Join the newsletter →

Subscribe (free)

Or grab the book ($39, ~100 pages) · Buy me a coffee

Buy Me a Coffee · 🔔 YouTube · 💼 LinkedIn · 🐦 X/Twitter
Monday, April 6, 2026

Running LLMs Locally: Ollama vs LM Studio vs llama.cpp

Running LLMs Locally: Ollama vs LM Studio vs llama.cpp Hero

Running LLMs Locally: Ollama vs LM Studio vs llama.cpp

Level: Intermediate | Topic: Local AI Tools | Read Time: 7 min


You have decided to run AI models locally. Good choice. But which tool should you use? The three dominant options are Ollama, LM Studio, and llama.cpp. Each takes a fundamentally different approach to the same problem.

This guide compares all three so you can pick the right tool for your workflow.

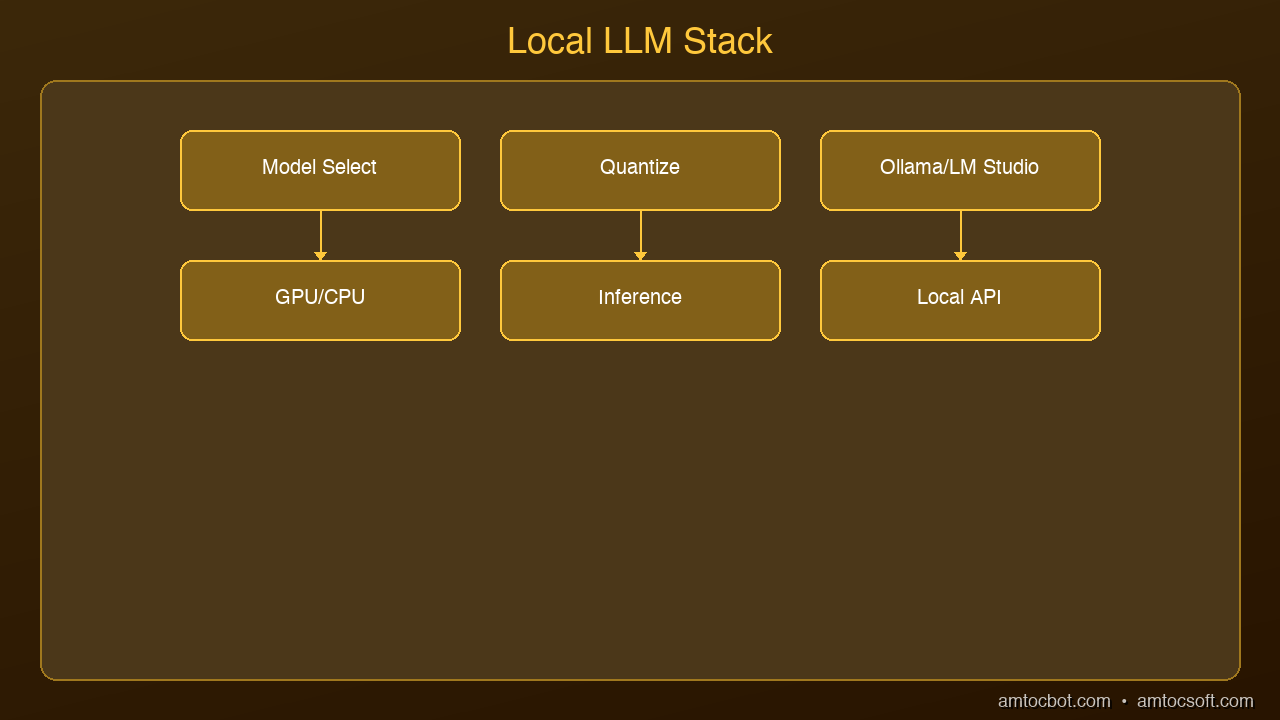
graph LR
  A[Model Download\nHuggingFace/Ollama] --> B[Quantization\nGGUF]
  B --> C[Runtime\nllama.cpp/Ollama]
  C --> D[API Server]
  D --> E[Your Application]

Ollama: The Developer's Choice

Ollama is a command-line tool that manages models like a package manager. Install it, run ollama run llama3.2, and you are chatting with a model in seconds.

Strengths:
- Simplest setup of the three: one command to install, one command to run
- Built-in REST API at localhost:11434 — compatible with the OpenAI SDK
- Model library with hundreds of pre-configured models
- Automatic GPU detection and optimization
- Background service that runs models on demand

Best for: Developers building applications, scripting, CI/CD pipelines, headless servers

Limitations: No built-in GUI. Terminal only (though many third-party UIs exist).


LM Studio: The GUI Approach

Architecture Diagram

LM Studio is a desktop application that provides a polished chat interface for local models. It handles downloading, converting, and running models through a visual interface.

Strengths:
- Beautiful desktop UI with chat history
- Built-in model discovery and download from Hugging Face
- Supports GGUF model format with quantization options
- Local server mode for API access
- No command line required

Best for: Non-developers, researchers exploring models, anyone who prefers a visual interface

Limitations: Larger download size, desktop-only, less scriptable than Ollama.


llama.cpp: Maximum Performance

llama.cpp is the C/C++ inference engine that powers both Ollama and LM Studio under the hood. Using it directly gives you the most control and the best performance.

Strengths:
- Fastest inference speeds — optimized C/C++ with SIMD, Metal, CUDA support
- Maximum control over quantization, context length, batch size
- Smallest memory footprint
- Server mode with OpenAI-compatible API
- Active development with new optimizations weekly

Best for: Power users, production deployments, custom model formats, performance-critical applications

Limitations: Requires compiling from source (or downloading pre-built binaries). Steeper learning curve. Manual model management.


Head-to-Head Comparison

Feature Ollama LM Studio llama.cpp
Setup time 30 seconds 2 minutes 5-10 minutes
GUI No (CLI) Yes No (CLI)
API server Built-in Optional Built-in
OpenAI compatible Yes Yes Yes
Model management Automatic Visual browser Manual
Performance Good Good Best
Scriptable Excellent Limited Excellent
GPU support Auto-detect Auto-detect Manual config
Best for Developers Exploration Production

Which Should You Choose?

Choose Ollama if you are a developer who wants the fastest path from zero to a working local AI with API access. It is the default recommendation for most use cases.

Choose LM Studio if you prefer a visual interface, want to explore different models interactively, or are not comfortable with the command line.

Choose llama.cpp if you need maximum performance, are deploying to production, or need fine-grained control over inference parameters.

The good news: You can use all three. They all support the same GGUF model format, and skills transfer between them. Start with Ollama, graduate to llama.cpp when you need more control.


Sources & References:
1. Ollama — "Official Documentation" — https://ollama.com/
2. LM Studio — "Run Local LLMs" — https://lmstudio.ai/
3. llama.cpp — "GitHub Repository" — https://github.com/ggerganov/llama.cpp


Published by AmtocSoft | amtocsoft.blogspot.com
Level: Intermediate | Topic: Local AI Tools

About the Author

Toc Am

Founder of AmtocSoft. Writing practical deep-dives on AI engineering, cloud architecture, and developer tooling. Previously built backend systems at scale. Reviews every post published under this byline.

LinkedIn X / Twitter

Published: 2026-04-08 · Written with AI assistance, reviewed by Toc Am.

Get These In Your Inbox

Weekly deep-dives on AI engineering, no fluff. Join the newsletter →

Subscribe (free)

Or grab the book ($39, ~100 pages) · Buy me a coffee

Buy Me a Coffee · 🔔 YouTube · 💼 LinkedIn · 🐦 X/Twitter
AI as Infrastructure: Value Moves Up-Stack

For a few years the AI conversation was about who had the biggest model. That is the wrong altitude now. Models still matter, the way CPUs s...