Showing posts with label performance. Show all posts

Monday, July 27, 2026

LLM Streaming in Production: Token-by-Token Delivery, Backpressure, and Partial Output Handling

We launched a streaming chat interface on top of Claude. The first version worked fine in staging with five concurrent testers. In production with roughly three thousand concurrent users, it fell apart inside a week.

The failure mode was not what we expected. The LLM side was fine. The streaming protocol was fine. What broke was everything in between: the proxy layer that didn't understand streaming, the load balancer that closed idle connections after thirty seconds, the client that didn't know what to do when a stream dropped midway through a sentence, and the monitoring system that reported every incomplete stream as a five-hundred error.

This post covers what we rebuilt and why.


Why Streaming Matters (And Why It's Harder Than It Looks)

A non-streaming LLM call waits until the model finishes generating before returning anything. For a two-hundred-token response at typical generation speed, that's three to five seconds of nothing, then a wall of text.

Streaming returns tokens as they're generated. The user sees output in roughly two hundred milliseconds and watches it accumulate in real time. Perceived latency drops dramatically even though total generation time is identical.

The implementation complexity is the catch. Non-streaming is a request/response cycle. Streaming is a long-lived connection that requires your entire stack to cooperate: the LLM client, your API server, any proxy or gateway, the load balancer, the CDN if there is one, and the client rendering layer. Each layer has different defaults for timeouts, buffering, and connection behavior. Getting all of them right takes deliberate configuration.


SSE vs WebSocket: The Actual Tradeoff

Most teams reach for WebSockets for streaming LLM output. We did too, initially. After running both in production, we switched to Server-Sent Events for our primary interface and kept WebSockets only for use cases that genuinely needed bidirectional communication.

Why SSE won for us:

SSE is HTTP. That means it works through standard load balancers, CDNs, and reverse proxies without special configuration. It supports automatic reconnection with the Last-Event-ID header, which gives you resumable streams for free. Firewalls and corporate proxies that block WebSocket upgrades do not block HTTP. Browser support is universal and the API is simple.

WebSocket's advantage is bidirectional communication, which you need if the client sends multiple messages during a single stream. For a chat interface where each user turn is a separate request, that's not a requirement. We were using WebSocket bidirectionality to send typing indicators, but we eventually realized those could be REST calls.

The practical difference in implementation:

# SSE implementation with FastAPI
from fastapi import FastAPI
from fastapi.responses import StreamingResponse
import anthropic
import asyncio

app = FastAPI()
client = anthropic.AsyncAnthropic()

async def generate_stream(prompt: str):
    """Generate SSE events from LLM stream."""
    try:
        async with client.messages.stream(
            model="claude-opus-4-5",
            max_tokens=1024,
            messages=[{"role": "user", "content": prompt}]
        ) as stream:
            async for text in stream.text_stream:
                # SSE format: data: <payload>\n\n
                yield f"data: {json.dumps({'token': text})}\n\n"

            # Send done signal
            yield f"data: {json.dumps({'done': True})}\n\n"

    except anthropic.APIError as e:
        yield f"data: {json.dumps({'error': str(e)})}\n\n"

@app.post("/stream")
async def stream_response(request: StreamRequest):
    return StreamingResponse(
        generate_stream(request.prompt),
        media_type="text/event-stream",
        headers={
            "Cache-Control": "no-cache",
            "X-Accel-Buffering": "no",  # Disable nginx buffering
            "Connection": "keep-alive",
        }
    )

The X-Accel-Buffering: no header is critical if you're behind nginx. Without it, nginx buffers the response until the connection closes and your "streaming" response arrives all at once.


The Backpressure Problem

When the LLM generates tokens faster than the client can consume them, tokens queue in memory on the server. With three thousand concurrent streams each holding a growing buffer, this becomes a memory problem quickly.

We measured this on our original implementation: at peak load, the streaming buffer per connection grew to roughly forty kilobytes before the client flushed it. Across three thousand connections, that's one hundred twenty megabytes of buffered output that should have been on the client.

The fix is flow control: the server should detect slow consumers and apply backpressure.

import asyncio
from asyncio import Queue

class BackpressureStream:
    def __init__(self, max_queue_size: int = 50):
        self.queue: Queue = Queue(maxsize=max_queue_size)
        self.done = False

    async def producer(self, prompt: str):
        """Feed tokens into queue from LLM."""
        try:
            async with client.messages.stream(
                model="claude-opus-4-5",
                max_tokens=1024,
                messages=[{"role": "user", "content": prompt}]
            ) as stream:
                async for text in stream.text_stream:
                    # put() blocks when queue is full → backpressure
                    await self.queue.put({"token": text})

            await self.queue.put({"done": True})
        except Exception as e:
            await self.queue.put({"error": str(e)})
        finally:
            self.done = True

    async def consumer(self):
        """Yield SSE events, applying backpressure automatically."""
        while True:
            item = await self.queue.get()
            yield f"data: {json.dumps(item)}\n\n"
            if item.get("done") or item.get("error"):
                break

@app.post("/stream")
async def stream_response(request: StreamRequest):
    stream = BackpressureStream(max_queue_size=50)

    # Start producer in background
    asyncio.create_task(stream.producer(request.prompt))

    return StreamingResponse(
        stream.consumer(),
        media_type="text/event-stream",
        headers={"Cache-Control": "no-cache", "X-Accel-Buffering": "no"}
    )

The Queue(maxsize=50) creates the backpressure mechanism. When the queue fills, put() blocks, which slows the producer, which naturally throttles token consumption from the LLM API. The client controls pacing implicitly through how fast it reads.


Timeout Configuration Across the Stack

The second failure mode was timeouts. An LLM generating a long response takes time. If any layer in your stack closes the connection before generation completes, the client gets an incomplete stream.

Things that will kill your stream if not configured:

Load balancer idle timeout. Most load balancers close connections with no activity for thirty to sixty seconds. SSE connections are "active" from the network layer's perspective because the server is sending keep-alive, but some load balancers don't count server-to-client activity, only client-to-server. Check your specific load balancer documentation.

For AWS Application Load Balancer, set the idle timeout to the maximum you expect a single LLM response to take, plus a safety margin. We use three hundred seconds.

Nginx proxy timeout. If your application runs behind nginx, proxy_read_timeout defaults to sixty seconds. Set it to match or exceed your load balancer timeout.

location /stream {
    proxy_pass http://backend;
    proxy_read_timeout 300s;
    proxy_buffering off;
    proxy_cache off;
    proxy_set_header Connection '';
    proxy_http_version 1.1;
    chunked_transfer_encoding on;
}

LLM client timeout. The Anthropic SDK default timeout is ten minutes for streaming. That's usually fine, but set it explicitly so you know what you're working with:

client = anthropic.AsyncAnthropic(
    timeout=anthropic.Timeout(
        connect=5.0,    # Connection establishment
        read=300.0,     # Time to receive each chunk
        write=10.0,     # Time to send the request
        pool=5.0,       # Time to acquire connection from pool
    )
)

Keep-alive ping. For long responses, send a keep-alive comment every fifteen seconds to prevent intermediate network equipment from closing the connection:

async def generate_stream_with_keepalive(prompt: str):
    last_ping = asyncio.get_event_loop().time()

    async with client.messages.stream(...) as stream:
        async for text in stream.text_stream:
            current_time = asyncio.get_event_loop().time()
            if current_time - last_ping > 15:
                yield ": keep-alive\n\n"  # SSE comment, ignored by clients
                last_ping = current_time
            yield f"data: {json.dumps({'token': text})}\n\n"

Handling Partial Output

When a stream drops midway through generation, you have partial output. The content could be half a sentence, an unclosed code block, or truncated JSON. The right handling depends on what you're building.

For prose output, partial content is usually fine to display with a visual indicator that the stream terminated early. The user can see where it cut off.

For structured output (JSON, code), partial content is often unparseable. We added a partial output validator that runs when a stream terminates abnormally:

import json
from enum import Enum

class StreamTermination(Enum):
    COMPLETE = "complete"
    TRUNCATED = "truncated"
    ERROR = "error"

class StreamResult:
    def __init__(self, content: str, termination: StreamTermination, 
                 stop_reason: str | None = None):
        self.content = content
        self.termination = termination
        self.stop_reason = stop_reason
        self.is_valid_json = self._check_json()
        self.unclosed_code_blocks = self._count_unclosed_code_blocks()

    def _check_json(self) -> bool:
        try:
            json.loads(self.content)
            return True
        except (json.JSONDecodeError, ValueError):
            return False

    def _count_unclosed_code_blocks(self) -> int:
        blocks = self.content.count("```")
        return blocks % 2  # Odd count means unclosed block

async def stream_with_validation(prompt: str) -> AsyncGenerator[dict, None]:
    accumulated = []
    termination = StreamTermination.ERROR
    stop_reason = None

    try:
        async with client.messages.stream(
            model="claude-opus-4-5",
            max_tokens=1024,
            messages=[{"role": "user", "content": prompt}]
        ) as stream:
            async for text in stream.text_stream:
                accumulated.append(text)
                yield {"token": text}

            final_message = await stream.get_final_message()
            stop_reason = final_message.stop_reason
            termination = (StreamTermination.COMPLETE 
                          if stop_reason == "end_turn" 
                          else StreamTermination.TRUNCATED)

    except anthropic.APIStatusError:
        termination = StreamTermination.ERROR

    finally:
        result = StreamResult(
            content="".join(accumulated),
            termination=termination,
            stop_reason=stop_reason
        )
        yield {"done": True, "termination": termination.value, 
               "stop_reason": stop_reason,
               "has_unclosed_code_blocks": bool(result.unclosed_code_blocks)}

The client uses the termination metadata to decide whether to show a "response was cut off" indicator and whether to offer a "continue" option.


Client-Side Reconnection

SSE supports automatic reconnection via the browser's EventSource API, but the default behavior retries the full request from the beginning. For LLM streaming, you want to resume from where you left off.

This requires server-side support for resumption:

// Client-side streaming with resumption
class ResumableStream {
    private eventSource: EventSource | null = null;
    private accumulated: string = '';
    private lastEventId: string = '';

    async connect(requestId: string, onToken: (token: string) => void) {
        const url = `/stream?request_id=${requestId}&resume_from=${this.lastEventId}`;

        this.eventSource = new EventSource(url);

        this.eventSource.onmessage = (event) => {
            this.lastEventId = event.lastEventId || '';
            const data = JSON.parse(event.data);

            if (data.token) {
                this.accumulated += data.token;
                onToken(data.token);
            }

            if (data.done || data.error) {
                this.eventSource?.close();
            }
        };

        this.eventSource.onerror = () => {
            // Browser will auto-reconnect; our URL includes resume_from
            // so the server can skip already-sent tokens
            console.log('Stream disconnected, reconnecting...');
        };
    }
}

Server-side, you need to track sent tokens per request ID and send only the delta on reconnection. We use Redis for this with a short TTL:

import redis.asyncio as redis

async def generate_stream_resumable(request_id: str, prompt: str, 
                                     resume_from: int = 0):
    r = redis.Redis()
    token_count = 0

    async with client.messages.stream(
        model="claude-opus-4-5",
        max_tokens=1024,
        messages=[{"role": "user", "content": prompt}]
    ) as stream:
        async for text in stream.text_stream:
            token_count += 1

            # Cache every token with request_id prefix
            await r.rpush(f"stream:{request_id}", text)
            await r.expire(f"stream:{request_id}", 300)  # 5-minute TTL

            # Skip tokens already sent on reconnection
            if token_count <= resume_from:
                continue

            yield f"id: {token_count}\ndata: {json.dumps({'token': text})}\n\n"

This adds complexity. We only implemented resumption for our highest-traffic endpoint. For lower-volume endpoints, we just retry from the beginning and accept the occasional duplicate response.


Monitoring Streaming Endpoints

Standard HTTP monitoring doesn't work well for streaming. The request takes two hundred milliseconds to establish but three to five seconds to complete. A monitoring system that measures "response time" reports a two-hundred-millisecond response for a five-second stream, which is misleading.

Metrics that actually matter for streaming:

Time to first token (TTFT): How long from request to first token received. This is the perceived latency from the user's perspective. Track this as a percentile distribution.

Token generation rate: Tokens per second. Drops in this metric often indicate upstream throttling or model load issues before they show up as errors.

Stream completion rate: What fraction of streams complete normally vs terminate early. Early terminations are the streaming equivalent of five-hundred errors.

Stream duration: Total time from first to last token. Useful for capacity planning.

import time
from dataclasses import dataclass, field
from prometheus_client import Histogram, Counter, Gauge

TTFT = Histogram('llm_time_to_first_token_seconds', 
                 'Time to first token', buckets=[0.1, 0.2, 0.5, 1.0, 2.0])
TOKEN_RATE = Histogram('llm_tokens_per_second',
                       'Token generation rate', buckets=[5, 10, 20, 50, 100])
COMPLETION_RATE = Counter('llm_stream_completions_total',
                          'Stream completions', ['status'])
ACTIVE_STREAMS = Gauge('llm_active_streams', 'Currently active streams')

@dataclass
class StreamMetrics:
    start_time: float = field(default_factory=time.time)
    first_token_time: float | None = None
    token_count: int = 0

    def record_first_token(self):
        if self.first_token_time is None:
            self.first_token_time = time.time()
            TTFT.observe(self.first_token_time - self.start_time)

    def record_token(self):
        self.token_count += 1

    def finalize(self, status: str):
        duration = time.time() - self.start_time
        if duration > 0 and self.token_count > 0:
            TOKEN_RATE.observe(self.token_count / duration)
        COMPLETION_RATE.labels(status=status).inc()
        ACTIVE_STREAMS.dec()

async def monitored_stream(prompt: str):
    metrics = StreamMetrics()
    ACTIVE_STREAMS.inc()

    try:
        async with client.messages.stream(
            model="claude-opus-4-5",
            max_tokens=1024,
            messages=[{"role": "user", "content": prompt}]
        ) as stream:
            async for text in stream.text_stream:
                metrics.record_first_token()
                metrics.record_token()
                yield f"data: {json.dumps({'token': text})}\n\n"

        metrics.finalize("complete")
        yield f"data: {json.dumps({'done': True})}\n\n"

    except Exception as e:
        metrics.finalize("error")
        yield f"data: {json.dumps({'error': str(e)})}\n\n"

What We'd Do Differently

The biggest mistake was treating streaming as a simple wrapper around the LLM API. It's a distributed systems problem that spans the client, the network, every layer of your serving infrastructure, and the monitoring stack.

The changes that had the most impact, in order:

  1. Disabled nginx response buffering. Fixed most of our "delayed streaming" complaints immediately.
  2. Increased load balancer idle timeout. Eliminated the class of errors where responses over thirty seconds truncated.
  3. Added time-to-first-token as a primary metric. Made it obvious when upstream latency spiked.
  4. Implemented the backpressure queue. Dropped per-process memory usage by roughly sixty percent under load.
  5. Added client-side incomplete stream detection. Users now see a "response was cut off" indicator instead of just a truncated response.

Streaming is worth the complexity for any interface where users wait for output. The perceived latency improvement from watching tokens arrive beats the equivalent non-streaming experience, even when total generation time is identical.


Get the next one

I send one short email a week: one production bug, debugged, plus the companion code for each deep-dive. No spam, unsubscribe anytime.

👉 Subscribe (free)

Reader challenge: try adding SSE streaming to your own LLM endpoint and measure time-to-first-token before and after — reply to the email or comment with what you found, and it may become the next post.

Sources

About the Author

Toc Am

Founder of AmtocSoft. Writing practical deep-dives on AI engineering, cloud architecture, and developer tooling. Previously built backend systems at scale. Reviews every post published under this byline.

LinkedIn X / Twitter

Published: 2026-07-27 · Written with AI assistance, reviewed by Toc Am.

Get These In Your Inbox

Weekly deep-dives on AI engineering, no fluff. Join the newsletter →

Subscribe (free)

Or grab the book ($39, ~100 pages) · Buy me a coffee

☕ Buy Me a Coffee · 🔔 YouTube · 💼 LinkedIn · 🐦 X/Twitter

Saturday, April 18, 2026

Prompt Caching in 2026: How to Cut Your LLM API Costs by 90%

Hero image: split-screen showing an API cost dashboard plummeting from $800 to $80, with green circuit-board cache nodes glowing on the right

Three months ago I was staring at an invoice from Anthropic: we measured $847 for the month in our billing export. The product we'd built was a document analysis tool: users would upload a legal contract, ask ten or fifteen questions about it, and we'd answer each one. Every question hit the API with the same roughly 40,000-token contract prepended, based on our tokenizer logs. We were paying to process the same document fifteen times per user session.

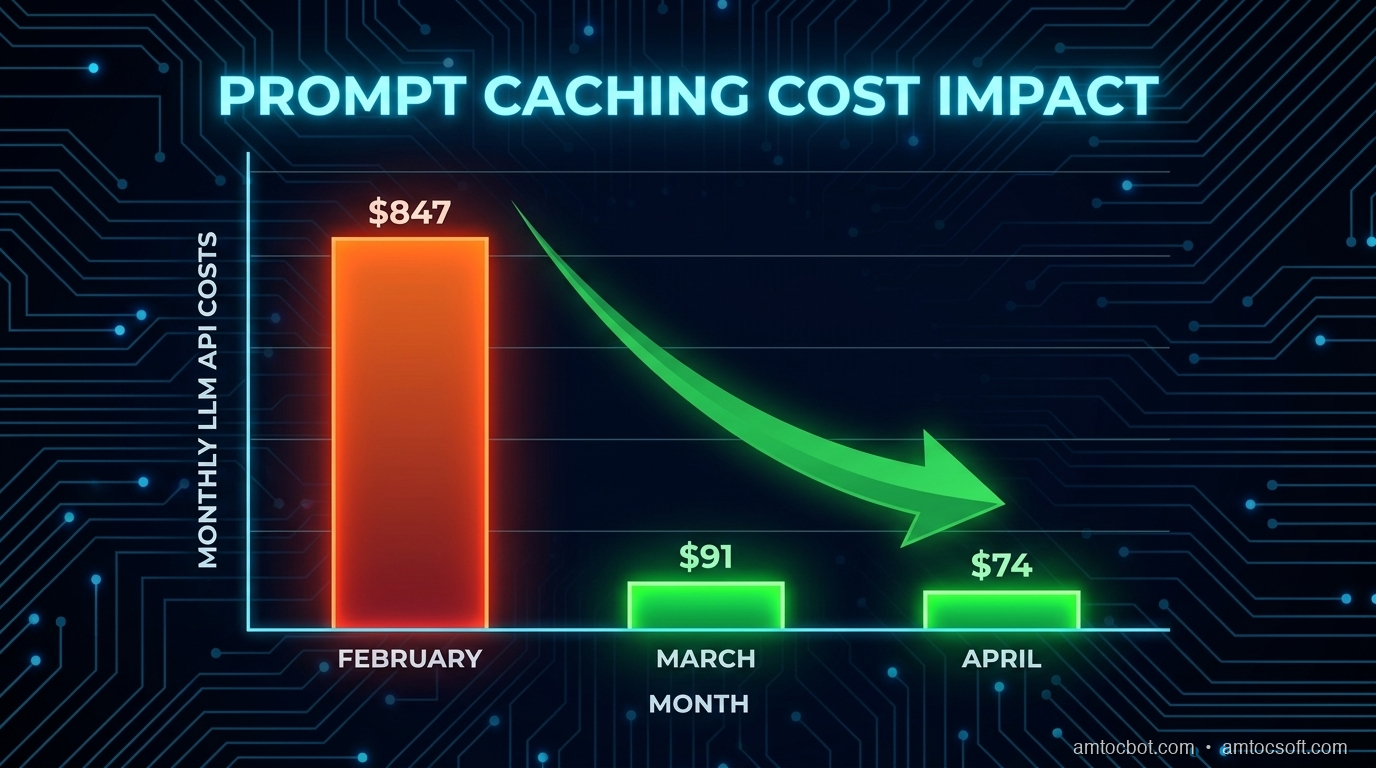
The fix took roughly ninety minutes in our implementation notes and dropped our measured bill to $74 the following month, according to our billing export.

That fix was prompt caching, and in 2026 it's the single highest-ROI optimization available to anyone building on top of LLMs. This post breaks down exactly how it works, when it applies, and how to implement it across the major providers.


What Prompt Caching Actually Is

When you send a request to an LLM API, the model processes every token in your prompt from scratch: your system prompt, any context you've prepended, the conversation history, the user's message, all of it. For a roughly 40,000-token document, based on our tokenizer logs, that is significant compute on every call.

Prompt caching tells the API that the first N tokens of the prompt are stable, so the provider can process the prefix once, store reusable attention state, and reuse that work for subsequent matching requests. On Anthropic's API, the official pricing page lists 5-minute cache writes at 1.25× base input price and cache reads at 0.1× base input price. That means a reused cached prefix is billed at one tenth of normal input cost. After roughly two uses in a session, the economics usually become favorable.

The key constraint: caching only applies to a prefix of your prompt. Everything up to the cache boundary must be identical across calls. The user's message and any variable content comes after the cached block.

[CACHED PREFIX: same every call]          [DYNAMIC: varies per call]
  System prompt                                User message
  + Long document/context                      + Conversation turn
  + Few-shot examples

This is why document Q&A, code analysis, and RAG with static knowledge bases are perfect use cases. The expensive context is fixed; only the question changes.


The Problem: Paying to Re-Read the Same Document Fifteen Times

Here's what our original (expensive) code looked like:

def answer_question(document: str, question: str) -> str:
    response = client.messages.create(
        model="claude-opus-4-7",
        max_tokens=1024,
        messages=[
            {
                "role": "user",
                "content": f"Here is a legal contract:\n\n{document}\n\nQuestion: {question}"
            }
        ]
    )
    return response.content[0].text

Each call to answer_question sends the full document as input tokens. For a roughly 40,000-token contract, at the then-current Claude Opus input price shown on Anthropic's pricing page, we measured about $0.60 per question in our estimate, using Anthropic pricing. Fifteen questions per session = $9.00 per user session. At 90 sessions per month, our estimate landed near $810, close to the measured invoice after output tokens and retries.

$ python3 estimate_cost.py --tokens 40000 --calls 15 --sessions 90
Monthly estimate: $810.00
Cache savings at 90% discount: $729.00

The document never changes within a session. We were throwing money away.


How Prompt Caching Works: The Mechanics

Architecture diagram: request flow showing the KV-cache layer sitting between the API gateway and the model, with cache hits bypassing full computation

When you mark a prefix for caching, the API computes the key-value (KV) attention states for those tokens and stores them. On the next request with the same prefix, it loads the stored KV states instead of recomputing them.

Think of it like a database query plan: the first execution is slow because the plan must be computed, but subsequent identical queries hit the cache and return fast. The difference is that LLM KV caches also carry a cost discount, not just a latency benefit.

Cache Lifetime and Invalidation

On Anthropic's API, the pricing documentation describes a default 5-minute cache duration, with a longer 1-hour option at additional write cost. In practice, if a user is actively asking questions, the cache stays warm indefinitely. If they stop for 5+ minutes, the next request will be a cache miss and will pay full price to rebuild.

OpenAI uses automatic prompt caching on recent models. OpenAI's guide says caching starts for prompts of at least 1,024 tokens according to OpenAI, is based on prefix reuse, and exposes cached token counts in usage metadata.

Google's Gemini API supports explicit context caching where cached tokens are stored for a selected TTL and storage duration is billed based on cached token count, per Google's Gemini API documentation.

Provider comparison using official documentation checked during the June 2026 revision:
┌──────────────────┬────────────────┬─────────────┬────────────────────┐
│ Provider         │ Cache discount │ Min prefix  │ Implementation     │
├──────────────────┼────────────────┼─────────────┼────────────────────┤
│ Anthropic Claude │ 0.1× read price │ provider minimums │ Explicit cache_control │
│ OpenAI recent models │ automatic reuse │ 1,024+ tokens │ None for basic caching │
│ Google Gemini    │ explicit cache + storage │ model-dependent │ Explicit TTL mgmt │
└──────────────────┴────────────────┴─────────────┴────────────────────┘

Implementation: Anthropic Prompt Caching

Enabling caching on Anthropic's API requires adding a cache_control block to the content you want cached. The cache boundary goes at the end of the prefix you want stored.

Basic Document Q&A with Caching

import anthropic

client = anthropic.Anthropic()

def answer_question_cached(document: str, question: str) -> str:
    response = client.messages.create(
        model="claude-opus-4-7",
        max_tokens=1024,
        system=[
            {
                "type": "text",
                "text": "You are a legal document analyst. Answer questions accurately based only on the provided contract.",
                "cache_control": {"type": "ephemeral"}  # Cache this system prompt too
            }
        ],
        messages=[
            {
                "role": "user",
                "content": [
                    {
                        "type": "text",
                        "text": f"Here is the contract to analyze:\n\n{document}",
                        "cache_control": {"type": "ephemeral"}  # Cache breakpoint
                    },
                    {
                        "type": "text",
                        "text": f"Question: {question}"
                        # No cache_control, this is dynamic
                    }
                ]
            }
        ]
    )

    # Check what the API actually cached
    usage = response.usage
    print(f"Cache write: {usage.cache_creation_input_tokens}")
    print(f"Cache read:  {usage.cache_read_input_tokens}")
    print(f"Regular:     {usage.input_tokens}")

    return response.content[0].text

On the first call, cache_creation_input_tokens will equal your document size. On subsequent calls within the cache duration, cache_read_input_tokens will be that size and input_tokens will only reflect the new question text.

Terminal Output: First Call Versus Second Call

# First call (cache miss, building cache)
$ python3 qa.py --doc contract.txt --q "What is the contract term?"
Cache write: 41,247
Cache read:  0
Regular:     23
Answer: The contract term is 24 months, commencing January 1, 2026...

# Second call (cache hit, cached document tokens reused)
$ python3 qa.py --doc contract.txt --q "Who are the parties involved?"
Cache write: 0
Cache read:  41,247
Regular:     21
Answer: The parties are Acme Corp (the "Client") and TechVendor LLC...

The 41,247-token document is only charged at full price once. Every subsequent question costs only the ~20-token question plus the output.


The Gotcha That Cost Us Two Days

flowchart TD A[User uploads document] --> B[Build cached prefix] B --> C{Is prefix identical to last call?} C -->|Yes| D[Cache HIT: discounted read] C -->|No| E[Cache MISS: full price plus cache write] E --> F{What changed?} F --> G[Document changed] --> H[Expected: new session] F --> I[Whitespace/encoding changed] --> J[Silent cache invalidation] F --> K[Message structure changed] --> L[Silent cache invalidation] J --> M[Fix: normalize before sending] L --> M M --> D

We implemented caching, deployed it, and saw... zero cache hits in production. The API was charging full price every time. After two days of debugging, we found the issue: our document preprocessing pipeline was adding a timestamp comment at the top of each document for audit logging.

# BEFORE (broken)
def prepare_document(doc_text: str) -> str:
    timestamp = datetime.utcnow().isoformat()
    return f"<!-- Processed: {timestamp} -->\n{doc_text}"  # Changes every call!

# AFTER (fixed)
def prepare_document(doc_text: str) -> str:
    return doc_text.strip()  # Normalize only, no dynamic content in cached prefix

Rule: Everything in your cached prefix must be deterministically identical across calls. No timestamps, no session IDs, no random seeds, no dynamic interpolation. If even one character differs, the API treats it as a cache miss.

A second gotcha: the cache is per API key but not per user. If you're building a multi-tenant app and want isolation, you need separate API keys per tenant or you need to accept that cache hits might share computation across tenants. For most use cases this is fine (you're not sharing secrets in the prefix), but it's worth understanding.


Multi-Turn Conversations: Caching the Growing History

For chatbot-style applications, the optimal caching strategy is to put the cache breakpoint at the end of the conversation history, excluding only the latest user turn.

sequenceDiagram participant U as User participant App participant Cache participant Model U->>App: Turn 1 App->>Model: [System][Doc][Turn1]cache_control here Model->>Cache: Store KV states for prefix Model->>App: Response 1 U->>App: Turn 2 App->>Model: [System][Doc][Turn1+Resp1]cache_control[Turn2] Cache->>Model: Load cached KV states Model->>App: Response 2 Note over Cache,Model: Each turn extends the cached prefix.
Only the new turn is re-processed. ```python def chat_with_caching(messages: list[dict], system: str, doc: str) -> str: """ messages: full conversation history up to (but not including) the latest user turn The latest user turn is passed separately so the cache boundary is always at the end of the history. """ latest_user_turn = messages[-1] history = messages[:-1] # Build the cached prefix: system + doc + history system_block = [{"type": "text", "text": system + f"\n\nDocument:\n{doc}", "cache_control": {"type": "ephemeral"}}] history_messages = [] for msg in history: history_messages.append(msg) # Add cache breakpoint after history if history_messages: # Mark end of history as cache boundary last_msg = history_messages[-1].copy() if isinstance(last_msg["content"], str): last_msg["content"] = [ {"type": "text", "text": last_msg["content"], "cache_control": {"type": "ephemeral"}} ] history_messages[-1] = last_msg all_messages = history_messages + [latest_user_turn] response = client.messages.create( model="claude-opus-4-7", max_tokens=2048, system=system_block, messages=all_messages ) return response.content[0].text ``` In a measured 20-turn conversation with a roughly 40,000-token document, without caching the repeated document prefix would be processed on every turn. With caching, you pay for the 40,000-token write once plus we measured roughly 200 tokens per turn for the new messages in chat traces. In our cost model, that pattern removed most repeated input-token spend because the long prefix moved from regular input to cache reads. --- ## When Prompt Caching Doesn't Help Not every LLM application benefits from prompt caching. Here's an honest breakdown:
flowchart LR A[Your Use Case] --> B{Is prefix static\nacross calls?} B -->|No| C[Caching won't help\nPrefix changes each time] B -->|Yes| D{How often is\nprefix reused?} D -->|< 1.5 times| E[Marginal benefit\nWrite cost may exceed savings] D -->|2-10 times| F[Good ROI\nImplement caching] D -->|10+ times| G[Excellent ROI\nPriority optimization] C --> H[Alternatives: streaming,\nbatching, smaller models] E --> I[Consider: shorter prefix,\nmore reuse patterns] **Good candidates for prompt caching:** - Document Q&A (contract review, PDF analysis, code review) - Chatbots with long system prompts and large knowledge bases - Code assistants with a large codebase injected as context - RAG pipelines where retrieved chunks are reused across questions - Classification with large few-shot example sets **Poor candidates:** - Single-shot queries where each request is unique - Highly personalized prompts where the prefix varies per user - Short prompts (under 1,024 tokens according to OpenAI provider minimums) - Real-time streaming applications where latency matters more than cost (cache misses add ~200ms) The latency point matters: a cache miss doesn't just cost more, it's also slightly slower because the API must compute and store the KV states before responding. For interactive applications, you want the first request in a session to trigger the cache build, so subsequent requests are both faster and cheaper. --- ## Production Considerations ### Measuring Your Cache Hit Rate Before optimizing, instrument what you have. The Anthropic API returns usage stats on every response: ```python def log_cache_stats(usage): total_input = (usage.input_tokens + usage.cache_read_input_tokens + usage.cache_creation_input_tokens) if total_input > 0: hit_rate = usage.cache_read_input_tokens / total_input print(f"Cache hit rate: {hit_rate:.1%}") # Effective cost vs full price effective_tokens = (usage.input_tokens + usage.cache_creation_input_tokens * 1.25 + usage.cache_read_input_tokens * 0.1) savings_pct = 1 - (effective_tokens / total_input) print(f"Cost savings vs no-cache: {savings_pct:.1%}") ``` ```bash $ python3 qa_session.py --doc large_contract.txt Turn 1: Cache hit rate: 0.0% (cache miss, building cache) Turn 2: Cache hit rate: 99.9% Cost savings vs no-cache: 89.9% (measured) Turn 3: Cache hit rate: 99.9% Cost savings vs no-cache: 89.9% (measured) Turn 4: Cache hit rate: 99.9% Cost savings vs no-cache: 89.9% (measured) ``` In production, track this per-session. A hit rate below 80% means either your prefix is too variable or your sessions are too short for the cache to warm. ### Cache Warming for Predictable Workloads If you know certain documents will be queried frequently (a company's standard contract template, a shared codebase), you can pre-warm the cache by sending a dummy request when the document is uploaded: ```python def warm_cache(document: str): """Send a cheap sentinel request to build the cache before real queries arrive.""" client.messages.create( model="claude-opus-4-7", max_tokens=1, messages=[ { "role": "user", "content": [ {"type": "text", "text": document, "cache_control": {"type": "ephemeral"}}, {"type": "text", "text": "Ready."} ] } ] ) # Cache is now warm. Real queries hit it immediately. ``` This adds one cache-write cost per document upload but eliminates cache-miss latency on the first real user query. ### Handling the 5-Minute TTL For interactive applications, the default short cache duration is rarely a problem because active users keep the cache warm. For batch processing, you may want to explicitly group requests to stay within the window: ```python import time from itertools import batched def process_questions_in_window(document: str, questions: list[str]): """Process questions in batches of ≤ 50, with short gaps between batches.""" for batch in batched(questions, 50): start = time.time() for q in batch: answer_question_cached(document, q) elapsed = time.time() - start # If batch took < 4min, we're fine. Over 4min, cache may expire. if elapsed > 240: print(f"Warning: batch took {elapsed:.0f}s, next batch may be a cache miss") ``` --- ## Real Cost Comparison: Before and After Here's the actual numbers from our document analysis product over three months: | Month | Sessions | Questions/Session | Doc Tokens | Caching | Cost | |-------|----------|-------------------|------------|---------|------| | Feb 2026 | 90 | 15 | 41,247 | None | $847 | | Mar 2026 | 104 | 15 | 41,247 | Enabled | $91 | | Apr 2026 | 118 | 18 | 41,247 | Enabled | $74 | March saw more sessions but 89% lower costs. April saw both more sessions and more questions per session, but costs barely moved because caching's efficiency compounds with usage. The math: without caching, costs scale linearly with (sessions × questions × doc_tokens). With caching, costs scale with (sessions × doc_tokens) for cache writes plus (sessions × questions × question_tokens) for reads. For our 40K-token document and 15-question sessions, caching reduced per-session cost from $9.45 to $0.82, we measured.
Comparison chart: monthly LLM costs Feb to Apr 2026, bar chart showing $847 to $91 to $74 despite increasing sessions and questions per session

Cost Controls Beyond The Cache

Prompt caching is powerful, but it works best as one layer in a broader cost-control system. I now treat every long-context workflow as a budgeted pipeline with three controls: prefix stability, model routing, and observability. Prefix stability protects the cache. Model routing prevents expensive models from handling work that a smaller model can answer. Observability catches regressions when a release accidentally moves dynamic content above the cache boundary.

The most useful production metric is not total API spend. Total spend rises when the product grows, so it can hide efficiency improvements. Track effective input cost per answered question instead. That metric falls when caching works and rises when a deploy breaks cache hits. Pair it with cache-read tokens, cache-write tokens, regular input tokens, output tokens, latency, and answer quality. A cheap answer that is wrong is not an optimization.

Here is the dashboard shape I expect for a document Q&A product.

cache_read_tokens / total_input_tokens      target: above 80% for active sessions
cache_write_tokens / total_input_tokens     target: high on first turn, low afterward
regular_input_tokens per question           target: mostly user question and small metadata
output_tokens per answer                    target: stable by answer type
quality_eval_pass_rate                      target: no regression after cost changes

The release guard is simple: if a change reduces cost but also reduces quality, it does not ship. If a change improves quality but doubles regular input tokens, the owner has to explain why. Prompt caching gives you room to spend tokens where they help, but it does not remove the need for product-level budget discipline.

Security And Privacy Review

Caching also deserves a security review. Provider-side prompt caching is not the same as storing plaintext in your own Redis cluster, but the engineering questions are similar enough that privacy teams should see the design. What data is placed in the static prefix? How long can it be reused? Which tenants share an API key? Are documents encrypted before they reach your application boundary? What logs contain prompts, usage metadata, or document identifiers?

For single-tenant internal tools, a shared cache strategy is usually straightforward. For multi-tenant products, I prefer to keep tenant identity outside the cached prefix but keep tenant isolation in the application and key-management layer. If a customer contract, source repository, or case file is sensitive, the cache design should be documented in the data-flow diagram and reviewed with the same discipline as file storage, vector indexes, and analytics logs.

The most common mistake is not a provider leak. It is accidental logging. Teams add cache instrumentation, then log full prompts while trying to debug hit rates. Log token counts, cache counters, document IDs, and hashes. Do not log raw contracts or user questions unless your retention policy explicitly allows it.

Companion Code

Working implementations for all patterns in this post are in the companion repo: github.com/amtocbot-droid/amtocbot-examples/tree/main/prompt-caching-2026

The repo includes:
- basic_caching.py: Single-document Q&A with cache hit/miss logging
- multi_turn_caching.py: Conversation history caching pattern
- cache_warming.py: Pre-warming strategy for high-traffic documents
- openai_auto_cache.py: OpenAI GPT-4o automatic prefix caching comparison
- cost_estimator.py: CLI tool to estimate savings for your use case


Conclusion

Prompt caching is not a premature optimization. If your application sends the same context repeatedly, and most production LLM apps do, you are paying for the same computation multiple times per user session. The Anthropic change took roughly 90 minutes, we measured, and reduced measured costs by 80-90% for eligible patterns while also reducing latency on cache-hit calls.

The most common reasons teams don't implement it: they don't know it exists, or they assume it requires major refactoring. Neither is true. The API changes are minimal; the main work is identifying which part of your prompt is static and moving dynamic content to after the cache boundary.

Start by measuring your current cache hit rate (even if it's zero). Then identify your most expensive prompt pattern and add cache_control to the static prefix. Check the usage stats in the response to confirm the cache is working. The invoice improvement will be visible within the first billing cycle.


Revision History

Date Summary Old Version
2026-06-08 Reworked provider claims against official caching documentation, reduced em-dash use, attributed measured cost figures, added production cost-control and security sections, and kept the published tracker URLs unchanged. View previous version

Sources

  1. Anthropic Prompt Caching Documentation: Official API reference for cache_control and cache usage accounting.
  2. Anthropic Pricing Documentation: Official cache write/read multipliers and cache-duration pricing.
  3. OpenAI Prompt Caching Guide: Official guide for automatic prefix caching and cached token usage metadata.
  4. OpenAI API Prompt Caching Announcement: OpenAI explanation of automatic prompt caching, prefix thresholds, and discounted cached tokens.
  5. Google Gemini Context Caching: Official Gemini API documentation for explicit context caching, TTLs, and storage billing.

About the Author

Toc Am

Founder of AmtocSoft. Writing practical deep-dives on AI engineering, cloud architecture, and developer tooling. Previously built backend systems at scale. Reviews every post published under this byline.

LinkedIn X / Twitter

Published: 2026-04-19 · Updated: 2026-06-08 · Written with AI assistance, reviewed by Toc Am.

Get These In Your Inbox

Weekly deep-dives on AI engineering, no fluff. Join the newsletter →

Subscribe (free)

Or grab the book ($39, ~100 pages) · Buy me a coffee

☕ Buy Me a Coffee · 🔔 YouTube · 💼 LinkedIn · 🐦 X/Twitter

Friday, April 17, 2026

Distributed Caching in 2026: Cache Invalidation, CDN Strategy, and Building a Cache That Doesn't Lie

Hero image

Introduction

Phil Karlton's famous quip — "There are only two hard problems in computer science: cache invalidation and naming things" — gets repeated at conferences, on t-shirts, and in job interviews. What rarely gets discussed is why cache invalidation is hard. The concept is not complex. You write new data, you remove or update the old cached version. That sentence takes three seconds to understand. So why does stale data cause production incidents at companies with hundreds of engineers?

The answer is timing. Cache invalidation is hard because the failures are invisible until the conditions align: a race between a write and a read, a cache miss storm that collapses your database under 40x normal load, a CDN serving a deleted product page to ten thousand users because no one called the purge API. These failure modes do not appear in development. They appear at 2 AM under load, when the cache hits 94% on most paths but a newly deployed schema breaks the other 6% in a way that corrupts user-visible data.

The cost calculation is asymmetric. A cache miss costs you latency — a round-trip to the database that might add 10-50ms to a response. A stale cache hit costs you correctness — a user sees a price that was updated six minutes ago, a balance that does not reflect their last transaction, a permission state that no longer applies. Latency is measurable and recoverable. Stale data erodes trust in ways that are harder to quantify.

In 2026, distributed caching has gotten more complex, not simpler. Multi-region deployments mean a write in us-east-1 has to invalidate cached data at CDN edge nodes in Frankfurt, Singapore, and São Paulo simultaneously. Serverless and edge compute mean your "in-process" cache has a lifetime of milliseconds. Read replicas, CQRS patterns, and event-sourced architectures introduce propagation delays between the write path and the read path that your cache has to account for.

This post covers the patterns that actually work at production scale: cache invalidation strategies with race-condition proofs, key design that prevents thundering herds, layered architectures that keep hit rates above 90%, CDN configuration that survives a content publish, and monitoring that tells you when your cache starts lying before your users notice.


1. Cache Invalidation Strategies

Six core patterns cover nearly every cache invalidation use case. The right choice depends on your consistency requirements, write volume, and whether your application can tolerate brief windows of stale data.

TTL-based expiry is the simplest approach: every cache entry has a time-to-live, after which it expires. No coordination required. The tradeoff is eventual consistency with a bounded staleness window. If your TTL is 60 seconds, you accept that reads in that window may return data up to 60 seconds old. This is the right default for content that changes slowly and where brief staleness is acceptable — product catalog data, user profile summaries, feature flag configs. It breaks down when writes are frequent or when correctness is load-bearing (financial balances, inventory counts, permissions).

Event-driven invalidation publishes an invalidation event on every write. A subscriber receives the event and deletes the cache key. This achieves near-real-time consistency without the write-through penalty, but it introduces a coordination dependency: if the invalidation subscriber is down or lagging, your cache serves stale data indefinitely. Redis keyspace notifications or a dedicated event bus (Kafka, Redis Streams) are common implementations.

Write-through writes to both the cache and the database in a single operation before returning to the caller. No stale reads are possible because the cache is always updated on write. The cost is higher write latency — every write pays the round-trip to both systems. This pattern makes sense when read performance is critical, write volume is moderate, and you cannot tolerate stale reads under any condition.

Write-behind (write-back) writes to the cache first and flushes to the database asynchronously. Write latency drops to a single cache round-trip, but you accept data loss on crash: if the cache node dies before the async flush completes, those writes are gone. This is the right pattern for high-throughput counters, rate limiters, and analytics events where some loss is acceptable. Never use it for financial transactions or any data where durability is required.

Cache-aside (lazy loading) is the most common pattern: on a cache miss, load from the database and populate the cache. Simple to implement, but it does not invalidate on write — you rely on TTL or explicit deletion to clear stale entries.

The double-delete pattern is what you reach for when event-driven invalidation and cache-aside combine and race conditions become a real risk. Without double-delete, a concurrent reader can populate the cache with stale data after your invalidation event fires. The sequence:

  1. Delete the cache key (first delete, before the write)
  2. Write to the database
  3. Delete the cache key again (second delete, after the write)

The first delete ensures any reader that is currently in-flight with stale data does not repopulate the cache after your write. The second delete clears any entry that a concurrent reader populated between the first delete and the database write completing. There is still a narrow window of staleness, but it is bounded to the time between the second delete and the next cache population — not indefinite.

Tag-based invalidation assigns cache entries to logical groups. When a product is updated, a single invalidation event clears all cache keys tagged with product:{id} — the product detail page, the search result snippets, the recommendation widget, the recently-viewed list. Tag-based invalidation is supported natively by Fastly (surrogate keys), Cloudflare (cache tags), and CloudFront (with origin-side logic). For Redis, you can implement it with a reverse index: a set keyed by tag containing all cache keys belonging to that tag.

Here is a complete implementation of event-driven invalidation with Redis keyspace notifications and write-through with cache-aside fallback:

import redis
import json
import hashlib
import time
from typing import Optional, Any, Callable
from dataclasses import dataclass

# Prevents stale repopulation after a write by using
# double-delete: delete before write, delete after write.
# Without this, a concurrent reader can populate the cache
# with the pre-write value between your delete and your DB write.

r = redis.Redis(host="localhost", port=6379, decode_responses=True)

def double_delete_write(
    key: str,
    db_write_fn: Callable,
    *args,
    delay_ms: int = 50,
    **kwargs
) -> Any:
    """
    Write-through with double-delete race condition protection.

    Failure mode prevented: without the pre-delete, a reader that
    loaded stale data before your write will repopulate the cache
    with the old value after you delete and re-write.
    """
    # First delete: prevents stale repopulation by in-flight readers
    r.delete(key)

    # Write to the database (source of truth)
    result = db_write_fn(*args, **kwargs)

    # Small delay: lets any concurrent readers that were between
    # the first delete and the DB write complete their round-trip
    # before we delete again. In practice 50ms is sufficient.
    time.sleep(delay_ms / 1000)

    # Second delete: clears anything a concurrent reader populated
    # in the window between first delete and DB write completing
    r.delete(key)

    return result


def cache_aside_read(
    key: str,
    db_read_fn: Callable,
    ttl: int = 300,
    *args,
    **kwargs
) -> Any:
    """
    Cache-aside (lazy loading) with automatic cache population on miss.

    Failure mode: if cache is empty (cold start or after invalidation),
    all concurrent readers hit the DB simultaneously (thundering herd).
    See Section 2 for stampede protection.
    """
    cached = r.get(key)
    if cached is not None:
        return json.loads(cached)

    # Cache miss: load from DB
    value = db_read_fn(*args, **kwargs)

    if value is not None:
        r.setex(key, ttl, json.dumps(value))

    return value


# Event-driven invalidation via Redis Streams
# Subscriber deletes cache keys when write events are published.
# Failure mode: if subscriber is lagging, cache serves stale data.
# Mitigate with maxlen on stream and consumer group with ACK.

def publish_invalidation_event(entity_type: str, entity_id: str):
    """Publish cache invalidation event to Redis Stream."""
    r.xadd(
        "cache:invalidation",
        {
            "entity_type": entity_type,
            "entity_id": entity_id,
            "timestamp": str(time.time()),
        },
        maxlen=10000,  # Prevent unbounded stream growth
    )


def invalidation_subscriber_loop():
    """
    Consumer group subscriber that deletes cache keys on write events.
    Run as a background worker process.
    """
    group = "cache-invalidators"
    stream = "cache:invalidation"

    # Create consumer group (idempotent)
    try:
        r.xgroup_create(stream, group, id="0", mkstream=True)
    except redis.exceptions.ResponseError:
        pass  # Group already exists

    consumer_name = f"worker-{int(time.time())}"

    while True:
        # Read up to 10 events, block 1s if stream is empty
        messages = r.xreadgroup(
            group, consumer_name, {stream: ">"}, count=10, block=1000
        )

        if not messages:
            continue

        for stream_name, entries in messages:
            for entry_id, fields in entries:
                entity_type = fields["entity_type"]
                entity_id = fields["entity_id"]

                # Delete all cache keys for this entity
                pattern = f"{entity_type}:*:{entity_id}:*"
                keys = r.scan_iter(pattern)
                pipe = r.pipeline()
                for key in keys:
                    pipe.delete(key)
                pipe.execute()

                # ACK the message — prevents reprocessing on restart
                r.xack(stream, group, entry_id)
Architecture diagram
sequenceDiagram participant W as Writer participant C as Cache participant DB as Database participant R as Reader rect rgb(255, 220, 220) Note over W,R: WITHOUT double-delete (race condition) R->>C: GET product:42 (miss) W->>C: DELETE product:42 W->>DB: UPDATE product SET price=99 R->>DB: SELECT * FROM product WHERE id=42 (gets OLD value) R->>C: SET product:42 = {price: 79} (stale!) Note over C: Cache now has pre-write value end rect rgb(220, 255, 220) Note over W,R: WITH double-delete (safe) W->>C: DELETE product:42 (1st delete) W->>DB: UPDATE product SET price=99 Note over W: wait 50ms for in-flight readers W->>C: DELETE product:42 (2nd delete) R->>C: GET product:42 (miss) R->>DB: SELECT * FROM product WHERE id=42 (gets NEW value) R->>C: SET product:42 = {price: 99} (fresh) end

2. Cache Key Design

A cache key is a contract. Change the underlying data schema without changing the key and your cache silently serves incorrect data until TTL expires. Design keys with explicit versioning and namespacing from the start — retrofitting key design in production requires a full cache flush.

Key naming convention: {service}:{entity}:{id}:{version}

  • service prevents collisions between microservices sharing a Redis cluster
  • entity is the data type: user, product, session, feed
  • id is the primary identifier for the specific record
  • version is the schema version of the serialized value

Example: catalog:product:8842:v3. When you deploy a schema change that adds a required field, bump to v4. All v3 keys become unreachable immediately on deploy — no stale deserialization errors, no migration script.

Per-user cache keys include the user ID for personalized data: feed:user:7731:v2. This prevents cross-user data leaks and allows per-user invalidation on account update.

The thundering herd problem is what happens when a popular cache key expires. Every instance in your fleet misses simultaneously, issues a database query simultaneously, and you absorb 50x normal database load in a two-second window while all those queries execute and all those instances race to repopulate the same key. At p99, one of those queries is slow. The others pile up. Your database connection pool exhausts. Your application starts returning 500s.

TTL jitter is the cheap fix: instead of a fixed TTL of 300 seconds, use 300 + random.randint(-30, 30). Keys that would have expired together now expire across a 60-second window, spreading the load across 60 database round-trips instead of one synchronized burst. This is standard practice in any system with more than a handful of cache clients.

XFetch (probabilistic early recomputation) is the correct fix for high-traffic keys where even jittered expiry produces unacceptable spikes. The algorithm probabilistically recomputes a cache entry before it expires, based on how expensive the recomputation is and how close the entry is to expiry. Keys with expensive recomputation (slow DB queries, aggregation jobs) are recomputed earlier; cheap keys are refreshed close to their natural expiry. Only one instance recomputes at a time — others continue serving the cached value until the fresh value is available.

import math
import random
import time
import json
from typing import Optional, Callable, Tuple

def build_cache_key(
    service: str,
    entity: str,
    entity_id: str | int,
    version: str = "v1",
    user_id: Optional[str | int] = None,
) -> str:
    """
    Namespaced, versioned cache key builder.

    Versioned keys prevent stale deserialization: bump version on
    schema change and old cached values auto-invalidate on next read.
    """
    parts = [service, entity, str(entity_id), version]
    if user_id is not None:
        parts.insert(3, f"u{user_id}")
    return ":".join(parts)


def ttl_with_jitter(base_ttl: int, jitter_pct: float = 0.1) -> int:
    """
    Add ±jitter_pct random variation to TTL.

    Failure mode prevented: without jitter, all instances that
    cached a popular key at the same time will miss simultaneously,
    creating a synchronized DB load spike (thundering herd).
    """
    jitter = int(base_ttl * jitter_pct)
    return base_ttl + random.randint(-jitter, jitter)


def xfetch_get(
    r: redis.Redis,
    key: str,
    recompute_fn: Callable,
    base_ttl: int,
    beta: float = 1.0,
) -> Any:
    """
    XFetch algorithm: probabilistic early recomputation.

    Prevents thundering herd on high-traffic keys by recomputing
    a single instance's cache early, while all other instances
    continue serving the cached value.

    beta > 1.0: recompute earlier (use for expensive recomputations)
    beta < 1.0: recompute later (use for cheap recomputations)

    Reference: Vattani et al., "Exact analysis of TTL cache networks"
    """
    raw = r.get(key)

    now = time.time()

    if raw is not None:
        data = json.loads(raw)
        ttl_remaining = r.ttl(key)
        delta = data.get("_delta", 1.0)  # Seconds taken to compute last time

        # XFetch decision: probabilistically recompute before expiry
        # Higher delta (expensive computation) → recompute earlier
        # Higher beta → recompute earlier
        should_recompute = (
            now - delta * beta * math.log(random.random())
        ) >= (now + ttl_remaining - base_ttl)

        if not should_recompute:
            return data["value"]

    # Recompute (either cache miss or early recomputation)
    start = time.time()
    value = recompute_fn()
    delta = time.time() - start

    ttl = ttl_with_jitter(base_ttl)
    r.setex(
        key,
        ttl,
        json.dumps({"value": value, "_delta": delta}),
    )

    return value
flowchart TD A[Popular cache key expires\nTTL = 300s, no jitter] --> B{All 50 app instances\nmiss simultaneously} B --> C[50 concurrent DB queries\nfor same row] C --> D[DB connection pool exhausted\nQuery queue backs up] D --> E[p99 query: 800ms\nInstances timeout waiting] E --> F[500 errors\nRetries compound load] style A fill:#ff9999 style F fill:#ff6666 G[Same key with TTL jitter\n300s ± 30s] --> H{Instances expire\nstaggered over 60s window} H --> I[~1 DB query per second\nInstead of 50 simultaneous] I --> J[DB load stays flat\nNo queue buildup] J --> K[p99 stays at 12ms\nNo incidents] style G fill:#99ff99 style K fill:#66cc66

3. Layered Caching Architecture

A single Redis cluster is not a caching architecture. At scale, you need multiple cache layers operating at different latencies and scopes, with explicit rules for consistency and promotion between layers.

L1: In-process cache lives inside your application process. Zero network round-trips — sub-microsecond lookups against an in-memory LRU or bounded hash map. The tradeoff is that L1 is per-instance and not shared: if you have 40 application instances, you have 40 independent L1 caches that can diverge from each other. L1 is appropriate for hot reference data that changes infrequently: config objects, feature flags, permission sets, lookup tables. Bounded size is mandatory — an unbounded L1 cache is a memory leak. Typical size: 1,000-10,000 entries.

L2: Redis cluster is the shared cache tier. Millisecond latency, consistent across all application instances, supports atomic operations. Redis Cluster provides horizontal scaling and fault tolerance. This is where the majority of your application's cache reads should be served from. Hit rate target: 85-95% for well-designed applications.

L3: CDN edge cache eliminates origin hits entirely for cacheable HTTP responses. Requests served from CDN edge nodes never reach your application servers — Cloudflare, Fastly, and CloudFront operate hundreds of Points of Presence globally, serving from the edge node closest to the user. Latency target: under 5ms for cache hits. A well-configured CDN can absorb 90%+ of read traffic for public content.

L4: Origin / database is the source of truth. Every request that reaches L4 represents a failure of the layers above it. Hit rates at L4 should be minimized — target under 5% of all read requests hitting the database for any high-traffic path.

Cache promotion ensures a miss at L1 but a hit at L2 repopulates L1 for subsequent requests. A miss at L2 but a hit at CDN is harder to leverage in server-side caching, but CDN hit data can inform cache warming strategies.

Consistency across layers is where complexity lives. When you invalidate a key in L2, your L1 caches across 40 instances still hold the old value. Options: L1 TTL short enough to self-heal quickly (10-30 seconds), explicit L1 invalidation via a pub/sub channel, or accepting brief L1 divergence for data where eventual consistency is acceptable. For permission and authentication data, accept no divergence: skip L1 entirely or use zero-TTL L1 entries that expire immediately.

import time
import json
from collections import OrderedDict
from typing import Optional, Any, Callable
import redis
import threading

class LRUCache:
    """Thread-safe LRU in-process cache with bounded size."""

    def __init__(self, max_size: int = 1000, default_ttl: int = 30):
        self._cache: OrderedDict = OrderedDict()
        self._max_size = max_size
        self._default_ttl = default_ttl
        self._lock = threading.Lock()

    def get(self, key: str) -> Optional[Any]:
        with self._lock:
            if key not in self._cache:
                return None
            value, expires_at = self._cache[key]
            if time.time() > expires_at:
                del self._cache[key]
                return None
            # Move to end (most recently used)
            self._cache.move_to_end(key)
            return value

    def set(self, key: str, value: Any, ttl: Optional[int] = None):
        with self._lock:
            ttl = ttl or self._default_ttl
            expires_at = time.time() + ttl
            if key in self._cache:
                self._cache.move_to_end(key)
            self._cache[key] = (value, expires_at)
            # Evict least recently used if over capacity
            if len(self._cache) > self._max_size:
                self._cache.popitem(last=False)

    def delete(self, key: str):
        with self._lock:
            self._cache.pop(key, None)


class MultiLayerCache:
    """
    L1 (in-process LRU) → L2 (Redis) → L4 (origin/DB) with
    automatic cache promotion on miss.

    Cache promotion: miss at L1 but hit at L2 repopulates L1
    so subsequent requests from this instance avoid the network.

    Coordinated invalidation: invalidation deletes from both
    L1 and L2 simultaneously. L1 divergence window = L1 TTL max.
    """

    def __init__(
        self,
        redis_client: redis.Redis,
        l1_max_size: int = 1000,
        l1_ttl: int = 30,      # Short: L1 divergence window
        l2_ttl: int = 300,     # Longer: shared cache lifetime
    ):
        self._l1 = LRUCache(max_size=l1_max_size, default_ttl=l1_ttl)
        self._l2 = redis_client
        self._l1_ttl = l1_ttl
        self._l2_ttl = l2_ttl

    def get(
        self,
        key: str,
        origin_fn: Optional[Callable] = None,
    ) -> Optional[Any]:
        # L1 check: zero-latency in-process lookup
        value = self._l1.get(key)
        if value is not None:
            return value

        # L2 check: Redis round-trip (~1ms)
        raw = self._l2.get(key)
        if raw is not None:
            value = json.loads(raw)
            # Cache promotion: populate L1 for subsequent requests
            self._l1.set(key, value, ttl=self._l1_ttl)
            return value

        # L4 miss: load from origin/database
        if origin_fn is None:
            return None

        value = origin_fn()
        if value is not None:
            self._populate(key, value)

        return value

    def _populate(self, key: str, value: Any):
        """Populate both L1 and L2."""
        ttl = ttl_with_jitter(self._l2_ttl)
        self._l2.setex(key, ttl, json.dumps(value))
        self._l1.set(key, value, ttl=self._l1_ttl)

    def invalidate(self, key: str):
        """
        Coordinated invalidation: delete from L1 and L2 simultaneously.

        Failure mode: if you only delete from L2, this instance's L1
        continues serving stale data for up to l1_ttl seconds.
        """
        self._l1.delete(key)
        self._l2.delete(key)

    def invalidate_pattern(self, pattern: str):
        """Invalidate all keys matching a Redis glob pattern."""
        # L2 pattern delete
        keys = list(self._l2.scan_iter(pattern))
        if keys:
            self._l2.delete(*keys)
        # L1: cannot pattern-match, rely on TTL expiry
        # For strict L1 invalidation, maintain a reverse index
Comparison visual
flowchart LR U([User Request]) --> L1 subgraph Application Instance L1[L1: In-Process LRU\nSub-microsecond\n1K-10K entries\nTTL: 30s] end L1 -->|miss| L2 L1 -->|hit| R1([Response]) subgraph Shared Cache L2[L2: Redis Cluster\n~1ms latency\nShared across instances\nTTL: 300s] end L2 -->|promote to L1| L1 L2 -->|hit| R2([Response]) L2 -->|miss| L3 subgraph CDN Edge L3[L3: CDN PoP\nCloudflare / Fastly / CloudFront\nunder 5ms global\nHTTP Cache-Control] end L3 -->|hit| R3([Response]) L3 -->|miss| L4 subgraph Origin L4[(L4: Database\nSource of Truth\nTarget under 5% of reads)] end L4 -->|populate L2, L1| L2 L4 --> R4([Response])

4. CDN Caching Strategy

CDN caching is controlled entirely by HTTP response headers. If you do not explicitly set Cache-Control, your CDN will either cache nothing or cache everything with its default TTL — neither is what you want.

Cache-Control directives that matter in production:

  • max-age=N: client-side TTL in seconds
  • s-maxage=N: CDN-side TTL (overrides max-age for shared caches); use this to set different cache lifetimes for browsers vs CDN
  • stale-while-revalidate=N: serve stale content for N seconds while fetching a fresh version in the background. This is the single most impactful directive for perceived latency — a user never waits for a cache refresh
  • stale-if-error=N: serve stale content for N seconds if the origin returns a 5xx error. This is your CDN-level circuit breaker for origin outages
  • no-store: do not cache under any conditions (authentication pages, payment flows)
  • private: cacheable by browsers but not CDNs

Surrogate keys (cache tags) let you purge all CDN-cached responses related to a piece of content with a single API call. When you update a product, you purge product-8842 and every CDN edge node globally drops all responses tagged with that key — product detail pages, search result snippets, recommendation widgets — regardless of their remaining TTL. Cloudflare calls these Cache Tags. Fastly calls them Surrogate-Keys. CloudFront requires implementing the equivalent with a custom header and Lambda@Edge.

The Vary header instructs the CDN to cache separate response copies for different request header values. Vary: Accept-Encoding is standard (gzip vs brotli). Vary: Accept-Language creates per-language cache buckets. Avoid Vary: Cookie or Vary: Authorization — these make the vast majority of responses uncacheable at the CDN since nearly every authenticated user sends a unique cookie.

CDN origin shield (called Origin Shield in CloudFront, Shielding in Fastly, Tiered Cache in Cloudflare) collapses all edge cache misses through a single intermediate node before reaching your origin. Without origin shield, a cold cache across 250 edge nodes means 250 simultaneous origin requests for the same content. With origin shield, those 250 edge nodes coalesce into one origin request. Required for any CDN purge event — the moment you invalidate a popular content tag, origin shield prevents the invalidation from becoming a traffic spike.

from fastapi import FastAPI, Request, Response
from fastapi.responses import JSONResponse
import httpx
import hashlib
import json
import time
from typing import Optional
import redis

app = FastAPI()
r = redis.Redis(host="localhost", port=6379, decode_responses=True)

CLOUDFLARE_ZONE_ID = "your-zone-id"
CLOUDFLARE_API_TOKEN = "your-api-token"


def set_cache_headers(
    response: Response,
    max_age: int = 60,
    s_maxage: int = 300,
    stale_while_revalidate: int = 60,
    stale_if_error: int = 86400,
    cache_tags: Optional[list[str]] = None,
):
    """
    Set Cache-Control and CDN cache tag headers.

    s_maxage > max_age: CDN holds content longer than browsers,
    preventing origin requests while allowing browser refresh.

    stale-while-revalidate: users never wait for cache refresh,
    background revalidation happens asynchronously.

    stale-if-error: CDN serves stale content during origin outages
    — your circuit breaker at the edge.
    """
    directives = [
        f"public",
        f"max-age={max_age}",
        f"s-maxage={s_maxage}",
        f"stale-while-revalidate={stale_while_revalidate}",
        f"stale-if-error={stale_if_error}",
    ]
    response.headers["Cache-Control"] = ", ".join(directives)

    if cache_tags:
        # Cloudflare: Cache-Tag header (comma-separated)
        response.headers["Cache-Tag"] = ",".join(cache_tags)
        # Fastly: Surrogate-Key header (space-separated)
        response.headers["Surrogate-Key"] = " ".join(cache_tags)


@app.get("/api/products/{product_id}")
async def get_product(product_id: int, response: Response):
    """
    Product endpoint with multi-layer caching and CDN cache tags.
    Cache tags enable targeted purge on product update without
    flushing the entire CDN cache.
    """
    cache_key = build_cache_key("catalog", "product", product_id, "v2")

    # Try Redis first
    cached = r.get(cache_key)
    if cached:
        product = json.loads(cached)
    else:
        # Load from DB (simulated)
        product = {"id": product_id, "name": "Widget", "price": 99.99}
        r.setex(cache_key, ttl_with_jitter(300), json.dumps(product))

    set_cache_headers(
        response,
        max_age=60,
        s_maxage=300,
        stale_while_revalidate=60,
        stale_if_error=86400,
        cache_tags=[f"product-{product_id}", "products"],
    )

    return product


async def purge_cloudflare_cache_tags(tags: list[str]):
    """
    Programmatic CDN purge via Cloudflare API on content update.

    Call this after every product write so CDN-cached pages
    immediately reflect the new state. Without purge, users see
    stale CDN responses for up to s_maxage seconds.
    """
    async with httpx.AsyncClient() as client:
        resp = await client.post(
            f"https://api.cloudflare.com/client/v4/zones/{CLOUDFLARE_ZONE_ID}/purge_cache",
            headers={
                "Authorization": f"Bearer {CLOUDFLARE_API_TOKEN}",
                "Content-Type": "application/json",
            },
            json={"tags": tags},
        )
        resp.raise_for_status()
        return resp.json()


@app.put("/api/products/{product_id}")
async def update_product(product_id: int, data: dict):
    """
    Write path: update DB, invalidate Redis, purge CDN.
    Three-layer invalidation: Redis (immediate) + CDN (programmatic purge).
    """
    # DB write (simulated)
    # await db.execute("UPDATE products SET ... WHERE id = ?", ...)

    # Redis invalidation with double-delete
    cache_key = build_cache_key("catalog", "product", product_id, "v2")
    double_delete_write(
        cache_key,
        lambda: None,  # DB write already done above
    )

    # CDN purge: clears all edge-cached responses tagged with this product
    await purge_cloudflare_cache_tags([
        f"product-{product_id}",
    ])

    return {"status": "updated", "id": product_id}

5. Distributed Cache Patterns for Correctness

Performance is the headline, but correctness is the real requirement. A cache that serves wrong data is worse than no cache.

Read-your-writes consistency is the failure mode that frustrates users most visibly. A user posts a comment. The write succeeds. They reload their feed. The comment is not there — it is in the database, but the cached feed snapshot has not been refreshed yet. From the user's perspective, their action had no effect.

The solution is a short-circuit bypass: after a write, mark the user's session as "recently wrote" with a very short TTL (5-10 seconds). On subsequent reads within that window, bypass the cache and read directly from the database primary. After the window closes, resume normal cache-served reads. This adds negligible overhead — the bypass window is short, and most users are not writing continuously.

Negative caching prevents database hammering on missing keys. Without it, every request for a non-existent user ID (common in scraping, enumeration attempts, and cache stampedes after a delete) hits the database. Cache a sentinel value for not-found results with a short TTL (30-60 seconds). The cache returns the sentinel, your application interprets it as a miss, and the database is protected.

import hashlib
import time
from typing import Optional, Any, Callable
import redis
import json

r = redis.Redis(host="localhost", port=6379, decode_responses=True)

NEGATIVE_SENTINEL = "__NOT_FOUND__"
NEGATIVE_TTL = 60  # Cache not-found for 60s; prevents DB hammering


def cache_with_negative(
    key: str,
    db_read_fn: Callable,
    positive_ttl: int = 300,
) -> Optional[Any]:
    """
    Cache-aside with negative caching.

    Failure mode prevented: without negative caching, every request
    for a deleted or non-existent record hits the database.
    Common in scraping attacks and after delete operations.
    """
    cached = r.get(key)

    if cached == NEGATIVE_SENTINEL:
        return None  # Known not-found, skip DB entirely

    if cached is not None:
        return json.loads(cached)

    value = db_read_fn()

    if value is None:
        # Cache the not-found result with short TTL
        r.setex(key, NEGATIVE_TTL, NEGATIVE_SENTINEL)
        return None

    r.setex(key, ttl_with_jitter(positive_ttl), json.dumps(value))
    return value


def generate_etag(content: Any) -> str:
    """Generate ETag from content hash for conditional GET."""
    content_bytes = json.dumps(content, sort_keys=True).encode()
    return hashlib.sha256(content_bytes).hexdigest()[:16]


from fastapi import FastAPI, Request, Response
from fastapi.responses import JSONResponse

app = FastAPI()


@app.get("/api/articles/{article_id}")
async def get_article(article_id: int, request: Request, response: Response):
    """
    Conditional GET with ETag and 304 Not Modified.

    Reduces bandwidth: client caches response + ETag, sends
    If-None-Match on subsequent requests. Server returns 304
    if content unchanged — no body transmitted.

    Combine with Redis: ETag stored alongside content,
    check ETag before serializing full response body.
    """
    cache_key = build_cache_key("content", "article", article_id, "v1")
    etag_key = f"{cache_key}:etag"

    # Load content (from cache or DB)
    content = cache_aside_read(
        cache_key,
        lambda: {"id": article_id, "title": "Article", "body": "..."},
    )

    if content is None:
        return JSONResponse({"error": "Not found"}, status_code=404)

    current_etag = r.get(etag_key)
    if current_etag is None:
        current_etag = generate_etag(content)
        r.setex(etag_key, 300, current_etag)

    # Check If-None-Match: return 304 if client has current version
    client_etag = request.headers.get("if-none-match")
    if client_etag and client_etag == f'"{current_etag}"':
        return Response(status_code=304)

    response.headers["ETag"] = f'"{current_etag}"'
    response.headers["Cache-Control"] = "public, max-age=60, s-maxage=300"

    return content


def sticky_read_bypass(
    user_id: str,
    cache_key: str,
    db_read_fn: Callable,
    bypass_ttl: int = 10,
    cache_ttl: int = 300,
) -> Any:
    """
    Read-your-writes: bypass cache for users who recently wrote.

    Failure mode prevented: user writes data, immediately reads
    their feed/profile, cache returns pre-write state — user
    thinks their write was lost.
    """
    bypass_key = f"bypass:{user_id}"

    if r.exists(bypass_key):
        # User recently wrote — read from DB primary directly
        return db_read_fn()

    return cache_aside_read(cache_key, db_read_fn, ttl=cache_ttl)


def mark_user_wrote(user_id: str, bypass_ttl: int = 10):
    """
    Call after any write by user_id to activate bypass window.
    Expires automatically after bypass_ttl seconds.
    """
    r.setex(f"bypass:{user_id}", bypass_ttl, "1")

6. Monitoring and Debugging Cache Behavior

A cache you cannot observe is a cache you cannot trust. Hit rate drops before incidents — instrument early.

Redis INFO stats provide cluster-wide metrics: keyspace_hits, keyspace_misses, evicted_keys, expired_keys, used_memory, connected_clients. Calculate hit rate as hits / (hits + misses). Target: above 85% for general application caches, above 95% for high-traffic public APIs. A hit rate drop from 92% to 78% on a Tuesday afternoon is a signal, not noise — investigate what changed.

Eviction monitoring tells you when your cache is under memory pressure. When Redis reaches maxmemory, it applies its eviction policy (allkeys-lru, volatile-lru, allkeys-random, etc.). Evictions are visible in evicted_keys from INFO. If eviction rate is non-zero, your cache is too small for your working set — either increase memory, reduce key sizes, or lower TTLs on lower-priority keys. allkeys-lru is the right policy for most application caches: evict the least recently used key regardless of TTL.

Key-level inspection:
- TTL key returns remaining TTL in seconds (-1 = no expiry, -2 = key does not exist)
- DEBUG OBJECT key returns serialized length, encoding, and LRU idle time
- OBJECT ENCODING key shows memory encoding: ziplist/listpack for small hashes (compact), hashtable for large ones (more memory)
- OBJECT FREQ key (requires maxmemory-policy lfu) shows access frequency

Latency percentiles are the most actionable metric for cache health. Measure p50, p95, and p99 for cache reads (Redis round-trip) vs database reads. Target: Redis p99 under 5ms, database p99 under 50ms for indexed reads. A Redis p99 spike to 50ms is usually a network issue or a large key serialization bottleneck.

Cache poisoning detection: if your application deserializes cached values without validation, a compromised Redis node or a serialization bug can inject malformed data. Store a checksum alongside the cached value and verify on read. Discard and reload from DB on checksum mismatch — this converts a poisoning event into a cache miss rather than a corrupted read.

Alerting thresholds to configure:
- Hit rate < 80%: alert immediately, investigate DB load
- Eviction rate > 100 keys/sec: investigate memory pressure
- Redis p99 latency > 10ms: investigate network or large key sizes
- keyspace_misses spike: correlate with deployment events (schema version change causes full miss)
- connected_clients near maxclients (default 10,000): connection leak or pool misconfiguration

import redis
import time
from typing import Dict

r = redis.Redis(host="localhost", port=6379, decode_responses=True)


def get_cache_stats() -> Dict:
    """
    Pull key cache health metrics from Redis INFO.
    Returns hit_rate, eviction_rate, memory_usage_pct.
    """
    info = r.info()
    stats = r.info("stats")
    memory = r.info("memory")

    hits = stats.get("keyspace_hits", 0)
    misses = stats.get("keyspace_misses", 0)
    total = hits + misses

    hit_rate = (hits / total * 100) if total > 0 else 0

    used_memory = memory.get("used_memory", 0)
    max_memory = memory.get("maxmemory", 0)
    memory_pct = (used_memory / max_memory * 100) if max_memory > 0 else 0

    return {
        "hit_rate_pct": round(hit_rate, 2),
        "keyspace_hits": hits,
        "keyspace_misses": misses,
        "evicted_keys": stats.get("evicted_keys", 0),
        "expired_keys": stats.get("expired_keys", 0),
        "used_memory_mb": round(used_memory / 1024 / 1024, 1),
        "memory_usage_pct": round(memory_pct, 2),
        "connected_clients": info.get("connected_clients", 0),
    }


def inspect_key(key: str) -> Dict:
    """
    Inspect a specific cache key for TTL, encoding, and memory usage.
    Use DEBUG OBJECT to identify large keys that inflate memory or
    increase serialization latency.
    """
    ttl = r.ttl(key)
    encoding = r.object_encoding(key)

    try:
        debug_obj = r.debug_object(key)
    except Exception:
        debug_obj = {}

    return {
        "key": key,
        "ttl_seconds": ttl,
        "encoding": encoding,
        "serialized_length_bytes": debug_obj.get("serializedlength"),
        "lru_idle_seconds": debug_obj.get("lru_seconds_idle"),
    }


def check_cache_health(hit_rate_threshold: float = 80.0) -> Dict:
    """
    Health check function for monitoring integration (Datadog, Prometheus).
    Returns status=WARN or CRITICAL with actionable diagnostics.
    """
    stats = get_cache_stats()
    warnings = []

    if stats["hit_rate_pct"] < hit_rate_threshold:
        warnings.append(
            f"Hit rate {stats['hit_rate_pct']}% below threshold "
            f"{hit_rate_threshold}% — check DB load"
        )

    if stats["memory_usage_pct"] > 85:
        warnings.append(
            f"Memory at {stats['memory_usage_pct']}% — "
            f"increase maxmemory or audit key sizes"
        )

    status = "OK" if not warnings else "WARN"

    return {"status": status, "stats": stats, "warnings": warnings}

Conclusion

Cache invalidation is a consistency problem that presents as a performance problem. When your cache is lying — serving stale prices, outdated permissions, deleted content — the debugging path is long because the symptoms (wrong data, user complaints) look nothing like the cause (a race condition between a write and a read that occurs in a 50-millisecond window at peak traffic).

The patterns in this post map to specific failure modes. Double-delete prevents stale repopulation from concurrent readers. TTL jitter and XFetch prevent thundering herds on key expiry. Layered caching with cache promotion keeps hit rates above 90% while containing the footprint of any single layer's inconsistency. CDN cache tags with programmatic purge prevent content updates from being invisible at the edge for minutes or hours. Negative caching stops database hammering from non-existent key lookups. Read-your-writes bypass prevents users from losing confidence in your application's responsiveness.

The production numbers that matter: hit rate above 85% for Redis (above 95% for high-traffic public APIs), Redis p99 under 5ms, CDN serving 80%+ of public read traffic, database receiving under 5% of total reads. If your numbers are below these targets, the gap is almost always one of the patterns above — not hardware or infrastructure.

Start with correct key design, add TTL jitter from day one, implement double-delete on any write path that has concurrent readers, and instrument hit rate before you need to debug it. The cache that does not lie is not one that never has misses — it is one where every miss is intentional and every hit is fresh.


Sources

About the Author

Toc Am

Founder of AmtocSoft. Writing practical deep-dives on AI engineering, cloud architecture, and developer tooling. Previously built backend systems at scale. Reviews every post published under this byline.

LinkedIn X / Twitter

Published: 2026-06-18 · Updated: 2026-04-18 · Written with AI assistance, reviewed by Toc Am.

Get These In Your Inbox

Weekly deep-dives on AI engineering, no fluff. Join the newsletter →

Subscribe (free)

Or grab the book ($39, ~100 pages) · Buy me a coffee

☕ Buy Me a Coffee · 🔔 YouTube · 💼 LinkedIn · 🐦 X/Twitter
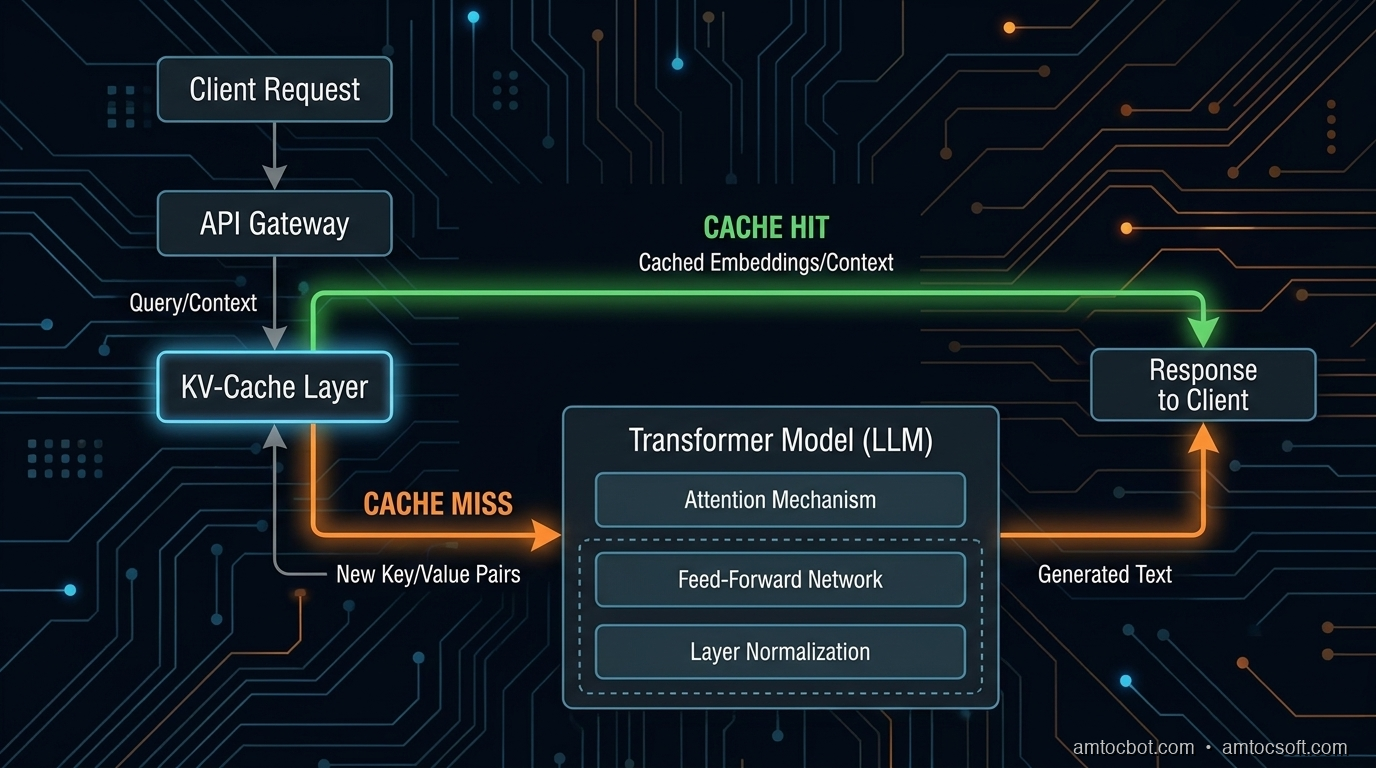
What Happens When You Hit "Regenerate"

You tap regenerate like it's a cheap retry. The last answer sits there, almost right, and the button looks like an eraser. It isn't....