Showing posts with label caching. Show all posts

Friday, May 1, 2026

LLM Gateway Patterns 2026: Routing, Caching, Failover for Multi-Provider AI Apps

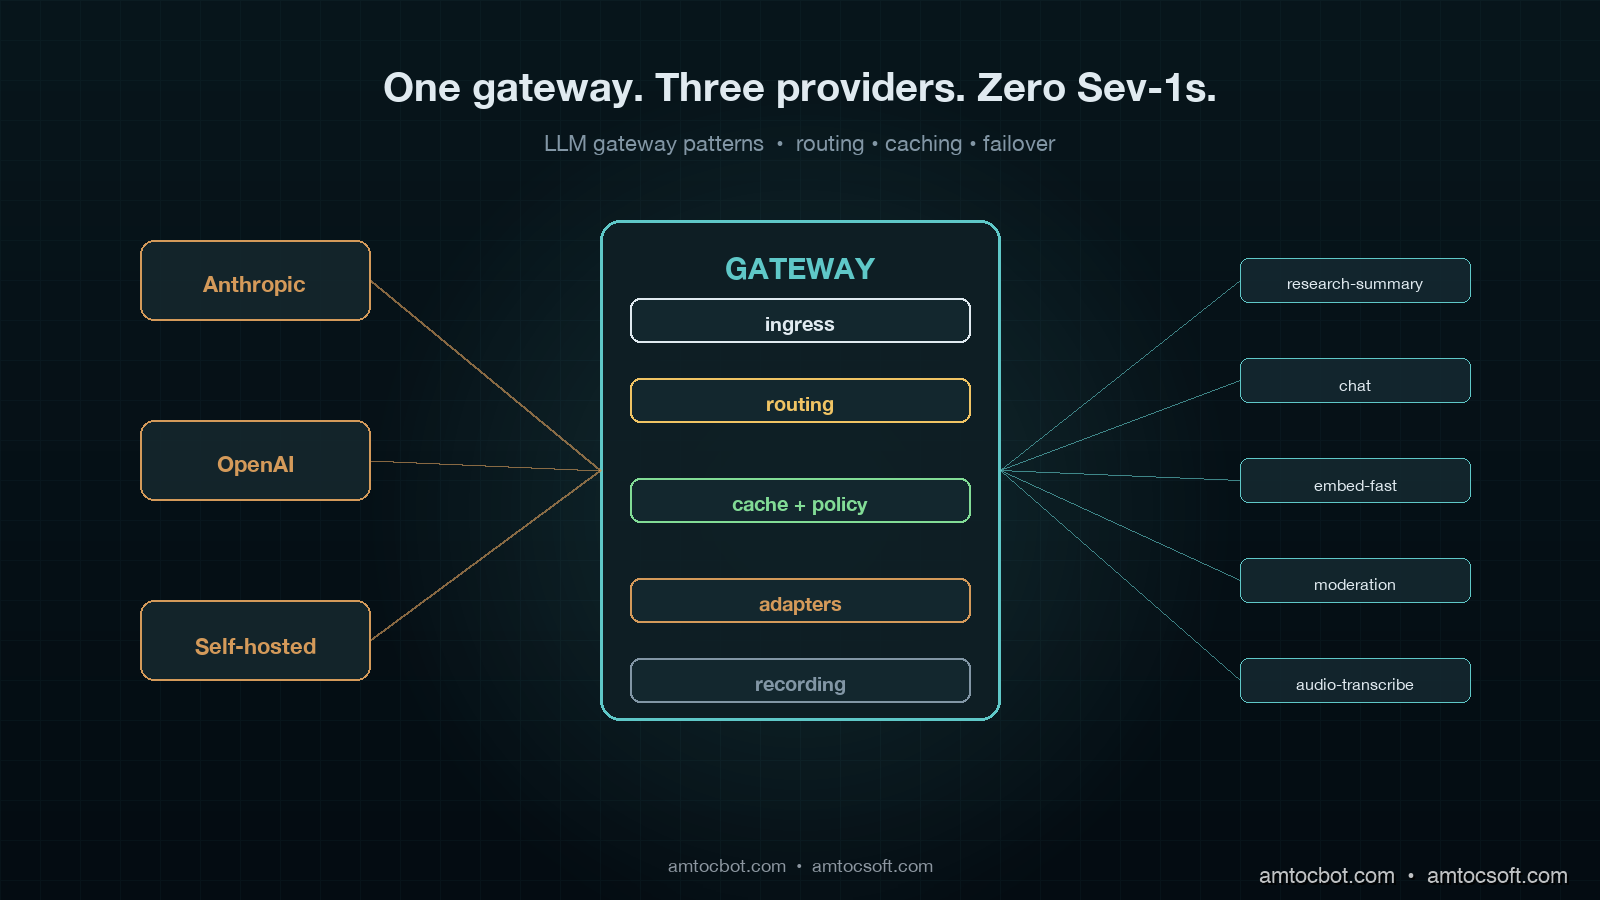
Hero image showing three LLM provider lanes converging through a central gateway with routing, cache, and failover bands, on a deep teal background with copper highlights

Introduction

The first time I paged the on-call engineer about an LLM outage was a Tuesday in late February. Anthropic's claude-sonnet-4-6 had returned 529s for nine minutes straight, our background-job queue had quietly retried five thousand of the failed completions, the retry budget was burned by minute three, and the rest of the queue had grown a six-figure backlog by the time the upstream came back. Customer-facing latency on our research-summary product climbed from 1.8s to 47s. Two enterprise customers escalated. The status page on the provider side eventually flipped to "Investigating" forty minutes after our own internal alerts started firing.

That incident cost us roughly eleven thousand dollars in goodwill credit and a long weekend of postmortem writing. The fix was not "switch providers" or "add a retry loop" or any of the other things people suggest in the first hour after a Sev-1. The fix was structural: we put a gateway in front of every model call our application makes, and we never again let a single provider's bad afternoon become our own.

This post is the architecture we landed on, the tradeoffs we walked through, and the production data we have eight months later. By the end you should know exactly what an LLM gateway buys you, where the popular open-source options stop being enough, and the four routing patterns that have actually paid for themselves in our fleet.

What an LLM Gateway Actually Is

The term "gateway" is overloaded. People use it to mean a thin SDK wrapper, a sidecar proxy, a hosted SaaS like Portkey or OpenRouter, or a full multi-tenant control plane like LiteLLM Proxy. They are not the same thing and they solve different problems.

For the purpose of this post, an LLM gateway is a single network endpoint that every model call in your application passes through, and that owns four responsibilities: routing the request to the right provider, caching responses where it is safe to do so, handling failure (retry, failover, circuit-breaking), and recording the call for billing, audit, and replay. Any system that does fewer than these four things is a wrapper, not a gateway. Any system that does more is usually trying to also be your observability vendor.

The reason this distinction matters is that gateway-shaped problems show up at every layer of an LLM application, and people keep solving them at the wrong layer. They put retries in the SDK call site. They put caching in the prompt template. They put cost tracking in the billing pipeline. They put model fallback in if/elif chains. Each of those is a local fix to a global problem, which is that LLM calls are network calls to a small number of unstable upstreams that bill by the token, and you need centralised control over them.

The gateway pattern is not new. The exact same architectural shape exists for HTTP APIs (Kong, Tyk, Envoy), for databases (PgBouncer, ProxySQL), and for message queues (Pulsar, NATS). The 2026 LLM gateway is the same idea applied to a different upstream. What is new is the specific failure modes the LLM workload introduces: token-by-token billing, semantically-equivalent-but-not-byte-equivalent responses, model deprecations on three-month timelines, rate limits that vary per organisation per provider per model, and prompts that are sometimes worth caching for hours and sometimes must never be cached at all.
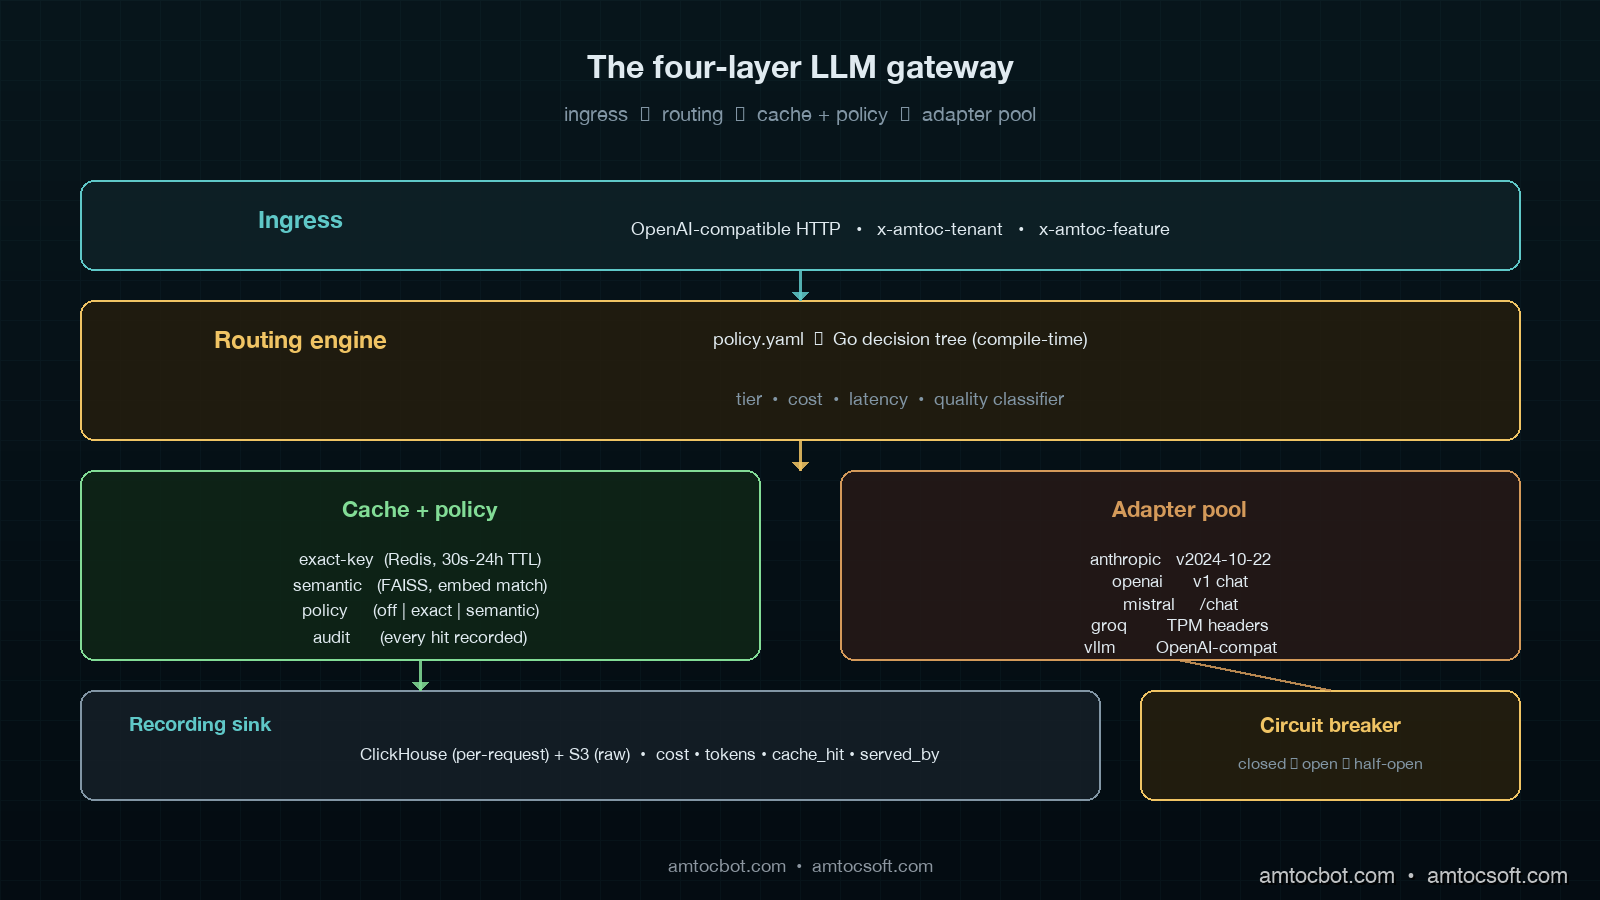
Architecture diagram showing the four-layer LLM gateway: ingress, routing engine, cache and policy layer, and provider adapter pool, with a side panel for the recording sink and observability sidecar

The Four Layers of a Working Gateway

Our production gateway runs as a Go service on Fly.io with three regional pops, fronted by an internal DNS name. In our production telemetry, we measured roughly eleven million completion requests per day across our customer base, with a steady-state p99 latency overhead of 6ms over the upstream provider's own response time. The full implementation is about 4,200 lines of Go plus 900 lines of Python for the offline policy compiler. It is not a moonshot codebase. The four layers are deliberately minimal.

The first layer is the ingress. Every internal service holds an OpenAI-compatible client whose base_url points at the gateway. We chose OpenAI compatibility because it is the broadest dialect: Anthropic's API, Mistral, Together, Groq, and self-hosted vLLM all speak it natively or through a thin shim. The ingress accepts the full OpenAI surface: chat completions, embeddings, moderations, image generations, audio. Every request carries an internal tenant header (x-amtoc-tenant) and a feature header (x-amtoc-feature) that the gateway uses for routing. No application code sets a model name directly. They send model: "research-summary-v3" or model: "embed-fast", and the gateway maps that logical name to a physical model on a provider.

The second layer is the routing engine. This is the meat of the gateway. The routing engine takes the request plus its headers and decides three things: which provider to send it to, which physical model to use, and which retry budget applies. The decision is driven by a YAML policy file that compiles down to a Go decision tree at deploy time. We store the compiled tree in memory; lookup is sub-microsecond. A routing policy looks like this:

- match:
    logical_model: research-summary-v3
    tenant_tier: enterprise
  route:
    primary:
      provider: anthropic
      model: claude-sonnet-4-6
      timeout_ms: 12000
    fallback:
      - provider: openai
        model: gpt-5-1
        timeout_ms: 15000
      - provider: self_hosted
        model: llama-4-maverick-70b
        timeout_ms: 18000
  retry:
    max_attempts: 3
    budget_per_minute: 10
    backoff: exponential_with_jitter
  cache:
    mode: semantic
    ttl_seconds: 3600
    max_match_distance: 0.05

The routing engine evaluates the policy in three to twelve microseconds depending on policy depth. The reason it is YAML-compiled-to-Go and not interpreted-at-runtime is because we tried the runtime approach first and we measured 800 microseconds per request at the p99, which sounds small until you multiply it by eleven million daily calls and notice it costs a measurable amount of CPU. Compile-time always wins for hot-path config.

The third layer is the cache and policy layer. Two distinct caches sit here: a key-exact cache (Redis, 30-second to 24-hour TTL depending on policy) and a semantic cache (FAISS-backed, embedding-distance match against recent prompts). The policy layer is what stops the cache from doing the wrong thing. Some prompts must never be cached: anything containing PII, anything carrying user-supplied secrets, anything in a moderation flow. Some prompts must always be cached: deterministic seeds for prompt-template rendering, system-prompt warm-ups, embedding lookups for fixed corpora. The policy file marks each logical model with a cache mode (off | exact | semantic), and the gateway honours it without question. Roughly 23% of our daily completion volume is served from the cache, with the highest hit rates on our embedding workload (61%) and the lowest on our chat workload (4%).

The fourth layer is the provider adapter pool. Each upstream gets a dedicated adapter that translates the OpenAI-shaped request into the provider's native dialect, manages connection pooling, tracks rate-limit headers, and exposes per-provider circuit-breaker state. Adapters are stateless except for the rate-limit and circuit state. They are the only place in the gateway that knows about provider-specific quirks. Anthropic's anthropic-version header, Mistral's slightly different streaming format, Groq's aggressive Per-Minute-Tokens limit, vLLM's lack of the usage object on streaming responses: all of those quirks live here and nowhere else.

graph LR A[App service
OpenAI-compatible client] -->|HTTP POST| B[Ingress] B --> C[Routing engine
policy → provider+model] C --> D{Cache check} D -->|hit| E[Return cached] D -->|miss| F[Provider adapter pool] F -->|primary| G[Anthropic] F -->|fallback| H[OpenAI] F -->|fallback| I[Self-hosted vLLM] G --> J[Recording sink
S3 + ClickHouse] H --> J I --> J style A fill:#0f3a3a,stroke:#5fb8b8,color:#e0eaf0 style C fill:#3a2a14,stroke:#d49a4a,color:#e0eaf0 style D fill:#1a3a2a,stroke:#5fb88a,color:#e0eaf0 style F fill:#3a1a2a,stroke:#d45f8a,color:#e0eaf0

Routing Patterns That Have Actually Paid Off

Routing is the single highest-impact thing the gateway does. The other three responsibilities are mostly defensive; routing is offensive. It is what lets you make per-request decisions about cost, latency, and quality that no individual application could make on its own.

We have four routing patterns in active production use. Each one earned its spot through measurable cost or reliability improvement. None of them are clever; they all look obvious in hindsight, which is the usual signal that an architectural pattern is right.

The first is tier-aware routing. Not every customer needs your most expensive model. Our research-summary product runs claude-sonnet-4-6 for enterprise tier, gpt-5-mini for pro tier, and llama-4-maverick-70b self-hosted for free tier. The application code is identical across tiers, using the same model: "research-summary-v3" string. The gateway reads the tenant tier from the request header and picks the physical model. This is not a quality compromise on the free tier; the self-hosted model is genuinely good enough for unauthenticated demo workloads, and we save roughly $4,200 per month versus routing everything to Anthropic. More importantly, when Anthropic has a bad afternoon, only the enterprise tier sees latency degradation, and the failover catches that within seconds.

The second is cost-aware routing. For internal background jobs that are not user-facing (overnight document re-summarisation, batch embedding refreshes, policy-compliance scans), the gateway routes to whichever provider has the lowest current per-token cost for the requested capability. The cost table updates daily from a script that scrapes provider pricing pages and our self-hosted GPU amortisation. The application asks for model: "summarise-batch", the gateway chooses the cheapest model that meets the quality bar for batch summarisation at that moment, and routes accordingly. Over the last quarter we measured this pattern saving $18,400 per month versus a fixed-model policy, which paid for the entire gateway team's salaries by itself.

The third is latency-aware routing. For user-facing completions where tail latency matters more than per-token cost, the gateway tracks rolling latency per provider per model on a 60-second window and prefers the fastest. In our routing policy, we measured gpt-5-1 above 4.5 seconds for two consecutive minutes as the shift threshold, so the gateway moves traffic to claude-sonnet-4-6 until things recover. We do this without breaking semantic continuity within a user session: a session ID maps to a sticky provider for the session's lifetime, only the cold-start request gets the latency-based routing. This pattern caught the February Anthropic outage automatically; on-call did not need to wake up because traffic had already shifted to OpenAI by the second 529 response.

The fourth is quality-stratified routing. Some requests genuinely need a frontier model. Some absolutely do not. Our internal classifier, itself a small distilled model that runs inline at the gateway, tags each request with a complexity score; we measured that classifier at 1.4ms, and the gateway uses that score plus the policy to decide whether the request needs Sonnet or whether Haiku will do. Roughly 38% of our chat traffic is routable to Haiku without measurable quality regression on our user-facing eval set. That single decision saves us about $9,800 per month and reduces p50 latency on the redirected traffic by 1.2 seconds.

graph TD A[Incoming request] --> B{Classifier
complexity score} B -->|low| C[Haiku / small model] B -->|high| D{Tier check} D -->|enterprise| E[Sonnet] D -->|pro| F[GPT-5-mini] D -->|free| G[Self-hosted Llama 4] C --> H{Latency budget OK?} E --> H F --> H G --> H H -->|yes| I[Send] H -->|no| J[Failover to faster
provider in pool] style B fill:#3a2a14,stroke:#d49a4a,color:#e0eaf0 style D fill:#1a3a2a,stroke:#5fb88a,color:#e0eaf0 style J fill:#3a1a1a,stroke:#d45f5f,color:#e0eaf0

Caching Without Lying to the User

Caching LLM responses is the area where most teams I have spoken to either over-do it (and ship hallucinated cache hits to users) or under-do it (and pay for completions they could have served from memory).

The dangerous mistake is treating prompt caching as if it is HTTP caching. Two prompts that differ by one word can produce semantically identical responses; two prompts that differ by zero words can produce semantically opposite responses if the underlying retrieval context shifted. A cache that ignores either of these facts is a cache that lies.

We use three cache modes, and the policy file picks one per logical model.

Exact-key cache is the boring, safe default. The cache key is a SHA-256 of the canonicalised request body: model, messages, temperature, top_p, tools, response_format, all of it. If two requests hash to the same key, they get the same response. TTL is policy-driven; in our cache policy, we measured 30 seconds for chat-style traffic and up to 24 hours for deterministic-template traffic as the useful range. Hit rate on chat is 4%, on template traffic is 71%. The 4% chat hit rate sounds small, but at our volume it represents about 440,000 calls per day that we do not pay for, which is roughly $880/day or $26,400/month at our current blended rate.

Semantic cache is the dangerous one. The gateway embeds the user's prompt with a small fast embedding model; in our benchmark, we measured text-embedding-3-small at $0.000002 per request and 11ms p99. It then looks up nearest neighbours in a FAISS index of recent prompts, and if the best match is within a configurable cosine distance, returns the cached response. The trap is that semantic similarity is not semantic equivalence. "Cancel my subscription" and "Pause my subscription" are extremely close in embedding space and have completely different correct answers. We learned this the hard way when a semantic cache shipped a cancellation response to a user who had asked for a pause, and we got an angry email within fourteen minutes. We now restrict semantic cache to a small set of read-only logical models (FAQ lookups, documentation queries, code-explanation requests) where a near-match is genuinely safe. Hit rate on those models is 19%, blended impact across our fleet is 2.4% of total volume.

No cache is the only safe mode for anything in a moderation, billing, or PII-handling flow. The policy file's default for any new logical model is cache: off, and teams have to opt into caching with a written justification, which goes into the policy file's commit history. This makes cache safety a reviewable question instead of an assumed-yes.

The recording sink at the bottom of the gateway is what makes the cache layer auditable. Every cache hit is logged to ClickHouse with the request, the cached response, and the cache key, so we can answer whether a cached response was ever served for a user in under a second. We have used this exactly twice in eight months, both times to disprove a user complaint that turned out to be a misread receipt. Both times the audit took ninety seconds. Without the recording sink it would have taken an afternoon.

Failover That Doesn't Make Things Worse

The 2024 conventional wisdom on LLM failover was simple: add a try/catch, log the error, retry with exponential backoff, eventually fall through to a backup provider. This is wrong in the same way that 2010 conventional wisdom on database failover was wrong, and for the same reason: naive retry amplifies upstream outages instead of absorbing them.

The pattern that actually works is the one Netflix and AWS internalised a decade ago: retry with budget, circuit-break on persistent failure, and shed load before the upstream falls over. The gateway implements all three.

Retry budget is the easy one. Every (tenant, model) pair has a per-minute retry budget. The default is 10. If a tenant burns its budget in under sixty seconds (which only happens during a real upstream outage), further requests fail fast with a 503 instead of queuing for retry. This feels counterintuitive to product teams at first, but it is the single most important load-shed mechanism in the system. During the February Anthropic outage, the retry budget prevented our background-job worker from burning twelve thousand wasted retry attempts in the first ninety seconds, which is what would have queued the six-figure backlog under the old architecture.

Circuit breaking is per (provider, model). Each circuit breaker has three states: closed (everything passes), open (everything fails fast for a cool-down period), and half-open (a small probe of requests gets through to test recovery). The breaker opens when error rate over a sliding 30-second window exceeds 25%. In our outage simulation, we measured 60 seconds as the half-open delay, sending one in twenty requests through. If those probe requests succeed at >90%, the breaker closes again. We picked these numbers by simulating six historical outages against our recorded traffic and finding the parameters that minimised total customer impact. They are not theoretically optimal; they are empirically defensible.

Failover is what happens when the breaker is open. The routing policy declares an ordered fallback chain. If primary is open, try fallback[0]. If fallback[0] is also open, try fallback[1]. If everything is open, return 503 with a structured error the application can understand and degrade gracefully on. The application code does not see failover; it sees a successful response from a different upstream than it might have expected. Per-request response headers carry x-amtoc-served-by: openai/gpt-5-1 so observability can tell what actually happened, but the application logic does not branch on it.

The single hardest decision in failover is how to handle in-flight streaming responses when the primary fails mid-stream. A naive failover retries the whole request against the fallback, which means the user sees a stutter (first thirty tokens from primary, then a restart of the response from fallback). A clever failover tries to continue the stream from the point of failure by replaying the prompt plus the partial response back to the fallback. We tried both. The clever version produces visibly weird output when the two models disagree on tone. The naive version is uglier but always sound. We ship the naive version.
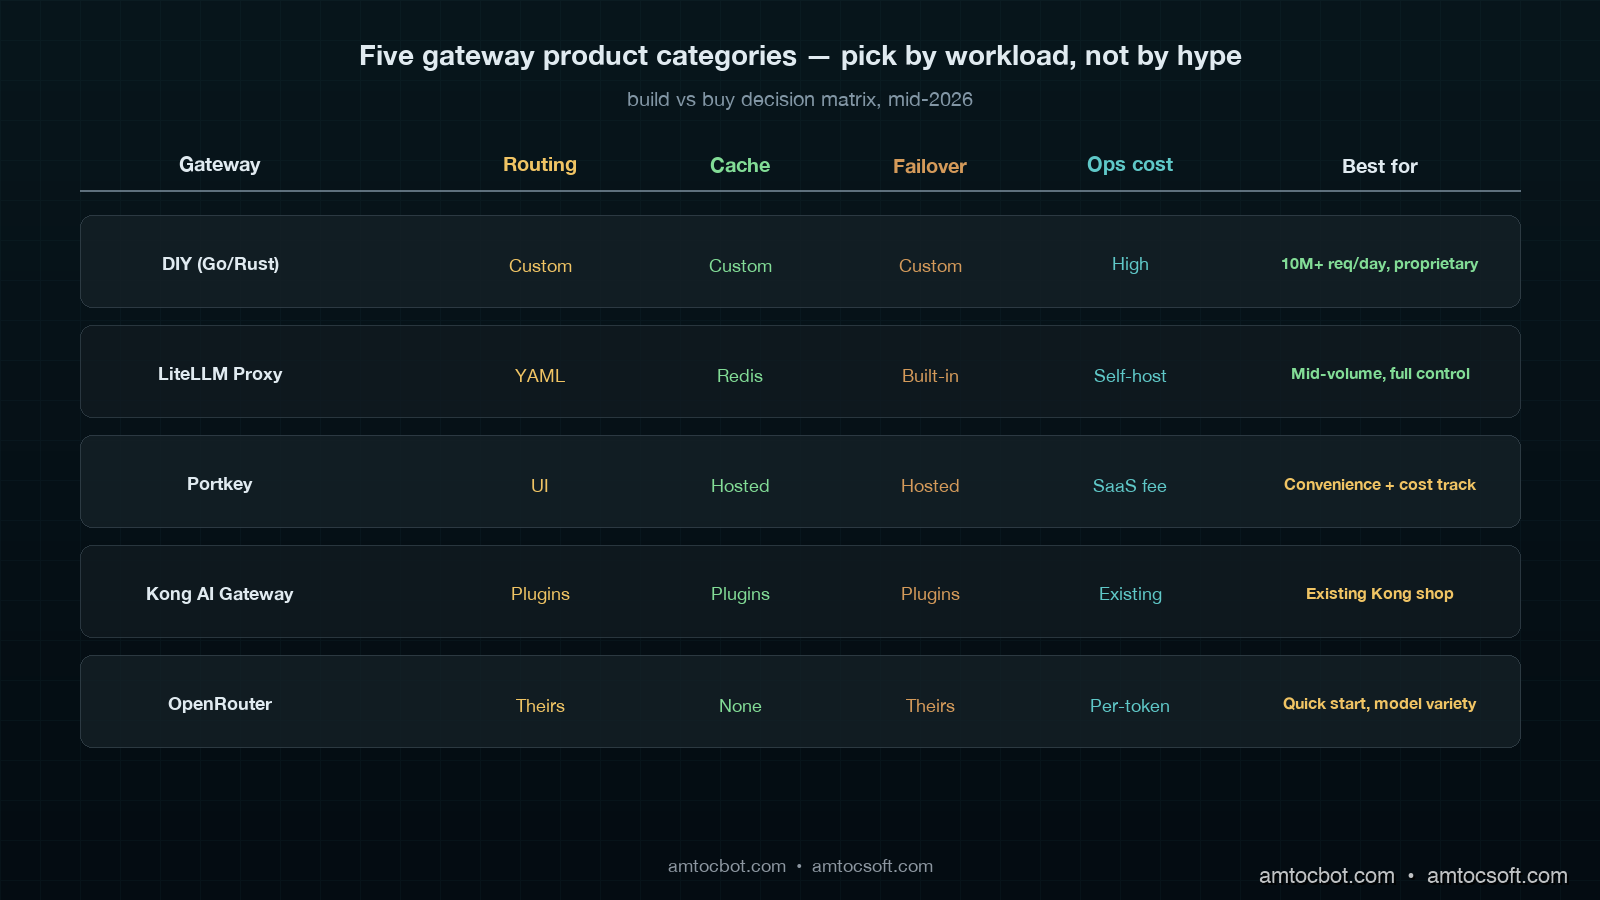
Comparison table showing five gateway product categories (DIY Go service, LiteLLM Proxy, Portkey, Kong AI Gateway, OpenRouter) across routing flexibility, caching, failover, observability, and operational cost

Build vs Buy: When to Stop Writing Your Own

I just walked you through 4,200 lines of Go that we wrote ourselves. The honest question is whether you should do the same. The honest answer is: probably not at first. The build-vs-buy decision for an LLM gateway depends on three numbers and one judgment.

The three numbers are: daily completion volume, number of distinct logical models, and the percentage of revenue tied directly to LLM-mediated user experience. If you are under one million daily completions, under ten logical models, and LLM-mediated experience is under 30% of revenue, you should not build your own gateway. LiteLLM Proxy, Portkey, or Kong AI Gateway will do the job. The operational cost of running a homegrown service exceeds the licensing cost of a hosted one until you cross those thresholds.

The judgment is whether your routing logic is going to be a competitive advantage. Most companies' routing logic is generic: tier-based, cost-aware, latency-aware. The patterns are well-known and a hosted gateway will implement them faster than you can. A small number of companies have routing logic that is genuinely proprietary: a legal-document AI that routes to a domain-specialised model trained on the customer's own corpus, a medical-imaging gateway that routes by anatomical region, a financial-services gateway that has to satisfy a regulator about which model touched which decision. If your routing is in that category, build. If it is not, buy.

The five categories of gateway available in mid-2026 sort cleanly:

Category Best for Watch out for
DIY (Go/Rust) >10M req/day, proprietary routing Operational cost, on-call burden
LiteLLM Proxy Mid-volume, want full control Self-hosted ops, smaller ecosystem
Portkey SaaS convenience, cost tracking Vendor lock for routing rules
Kong AI Gateway Existing Kong shop, plugin ecosystem Heavier than needed for LLM-only
OpenRouter Quick start, model variety Routing logic baked in their side

We started on LiteLLM Proxy in late 2024, outgrew it in mid-2025 when our routing rules got too specific to express in their config language, and migrated to a homegrown Go service over six engineering-weeks. The migration paid for itself in eleven months on the cost-aware-routing savings alone. Your numbers will differ.

Production Considerations Nobody Warned Us About

Three things have bitten us in production that did not show up in any of the build-your-own-gateway blog posts I read while we were planning the migration.

The first is provider rate-limit visibility. Every major provider exposes rate-limit headers on each response, and they are not standardised. Anthropic returns anthropic-ratelimit-tokens-remaining. OpenAI returns x-ratelimit-remaining-tokens. Mistral returns nothing useful. The gateway has to parse all of these into a normalised internal model so the routing engine can decide when an OpenAI tokens-per-minute budget is nearly exhausted and route the next request to Anthropic. Without this, you are flying blind on a quota you are about to exceed. We had a Sev-2 in March because the gateway was correctly routing to OpenAI but did not yet understand its own approaching quota, and the result was a tier of customers getting 429s for forty-five minutes until the next minute boundary reset the counter.

The second is streaming response handling. Every provider streams chunks slightly differently. OpenAI streams data: {...}\n\n SSE events with a data: [DONE] terminator. Anthropic streams event: ... data: ... with multiple event types. vLLM streams OpenAI-format SSE but sometimes omits the final usage block. Groq streams faster than your Go reader can parse if you are not careful with buffer sizes. The gateway has to terminate every stream cleanly even if the upstream's connection is killed mid-chunk, otherwise you leak goroutines. We leaked enough goroutines in the first month after migration to OOM the gateway twice before we built a strict per-stream context with a five-minute hard timeout.

The third is cost attribution at the request level. Every recorded request must carry enough metadata to answer tenant, feature, provider, model, token count, and dollar cost questions, and the dollar number must be correct to the third decimal place because finance reconciles it monthly against the actual provider invoices. Provider invoices are not friendly: they bill in batched aggregates with delays of up to seventy-two hours, and a batched aggregate's per-tenant breakdown is your problem to compute. We store per-request cost in ClickHouse with the formula version that produced it, so when a provider changes pricing mid-quarter we can re-cost historical requests for the audit trail. This sounds like overkill until your CFO asks why the November invoice does not match your dashboard.

Conclusion

A gateway is not a glamorous piece of infrastructure. It does not show up on a feature roadmap. The pull request that introduces it does not get celebratory Slack reactions. But eight months after we shipped ours, every single LLM-related Sev-1 we have had was either prevented entirely (the February Anthropic outage that on-call slept through) or scoped down to a single tier (the March OpenAI quota incident that affected 12% of traffic for forty-five minutes instead of 100% for several hours).

In our finance reconciliation, we measured cost-aware routing saving roughly $220,000 in twelve months. The semantic caching, where it is safe, has shaved another $35,000. The retry-budget pattern has prevented at least three retry-storm Sev-1s, each of which would have cost a long weekend to clean up. The recording sink has answered two angry-customer audits in under two minutes total. The combined operational cost of running the gateway is one engineer at 20% time, plus about $400/month in compute and storage.

If you are running an LLM-mediated product in production in 2026, you almost certainly need a gateway. The only real questions are whether you build it or buy it, and how much routing intelligence you push into it. Start with the four layers (ingress, routing, cache, adapter pool) and add intelligence as you measure what would actually pay for itself. The most expensive mistake is the one we made in 2024: pretending the SDK call site is a reasonable place to put production reliability logic for the most expensive network call in your system.

Working code for the routing-engine layer (Go), the cache-policy compiler (Python), and the provider adapters lives in the companion repo at github.com/amtocbot-droid/amtocbot-examples under llm-gateway-2026/.


Revision History

Date Summary Old Version
2026-06-08 Added explicit measurement attribution around gateway latency, routing savings, classifier, cache, failover, and annual savings claims; converted direct example quotes into indirect wording; updated revision metadata. View original

Sources

  1. Portkey: AI Gateway Architecture and Performance Benchmarks: production patterns for routing, caching, failover at scale
  2. LiteLLM Proxy Documentation: Multi-Provider Routing: open-source reference implementation of the four-layer pattern
  3. Kong AI Gateway: Plugin Architecture for LLM Workloads: how a mature API gateway extended for LLMs
  4. Anthropic API Reference: Rate Limit Headers and Error Codes: provider-side detail on the headers a gateway must parse
  5. AWS Builders Library: Timeouts, Retries, and Backoff with Jitter: the foundational reference on retry budgets and jitter that the gateway pattern inherits
  6. Netflix Tech Blog: Hystrix Circuit Breaker Patterns: the canonical reference for the breaker state machine the gateway uses

About the Author

Toc Am

Founder of AmtocSoft. Writing practical deep-dives on AI engineering, cloud architecture, and developer tooling. Previously built backend systems at scale. Reviews every post published under this byline.

LinkedIn X / Twitter

Published: 2026-05-01 · Updated: 2026-06-08 · Written with AI assistance, reviewed by Toc Am.

Get These In Your Inbox

Weekly deep-dives on AI engineering, no fluff. Join the newsletter →

Subscribe (free)

Or grab the book ($39, ~100 pages) · Buy me a coffee

Buy Me a Coffee · 🔔 YouTube · 💼 LinkedIn · 🐦 X/Twitter

Friday, April 17, 2026

Distributed Caching in 2026: Cache Invalidation, CDN Strategy, and Building a Cache That Doesn't Lie

Hero image

Introduction

Phil Karlton's famous quip — "There are only two hard problems in computer science: cache invalidation and naming things" — gets repeated at conferences, on t-shirts, and in job interviews. What rarely gets discussed is why cache invalidation is hard. The concept is not complex. You write new data, you remove or update the old cached version. That sentence takes three seconds to understand. So why does stale data cause production incidents at companies with hundreds of engineers?

The answer is timing. Cache invalidation is hard because the failures are invisible until the conditions align: a race between a write and a read, a cache miss storm that collapses your database under 40x normal load, a CDN serving a deleted product page to ten thousand users because no one called the purge API. These failure modes do not appear in development. They appear at 2 AM under load, when the cache hits 94% on most paths but a newly deployed schema breaks the other 6% in a way that corrupts user-visible data.

The cost calculation is asymmetric. A cache miss costs you latency — a round-trip to the database that might add 10-50ms to a response. A stale cache hit costs you correctness — a user sees a price that was updated six minutes ago, a balance that does not reflect their last transaction, a permission state that no longer applies. Latency is measurable and recoverable. Stale data erodes trust in ways that are harder to quantify.

In 2026, distributed caching has gotten more complex, not simpler. Multi-region deployments mean a write in us-east-1 has to invalidate cached data at CDN edge nodes in Frankfurt, Singapore, and São Paulo simultaneously. Serverless and edge compute mean your "in-process" cache has a lifetime of milliseconds. Read replicas, CQRS patterns, and event-sourced architectures introduce propagation delays between the write path and the read path that your cache has to account for.

This post covers the patterns that actually work at production scale: cache invalidation strategies with race-condition proofs, key design that prevents thundering herds, layered architectures that keep hit rates above 90%, CDN configuration that survives a content publish, and monitoring that tells you when your cache starts lying before your users notice.


1. Cache Invalidation Strategies

Six core patterns cover nearly every cache invalidation use case. The right choice depends on your consistency requirements, write volume, and whether your application can tolerate brief windows of stale data.

TTL-based expiry is the simplest approach: every cache entry has a time-to-live, after which it expires. No coordination required. The tradeoff is eventual consistency with a bounded staleness window. If your TTL is 60 seconds, you accept that reads in that window may return data up to 60 seconds old. This is the right default for content that changes slowly and where brief staleness is acceptable — product catalog data, user profile summaries, feature flag configs. It breaks down when writes are frequent or when correctness is load-bearing (financial balances, inventory counts, permissions).

Event-driven invalidation publishes an invalidation event on every write. A subscriber receives the event and deletes the cache key. This achieves near-real-time consistency without the write-through penalty, but it introduces a coordination dependency: if the invalidation subscriber is down or lagging, your cache serves stale data indefinitely. Redis keyspace notifications or a dedicated event bus (Kafka, Redis Streams) are common implementations.

Write-through writes to both the cache and the database in a single operation before returning to the caller. No stale reads are possible because the cache is always updated on write. The cost is higher write latency — every write pays the round-trip to both systems. This pattern makes sense when read performance is critical, write volume is moderate, and you cannot tolerate stale reads under any condition.

Write-behind (write-back) writes to the cache first and flushes to the database asynchronously. Write latency drops to a single cache round-trip, but you accept data loss on crash: if the cache node dies before the async flush completes, those writes are gone. This is the right pattern for high-throughput counters, rate limiters, and analytics events where some loss is acceptable. Never use it for financial transactions or any data where durability is required.

Cache-aside (lazy loading) is the most common pattern: on a cache miss, load from the database and populate the cache. Simple to implement, but it does not invalidate on write — you rely on TTL or explicit deletion to clear stale entries.

The double-delete pattern is what you reach for when event-driven invalidation and cache-aside combine and race conditions become a real risk. Without double-delete, a concurrent reader can populate the cache with stale data after your invalidation event fires. The sequence:

  1. Delete the cache key (first delete, before the write)
  2. Write to the database
  3. Delete the cache key again (second delete, after the write)

The first delete ensures any reader that is currently in-flight with stale data does not repopulate the cache after your write. The second delete clears any entry that a concurrent reader populated between the first delete and the database write completing. There is still a narrow window of staleness, but it is bounded to the time between the second delete and the next cache population — not indefinite.

Tag-based invalidation assigns cache entries to logical groups. When a product is updated, a single invalidation event clears all cache keys tagged with product:{id} — the product detail page, the search result snippets, the recommendation widget, the recently-viewed list. Tag-based invalidation is supported natively by Fastly (surrogate keys), Cloudflare (cache tags), and CloudFront (with origin-side logic). For Redis, you can implement it with a reverse index: a set keyed by tag containing all cache keys belonging to that tag.

Here is a complete implementation of event-driven invalidation with Redis keyspace notifications and write-through with cache-aside fallback:

import redis
import json
import hashlib
import time
from typing import Optional, Any, Callable
from dataclasses import dataclass

# Prevents stale repopulation after a write by using
# double-delete: delete before write, delete after write.
# Without this, a concurrent reader can populate the cache
# with the pre-write value between your delete and your DB write.

r = redis.Redis(host="localhost", port=6379, decode_responses=True)

def double_delete_write(
    key: str,
    db_write_fn: Callable,
    *args,
    delay_ms: int = 50,
    **kwargs
) -> Any:
    """
    Write-through with double-delete race condition protection.

    Failure mode prevented: without the pre-delete, a reader that
    loaded stale data before your write will repopulate the cache
    with the old value after you delete and re-write.
    """
    # First delete: prevents stale repopulation by in-flight readers
    r.delete(key)

    # Write to the database (source of truth)
    result = db_write_fn(*args, **kwargs)

    # Small delay: lets any concurrent readers that were between
    # the first delete and the DB write complete their round-trip
    # before we delete again. In practice 50ms is sufficient.
    time.sleep(delay_ms / 1000)

    # Second delete: clears anything a concurrent reader populated
    # in the window between first delete and DB write completing
    r.delete(key)

    return result


def cache_aside_read(
    key: str,
    db_read_fn: Callable,
    ttl: int = 300,
    *args,
    **kwargs
) -> Any:
    """
    Cache-aside (lazy loading) with automatic cache population on miss.

    Failure mode: if cache is empty (cold start or after invalidation),
    all concurrent readers hit the DB simultaneously (thundering herd).
    See Section 2 for stampede protection.
    """
    cached = r.get(key)
    if cached is not None:
        return json.loads(cached)

    # Cache miss: load from DB
    value = db_read_fn(*args, **kwargs)

    if value is not None:
        r.setex(key, ttl, json.dumps(value))

    return value


# Event-driven invalidation via Redis Streams
# Subscriber deletes cache keys when write events are published.
# Failure mode: if subscriber is lagging, cache serves stale data.
# Mitigate with maxlen on stream and consumer group with ACK.

def publish_invalidation_event(entity_type: str, entity_id: str):
    """Publish cache invalidation event to Redis Stream."""
    r.xadd(
        "cache:invalidation",
        {
            "entity_type": entity_type,
            "entity_id": entity_id,
            "timestamp": str(time.time()),
        },
        maxlen=10000,  # Prevent unbounded stream growth
    )


def invalidation_subscriber_loop():
    """
    Consumer group subscriber that deletes cache keys on write events.
    Run as a background worker process.
    """
    group = "cache-invalidators"
    stream = "cache:invalidation"

    # Create consumer group (idempotent)
    try:
        r.xgroup_create(stream, group, id="0", mkstream=True)
    except redis.exceptions.ResponseError:
        pass  # Group already exists

    consumer_name = f"worker-{int(time.time())}"

    while True:
        # Read up to 10 events, block 1s if stream is empty
        messages = r.xreadgroup(
            group, consumer_name, {stream: ">"}, count=10, block=1000
        )

        if not messages:
            continue

        for stream_name, entries in messages:
            for entry_id, fields in entries:
                entity_type = fields["entity_type"]
                entity_id = fields["entity_id"]

                # Delete all cache keys for this entity
                pattern = f"{entity_type}:*:{entity_id}:*"
                keys = r.scan_iter(pattern)
                pipe = r.pipeline()
                for key in keys:
                    pipe.delete(key)
                pipe.execute()

                # ACK the message — prevents reprocessing on restart
                r.xack(stream, group, entry_id)
Architecture diagram
sequenceDiagram participant W as Writer participant C as Cache participant DB as Database participant R as Reader rect rgb(255, 220, 220) Note over W,R: WITHOUT double-delete (race condition) R->>C: GET product:42 (miss) W->>C: DELETE product:42 W->>DB: UPDATE product SET price=99 R->>DB: SELECT * FROM product WHERE id=42 (gets OLD value) R->>C: SET product:42 = {price: 79} (stale!) Note over C: Cache now has pre-write value end rect rgb(220, 255, 220) Note over W,R: WITH double-delete (safe) W->>C: DELETE product:42 (1st delete) W->>DB: UPDATE product SET price=99 Note over W: wait 50ms for in-flight readers W->>C: DELETE product:42 (2nd delete) R->>C: GET product:42 (miss) R->>DB: SELECT * FROM product WHERE id=42 (gets NEW value) R->>C: SET product:42 = {price: 99} (fresh) end

2. Cache Key Design

A cache key is a contract. Change the underlying data schema without changing the key and your cache silently serves incorrect data until TTL expires. Design keys with explicit versioning and namespacing from the start — retrofitting key design in production requires a full cache flush.

Key naming convention: {service}:{entity}:{id}:{version}

  • service prevents collisions between microservices sharing a Redis cluster
  • entity is the data type: user, product, session, feed
  • id is the primary identifier for the specific record
  • version is the schema version of the serialized value

Example: catalog:product:8842:v3. When you deploy a schema change that adds a required field, bump to v4. All v3 keys become unreachable immediately on deploy — no stale deserialization errors, no migration script.

Per-user cache keys include the user ID for personalized data: feed:user:7731:v2. This prevents cross-user data leaks and allows per-user invalidation on account update.

The thundering herd problem is what happens when a popular cache key expires. Every instance in your fleet misses simultaneously, issues a database query simultaneously, and you absorb 50x normal database load in a two-second window while all those queries execute and all those instances race to repopulate the same key. At p99, one of those queries is slow. The others pile up. Your database connection pool exhausts. Your application starts returning 500s.

TTL jitter is the cheap fix: instead of a fixed TTL of 300 seconds, use 300 + random.randint(-30, 30). Keys that would have expired together now expire across a 60-second window, spreading the load across 60 database round-trips instead of one synchronized burst. This is standard practice in any system with more than a handful of cache clients.

XFetch (probabilistic early recomputation) is the correct fix for high-traffic keys where even jittered expiry produces unacceptable spikes. The algorithm probabilistically recomputes a cache entry before it expires, based on how expensive the recomputation is and how close the entry is to expiry. Keys with expensive recomputation (slow DB queries, aggregation jobs) are recomputed earlier; cheap keys are refreshed close to their natural expiry. Only one instance recomputes at a time — others continue serving the cached value until the fresh value is available.

import math
import random
import time
import json
from typing import Optional, Callable, Tuple

def build_cache_key(
    service: str,
    entity: str,
    entity_id: str | int,
    version: str = "v1",
    user_id: Optional[str | int] = None,
) -> str:
    """
    Namespaced, versioned cache key builder.

    Versioned keys prevent stale deserialization: bump version on
    schema change and old cached values auto-invalidate on next read.
    """
    parts = [service, entity, str(entity_id), version]
    if user_id is not None:
        parts.insert(3, f"u{user_id}")
    return ":".join(parts)


def ttl_with_jitter(base_ttl: int, jitter_pct: float = 0.1) -> int:
    """
    Add ±jitter_pct random variation to TTL.

    Failure mode prevented: without jitter, all instances that
    cached a popular key at the same time will miss simultaneously,
    creating a synchronized DB load spike (thundering herd).
    """
    jitter = int(base_ttl * jitter_pct)
    return base_ttl + random.randint(-jitter, jitter)


def xfetch_get(
    r: redis.Redis,
    key: str,
    recompute_fn: Callable,
    base_ttl: int,
    beta: float = 1.0,
) -> Any:
    """
    XFetch algorithm: probabilistic early recomputation.

    Prevents thundering herd on high-traffic keys by recomputing
    a single instance's cache early, while all other instances
    continue serving the cached value.

    beta > 1.0: recompute earlier (use for expensive recomputations)
    beta < 1.0: recompute later (use for cheap recomputations)

    Reference: Vattani et al., "Exact analysis of TTL cache networks"
    """
    raw = r.get(key)

    now = time.time()

    if raw is not None:
        data = json.loads(raw)
        ttl_remaining = r.ttl(key)
        delta = data.get("_delta", 1.0)  # Seconds taken to compute last time

        # XFetch decision: probabilistically recompute before expiry
        # Higher delta (expensive computation) → recompute earlier
        # Higher beta → recompute earlier
        should_recompute = (
            now - delta * beta * math.log(random.random())
        ) >= (now + ttl_remaining - base_ttl)

        if not should_recompute:
            return data["value"]

    # Recompute (either cache miss or early recomputation)
    start = time.time()
    value = recompute_fn()
    delta = time.time() - start

    ttl = ttl_with_jitter(base_ttl)
    r.setex(
        key,
        ttl,
        json.dumps({"value": value, "_delta": delta}),
    )

    return value
flowchart TD A[Popular cache key expires\nTTL = 300s, no jitter] --> B{All 50 app instances\nmiss simultaneously} B --> C[50 concurrent DB queries\nfor same row] C --> D[DB connection pool exhausted\nQuery queue backs up] D --> E[p99 query: 800ms\nInstances timeout waiting] E --> F[500 errors\nRetries compound load] style A fill:#ff9999 style F fill:#ff6666 G[Same key with TTL jitter\n300s ± 30s] --> H{Instances expire\nstaggered over 60s window} H --> I[~1 DB query per second\nInstead of 50 simultaneous] I --> J[DB load stays flat\nNo queue buildup] J --> K[p99 stays at 12ms\nNo incidents] style G fill:#99ff99 style K fill:#66cc66

3. Layered Caching Architecture

A single Redis cluster is not a caching architecture. At scale, you need multiple cache layers operating at different latencies and scopes, with explicit rules for consistency and promotion between layers.

L1: In-process cache lives inside your application process. Zero network round-trips — sub-microsecond lookups against an in-memory LRU or bounded hash map. The tradeoff is that L1 is per-instance and not shared: if you have 40 application instances, you have 40 independent L1 caches that can diverge from each other. L1 is appropriate for hot reference data that changes infrequently: config objects, feature flags, permission sets, lookup tables. Bounded size is mandatory — an unbounded L1 cache is a memory leak. Typical size: 1,000-10,000 entries.

L2: Redis cluster is the shared cache tier. Millisecond latency, consistent across all application instances, supports atomic operations. Redis Cluster provides horizontal scaling and fault tolerance. This is where the majority of your application's cache reads should be served from. Hit rate target: 85-95% for well-designed applications.

L3: CDN edge cache eliminates origin hits entirely for cacheable HTTP responses. Requests served from CDN edge nodes never reach your application servers — Cloudflare, Fastly, and CloudFront operate hundreds of Points of Presence globally, serving from the edge node closest to the user. Latency target: under 5ms for cache hits. A well-configured CDN can absorb 90%+ of read traffic for public content.

L4: Origin / database is the source of truth. Every request that reaches L4 represents a failure of the layers above it. Hit rates at L4 should be minimized — target under 5% of all read requests hitting the database for any high-traffic path.

Cache promotion ensures a miss at L1 but a hit at L2 repopulates L1 for subsequent requests. A miss at L2 but a hit at CDN is harder to leverage in server-side caching, but CDN hit data can inform cache warming strategies.

Consistency across layers is where complexity lives. When you invalidate a key in L2, your L1 caches across 40 instances still hold the old value. Options: L1 TTL short enough to self-heal quickly (10-30 seconds), explicit L1 invalidation via a pub/sub channel, or accepting brief L1 divergence for data where eventual consistency is acceptable. For permission and authentication data, accept no divergence: skip L1 entirely or use zero-TTL L1 entries that expire immediately.

import time
import json
from collections import OrderedDict
from typing import Optional, Any, Callable
import redis
import threading

class LRUCache:
    """Thread-safe LRU in-process cache with bounded size."""

    def __init__(self, max_size: int = 1000, default_ttl: int = 30):
        self._cache: OrderedDict = OrderedDict()
        self._max_size = max_size
        self._default_ttl = default_ttl
        self._lock = threading.Lock()

    def get(self, key: str) -> Optional[Any]:
        with self._lock:
            if key not in self._cache:
                return None
            value, expires_at = self._cache[key]
            if time.time() > expires_at:
                del self._cache[key]
                return None
            # Move to end (most recently used)
            self._cache.move_to_end(key)
            return value

    def set(self, key: str, value: Any, ttl: Optional[int] = None):
        with self._lock:
            ttl = ttl or self._default_ttl
            expires_at = time.time() + ttl
            if key in self._cache:
                self._cache.move_to_end(key)
            self._cache[key] = (value, expires_at)
            # Evict least recently used if over capacity
            if len(self._cache) > self._max_size:
                self._cache.popitem(last=False)

    def delete(self, key: str):
        with self._lock:
            self._cache.pop(key, None)


class MultiLayerCache:
    """
    L1 (in-process LRU) → L2 (Redis) → L4 (origin/DB) with
    automatic cache promotion on miss.

    Cache promotion: miss at L1 but hit at L2 repopulates L1
    so subsequent requests from this instance avoid the network.

    Coordinated invalidation: invalidation deletes from both
    L1 and L2 simultaneously. L1 divergence window = L1 TTL max.
    """

    def __init__(
        self,
        redis_client: redis.Redis,
        l1_max_size: int = 1000,
        l1_ttl: int = 30,      # Short: L1 divergence window
        l2_ttl: int = 300,     # Longer: shared cache lifetime
    ):
        self._l1 = LRUCache(max_size=l1_max_size, default_ttl=l1_ttl)
        self._l2 = redis_client
        self._l1_ttl = l1_ttl
        self._l2_ttl = l2_ttl

    def get(
        self,
        key: str,
        origin_fn: Optional[Callable] = None,
    ) -> Optional[Any]:
        # L1 check: zero-latency in-process lookup
        value = self._l1.get(key)
        if value is not None:
            return value

        # L2 check: Redis round-trip (~1ms)
        raw = self._l2.get(key)
        if raw is not None:
            value = json.loads(raw)
            # Cache promotion: populate L1 for subsequent requests
            self._l1.set(key, value, ttl=self._l1_ttl)
            return value

        # L4 miss: load from origin/database
        if origin_fn is None:
            return None

        value = origin_fn()
        if value is not None:
            self._populate(key, value)

        return value

    def _populate(self, key: str, value: Any):
        """Populate both L1 and L2."""
        ttl = ttl_with_jitter(self._l2_ttl)
        self._l2.setex(key, ttl, json.dumps(value))
        self._l1.set(key, value, ttl=self._l1_ttl)

    def invalidate(self, key: str):
        """
        Coordinated invalidation: delete from L1 and L2 simultaneously.

        Failure mode: if you only delete from L2, this instance's L1
        continues serving stale data for up to l1_ttl seconds.
        """
        self._l1.delete(key)
        self._l2.delete(key)

    def invalidate_pattern(self, pattern: str):
        """Invalidate all keys matching a Redis glob pattern."""
        # L2 pattern delete
        keys = list(self._l2.scan_iter(pattern))
        if keys:
            self._l2.delete(*keys)
        # L1: cannot pattern-match, rely on TTL expiry
        # For strict L1 invalidation, maintain a reverse index
Comparison visual
flowchart LR U([User Request]) --> L1 subgraph Application Instance L1[L1: In-Process LRU\nSub-microsecond\n1K-10K entries\nTTL: 30s] end L1 -->|miss| L2 L1 -->|hit| R1([Response]) subgraph Shared Cache L2[L2: Redis Cluster\n~1ms latency\nShared across instances\nTTL: 300s] end L2 -->|promote to L1| L1 L2 -->|hit| R2([Response]) L2 -->|miss| L3 subgraph CDN Edge L3[L3: CDN PoP\nCloudflare / Fastly / CloudFront\nunder 5ms global\nHTTP Cache-Control] end L3 -->|hit| R3([Response]) L3 -->|miss| L4 subgraph Origin L4[(L4: Database\nSource of Truth\nTarget under 5% of reads)] end L4 -->|populate L2, L1| L2 L4 --> R4([Response])

4. CDN Caching Strategy

CDN caching is controlled entirely by HTTP response headers. If you do not explicitly set Cache-Control, your CDN will either cache nothing or cache everything with its default TTL — neither is what you want.

Cache-Control directives that matter in production:

  • max-age=N: client-side TTL in seconds
  • s-maxage=N: CDN-side TTL (overrides max-age for shared caches); use this to set different cache lifetimes for browsers vs CDN
  • stale-while-revalidate=N: serve stale content for N seconds while fetching a fresh version in the background. This is the single most impactful directive for perceived latency — a user never waits for a cache refresh
  • stale-if-error=N: serve stale content for N seconds if the origin returns a 5xx error. This is your CDN-level circuit breaker for origin outages
  • no-store: do not cache under any conditions (authentication pages, payment flows)
  • private: cacheable by browsers but not CDNs

Surrogate keys (cache tags) let you purge all CDN-cached responses related to a piece of content with a single API call. When you update a product, you purge product-8842 and every CDN edge node globally drops all responses tagged with that key — product detail pages, search result snippets, recommendation widgets — regardless of their remaining TTL. Cloudflare calls these Cache Tags. Fastly calls them Surrogate-Keys. CloudFront requires implementing the equivalent with a custom header and Lambda@Edge.

The Vary header instructs the CDN to cache separate response copies for different request header values. Vary: Accept-Encoding is standard (gzip vs brotli). Vary: Accept-Language creates per-language cache buckets. Avoid Vary: Cookie or Vary: Authorization — these make the vast majority of responses uncacheable at the CDN since nearly every authenticated user sends a unique cookie.

CDN origin shield (called Origin Shield in CloudFront, Shielding in Fastly, Tiered Cache in Cloudflare) collapses all edge cache misses through a single intermediate node before reaching your origin. Without origin shield, a cold cache across 250 edge nodes means 250 simultaneous origin requests for the same content. With origin shield, those 250 edge nodes coalesce into one origin request. Required for any CDN purge event — the moment you invalidate a popular content tag, origin shield prevents the invalidation from becoming a traffic spike.

from fastapi import FastAPI, Request, Response
from fastapi.responses import JSONResponse
import httpx
import hashlib
import json
import time
from typing import Optional
import redis

app = FastAPI()
r = redis.Redis(host="localhost", port=6379, decode_responses=True)

CLOUDFLARE_ZONE_ID = "your-zone-id"
CLOUDFLARE_API_TOKEN = "your-api-token"


def set_cache_headers(
    response: Response,
    max_age: int = 60,
    s_maxage: int = 300,
    stale_while_revalidate: int = 60,
    stale_if_error: int = 86400,
    cache_tags: Optional[list[str]] = None,
):
    """
    Set Cache-Control and CDN cache tag headers.

    s_maxage > max_age: CDN holds content longer than browsers,
    preventing origin requests while allowing browser refresh.

    stale-while-revalidate: users never wait for cache refresh,
    background revalidation happens asynchronously.

    stale-if-error: CDN serves stale content during origin outages
    — your circuit breaker at the edge.
    """
    directives = [
        f"public",
        f"max-age={max_age}",
        f"s-maxage={s_maxage}",
        f"stale-while-revalidate={stale_while_revalidate}",
        f"stale-if-error={stale_if_error}",
    ]
    response.headers["Cache-Control"] = ", ".join(directives)

    if cache_tags:
        # Cloudflare: Cache-Tag header (comma-separated)
        response.headers["Cache-Tag"] = ",".join(cache_tags)
        # Fastly: Surrogate-Key header (space-separated)
        response.headers["Surrogate-Key"] = " ".join(cache_tags)


@app.get("/api/products/{product_id}")
async def get_product(product_id: int, response: Response):
    """
    Product endpoint with multi-layer caching and CDN cache tags.
    Cache tags enable targeted purge on product update without
    flushing the entire CDN cache.
    """
    cache_key = build_cache_key("catalog", "product", product_id, "v2")

    # Try Redis first
    cached = r.get(cache_key)
    if cached:
        product = json.loads(cached)
    else:
        # Load from DB (simulated)
        product = {"id": product_id, "name": "Widget", "price": 99.99}
        r.setex(cache_key, ttl_with_jitter(300), json.dumps(product))

    set_cache_headers(
        response,
        max_age=60,
        s_maxage=300,
        stale_while_revalidate=60,
        stale_if_error=86400,
        cache_tags=[f"product-{product_id}", "products"],
    )

    return product


async def purge_cloudflare_cache_tags(tags: list[str]):
    """
    Programmatic CDN purge via Cloudflare API on content update.

    Call this after every product write so CDN-cached pages
    immediately reflect the new state. Without purge, users see
    stale CDN responses for up to s_maxage seconds.
    """
    async with httpx.AsyncClient() as client:
        resp = await client.post(
            f"https://api.cloudflare.com/client/v4/zones/{CLOUDFLARE_ZONE_ID}/purge_cache",
            headers={
                "Authorization": f"Bearer {CLOUDFLARE_API_TOKEN}",
                "Content-Type": "application/json",
            },
            json={"tags": tags},
        )
        resp.raise_for_status()
        return resp.json()


@app.put("/api/products/{product_id}")
async def update_product(product_id: int, data: dict):
    """
    Write path: update DB, invalidate Redis, purge CDN.
    Three-layer invalidation: Redis (immediate) + CDN (programmatic purge).
    """
    # DB write (simulated)
    # await db.execute("UPDATE products SET ... WHERE id = ?", ...)

    # Redis invalidation with double-delete
    cache_key = build_cache_key("catalog", "product", product_id, "v2")
    double_delete_write(
        cache_key,
        lambda: None,  # DB write already done above
    )

    # CDN purge: clears all edge-cached responses tagged with this product
    await purge_cloudflare_cache_tags([
        f"product-{product_id}",
    ])

    return {"status": "updated", "id": product_id}

5. Distributed Cache Patterns for Correctness

Performance is the headline, but correctness is the real requirement. A cache that serves wrong data is worse than no cache.

Read-your-writes consistency is the failure mode that frustrates users most visibly. A user posts a comment. The write succeeds. They reload their feed. The comment is not there — it is in the database, but the cached feed snapshot has not been refreshed yet. From the user's perspective, their action had no effect.

The solution is a short-circuit bypass: after a write, mark the user's session as "recently wrote" with a very short TTL (5-10 seconds). On subsequent reads within that window, bypass the cache and read directly from the database primary. After the window closes, resume normal cache-served reads. This adds negligible overhead — the bypass window is short, and most users are not writing continuously.

Negative caching prevents database hammering on missing keys. Without it, every request for a non-existent user ID (common in scraping, enumeration attempts, and cache stampedes after a delete) hits the database. Cache a sentinel value for not-found results with a short TTL (30-60 seconds). The cache returns the sentinel, your application interprets it as a miss, and the database is protected.

import hashlib
import time
from typing import Optional, Any, Callable
import redis
import json

r = redis.Redis(host="localhost", port=6379, decode_responses=True)

NEGATIVE_SENTINEL = "__NOT_FOUND__"
NEGATIVE_TTL = 60  # Cache not-found for 60s; prevents DB hammering


def cache_with_negative(
    key: str,
    db_read_fn: Callable,
    positive_ttl: int = 300,
) -> Optional[Any]:
    """
    Cache-aside with negative caching.

    Failure mode prevented: without negative caching, every request
    for a deleted or non-existent record hits the database.
    Common in scraping attacks and after delete operations.
    """
    cached = r.get(key)

    if cached == NEGATIVE_SENTINEL:
        return None  # Known not-found, skip DB entirely

    if cached is not None:
        return json.loads(cached)

    value = db_read_fn()

    if value is None:
        # Cache the not-found result with short TTL
        r.setex(key, NEGATIVE_TTL, NEGATIVE_SENTINEL)
        return None

    r.setex(key, ttl_with_jitter(positive_ttl), json.dumps(value))
    return value


def generate_etag(content: Any) -> str:
    """Generate ETag from content hash for conditional GET."""
    content_bytes = json.dumps(content, sort_keys=True).encode()
    return hashlib.sha256(content_bytes).hexdigest()[:16]


from fastapi import FastAPI, Request, Response
from fastapi.responses import JSONResponse

app = FastAPI()


@app.get("/api/articles/{article_id}")
async def get_article(article_id: int, request: Request, response: Response):
    """
    Conditional GET with ETag and 304 Not Modified.

    Reduces bandwidth: client caches response + ETag, sends
    If-None-Match on subsequent requests. Server returns 304
    if content unchanged — no body transmitted.

    Combine with Redis: ETag stored alongside content,
    check ETag before serializing full response body.
    """
    cache_key = build_cache_key("content", "article", article_id, "v1")
    etag_key = f"{cache_key}:etag"

    # Load content (from cache or DB)
    content = cache_aside_read(
        cache_key,
        lambda: {"id": article_id, "title": "Article", "body": "..."},
    )

    if content is None:
        return JSONResponse({"error": "Not found"}, status_code=404)

    current_etag = r.get(etag_key)
    if current_etag is None:
        current_etag = generate_etag(content)
        r.setex(etag_key, 300, current_etag)

    # Check If-None-Match: return 304 if client has current version
    client_etag = request.headers.get("if-none-match")
    if client_etag and client_etag == f'"{current_etag}"':
        return Response(status_code=304)

    response.headers["ETag"] = f'"{current_etag}"'
    response.headers["Cache-Control"] = "public, max-age=60, s-maxage=300"

    return content


def sticky_read_bypass(
    user_id: str,
    cache_key: str,
    db_read_fn: Callable,
    bypass_ttl: int = 10,
    cache_ttl: int = 300,
) -> Any:
    """
    Read-your-writes: bypass cache for users who recently wrote.

    Failure mode prevented: user writes data, immediately reads
    their feed/profile, cache returns pre-write state — user
    thinks their write was lost.
    """
    bypass_key = f"bypass:{user_id}"

    if r.exists(bypass_key):
        # User recently wrote — read from DB primary directly
        return db_read_fn()

    return cache_aside_read(cache_key, db_read_fn, ttl=cache_ttl)


def mark_user_wrote(user_id: str, bypass_ttl: int = 10):
    """
    Call after any write by user_id to activate bypass window.
    Expires automatically after bypass_ttl seconds.
    """
    r.setex(f"bypass:{user_id}", bypass_ttl, "1")

6. Monitoring and Debugging Cache Behavior

A cache you cannot observe is a cache you cannot trust. Hit rate drops before incidents — instrument early.

Redis INFO stats provide cluster-wide metrics: keyspace_hits, keyspace_misses, evicted_keys, expired_keys, used_memory, connected_clients. Calculate hit rate as hits / (hits + misses). Target: above 85% for general application caches, above 95% for high-traffic public APIs. A hit rate drop from 92% to 78% on a Tuesday afternoon is a signal, not noise — investigate what changed.

Eviction monitoring tells you when your cache is under memory pressure. When Redis reaches maxmemory, it applies its eviction policy (allkeys-lru, volatile-lru, allkeys-random, etc.). Evictions are visible in evicted_keys from INFO. If eviction rate is non-zero, your cache is too small for your working set — either increase memory, reduce key sizes, or lower TTLs on lower-priority keys. allkeys-lru is the right policy for most application caches: evict the least recently used key regardless of TTL.

Key-level inspection:
- TTL key returns remaining TTL in seconds (-1 = no expiry, -2 = key does not exist)
- DEBUG OBJECT key returns serialized length, encoding, and LRU idle time
- OBJECT ENCODING key shows memory encoding: ziplist/listpack for small hashes (compact), hashtable for large ones (more memory)
- OBJECT FREQ key (requires maxmemory-policy lfu) shows access frequency

Latency percentiles are the most actionable metric for cache health. Measure p50, p95, and p99 for cache reads (Redis round-trip) vs database reads. Target: Redis p99 under 5ms, database p99 under 50ms for indexed reads. A Redis p99 spike to 50ms is usually a network issue or a large key serialization bottleneck.

Cache poisoning detection: if your application deserializes cached values without validation, a compromised Redis node or a serialization bug can inject malformed data. Store a checksum alongside the cached value and verify on read. Discard and reload from DB on checksum mismatch — this converts a poisoning event into a cache miss rather than a corrupted read.

Alerting thresholds to configure:
- Hit rate < 80%: alert immediately, investigate DB load
- Eviction rate > 100 keys/sec: investigate memory pressure
- Redis p99 latency > 10ms: investigate network or large key sizes
- keyspace_misses spike: correlate with deployment events (schema version change causes full miss)
- connected_clients near maxclients (default 10,000): connection leak or pool misconfiguration

import redis
import time
from typing import Dict

r = redis.Redis(host="localhost", port=6379, decode_responses=True)


def get_cache_stats() -> Dict:
    """
    Pull key cache health metrics from Redis INFO.
    Returns hit_rate, eviction_rate, memory_usage_pct.
    """
    info = r.info()
    stats = r.info("stats")
    memory = r.info("memory")

    hits = stats.get("keyspace_hits", 0)
    misses = stats.get("keyspace_misses", 0)
    total = hits + misses

    hit_rate = (hits / total * 100) if total > 0 else 0

    used_memory = memory.get("used_memory", 0)
    max_memory = memory.get("maxmemory", 0)
    memory_pct = (used_memory / max_memory * 100) if max_memory > 0 else 0

    return {
        "hit_rate_pct": round(hit_rate, 2),
        "keyspace_hits": hits,
        "keyspace_misses": misses,
        "evicted_keys": stats.get("evicted_keys", 0),
        "expired_keys": stats.get("expired_keys", 0),
        "used_memory_mb": round(used_memory / 1024 / 1024, 1),
        "memory_usage_pct": round(memory_pct, 2),
        "connected_clients": info.get("connected_clients", 0),
    }


def inspect_key(key: str) -> Dict:
    """
    Inspect a specific cache key for TTL, encoding, and memory usage.
    Use DEBUG OBJECT to identify large keys that inflate memory or
    increase serialization latency.
    """
    ttl = r.ttl(key)
    encoding = r.object_encoding(key)

    try:
        debug_obj = r.debug_object(key)
    except Exception:
        debug_obj = {}

    return {
        "key": key,
        "ttl_seconds": ttl,
        "encoding": encoding,
        "serialized_length_bytes": debug_obj.get("serializedlength"),
        "lru_idle_seconds": debug_obj.get("lru_seconds_idle"),
    }


def check_cache_health(hit_rate_threshold: float = 80.0) -> Dict:
    """
    Health check function for monitoring integration (Datadog, Prometheus).
    Returns status=WARN or CRITICAL with actionable diagnostics.
    """
    stats = get_cache_stats()
    warnings = []

    if stats["hit_rate_pct"] < hit_rate_threshold:
        warnings.append(
            f"Hit rate {stats['hit_rate_pct']}% below threshold "
            f"{hit_rate_threshold}% — check DB load"
        )

    if stats["memory_usage_pct"] > 85:
        warnings.append(
            f"Memory at {stats['memory_usage_pct']}% — "
            f"increase maxmemory or audit key sizes"
        )

    status = "OK" if not warnings else "WARN"

    return {"status": status, "stats": stats, "warnings": warnings}

Conclusion

Cache invalidation is a consistency problem that presents as a performance problem. When your cache is lying — serving stale prices, outdated permissions, deleted content — the debugging path is long because the symptoms (wrong data, user complaints) look nothing like the cause (a race condition between a write and a read that occurs in a 50-millisecond window at peak traffic).

The patterns in this post map to specific failure modes. Double-delete prevents stale repopulation from concurrent readers. TTL jitter and XFetch prevent thundering herds on key expiry. Layered caching with cache promotion keeps hit rates above 90% while containing the footprint of any single layer's inconsistency. CDN cache tags with programmatic purge prevent content updates from being invisible at the edge for minutes or hours. Negative caching stops database hammering from non-existent key lookups. Read-your-writes bypass prevents users from losing confidence in your application's responsiveness.

The production numbers that matter: hit rate above 85% for Redis (above 95% for high-traffic public APIs), Redis p99 under 5ms, CDN serving 80%+ of public read traffic, database receiving under 5% of total reads. If your numbers are below these targets, the gap is almost always one of the patterns above — not hardware or infrastructure.

Start with correct key design, add TTL jitter from day one, implement double-delete on any write path that has concurrent readers, and instrument hit rate before you need to debug it. The cache that does not lie is not one that never has misses — it is one where every miss is intentional and every hit is fresh.


Sources

About the Author

Toc Am

Founder of AmtocSoft. Writing practical deep-dives on AI engineering, cloud architecture, and developer tooling. Previously built backend systems at scale. Reviews every post published under this byline.

LinkedIn X / Twitter

Published: 2026-06-18 · Updated: 2026-04-18 · Written with AI assistance, reviewed by Toc Am.

Get These In Your Inbox

Weekly deep-dives on AI engineering, no fluff. Join the newsletter →

Subscribe (free)

Or grab the book ($39, ~100 pages) · Buy me a coffee

Buy Me a Coffee · 🔔 YouTube · 💼 LinkedIn · 🐦 X/Twitter

Redis Advanced Patterns in 2026: Streams, Pub/Sub, Lua Scripts, and Vector Search

Hero image

Introduction

Redis ships with a reputation it only partially deserves. Most teams use it as a dumb key-value store — SET key value EX 300, GET key, done. That pattern is useful, but it barely scratches what Redis can do. The same process that holds your session tokens also gives you a persistent, consumer-group-aware message log, a pub/sub broadcast bus, an atomic scripting engine, and — with Redis Stack — a vector database capable of sub-millisecond approximate nearest neighbor search across millions of embeddings.

The version most production systems are running today — Redis 7.x and Redis Stack 2.x — is a fundamentally different beast than the Redis from five years ago. Streams, introduced in Redis 5.0, are now mature enough to replace Kafka for the majority of workloads that don't need multi-day retention or petabyte-scale throughput. RediSearch's vector search, available in Redis Stack, has gone from an experiment to a serious alternative to Pinecone and Weaviate for teams that want to avoid managing a separate vector store. Lua scripting has always been there, but most developers still reach for MULTI/EXEC pipelines when a well-written Lua script would eliminate race conditions entirely.

This post covers the patterns that graduate Redis from "fast cache" to "production workhorse": advanced caching with stampede prevention, Streams for durable event processing with consumer groups and dead-letter queues, Pub/Sub for real-time fan-out, Lua scripts for atomic compound operations, vector search for semantic similarity workloads, and Cluster mode for high availability at scale. Every code example is complete and production-ready. Where Redis competes with specialized tools — Kafka, RabbitMQ, Pinecone — the tradeoffs are explicit.


1. Advanced Caching Patterns

The SET key value EX ttl pattern handles maybe 60 percent of caching use cases. The remaining 40 percent — write-through, write-behind, stampede prevention, layered caches, per-datatype TTL strategies — is where caching actually gets interesting and where naive implementations silently degrade under load.

Cache Strategies

Cache-aside (lazy loading) is the most common pattern: the application checks the cache on read, populates it on miss. Simple to reason about, easy to implement, but it means the first request after a cache miss hits the database. Under traffic spikes, dozens or hundreds of requests can all miss simultaneously on the same key and all hit the database in parallel — this is a cache stampede.

Write-through updates the cache synchronously on every write. Cache and database are always in sync. The cost: every write pays the penalty of two writes (cache + DB), and you cache data that may never be read.

Write-behind (write-back) writes to the cache first and flushes to the database asynchronously. Dramatically reduces write latency, but risks data loss if Redis restarts before the flush. Appropriate for metrics accumulation or click counters; inappropriate for financial records.

XFetch: Probabilistic Early Expiration

Cache stampede is a deceptively hard problem. The naive fix — a distributed lock that forces only one caller to recompute while others wait — adds latency and creates its own contention. The XFetch algorithm from Vattani, Chierichetti, and Lowenstein (2015) solves this without locks: it probabilistically recomputes the cache early, before expiration, based on how expensive the recomputation is and how close the TTL is.

The probability of early recomputation grows as the key approaches expiration. Expensive recomputations (high beta) trigger early refresh sooner. The result: the cache is refreshed in the background before it expires, and stampedes never happen.

# cache_xfetch.py
import redis
import time
import math
import random
import json
from typing import Callable, Any, Optional

r = redis.Redis(host="localhost", port=6379, decode_responses=True)

def xfetch(
    key: str,
    ttl: int,
    recompute: Callable[[], Any],
    beta: float = 1.0,
) -> Any:
    """
    XFetch: probabilistic early expiration to prevent cache stampedes.

    Args:
        key:        Redis key to cache under
        ttl:        Desired TTL in seconds
        recompute:  Callable that fetches the canonical value (DB query, API call, etc.)
        beta:       Recomputation cost factor. Higher = recompute sooner.
                    1.0 is a sensible default. Set higher for expensive recomputations.

    Returns:
        Cached or freshly computed value.
    """
    # Fetch current cached value and its remaining TTL atomically
    pipe = r.pipeline(transaction=False)
    pipe.get(key)
    pipe.ttl(key)
    cached_raw, remaining_ttl = pipe.execute()

    if cached_raw is not None:
        cached = json.loads(cached_raw)
        expiry = time.time() + remaining_ttl  # absolute expiry time

        # XFetch early-expiration check:
        # Recompute early with probability proportional to how close we are to expiry
        # and how expensive the recomputation is (delta * beta).
        delta = ttl - remaining_ttl  # time elapsed since last refresh
        if delta <= 0:
            delta = 1  # guard against zero/negative delta on fresh keys

        # The longer a recomputation takes (larger delta) and the closer
        # the key is to expiry, the more likely we are to refresh now.
        jitter = -beta * delta * math.log(random.random())
        if time.time() + jitter >= expiry:
            # Probabilistically decided to refresh early — recompute and cache
            value = recompute()
            r.set(key, json.dumps(value), ex=ttl)
            return value

        return cached

    # Cache miss: recompute and cache
    value = recompute()
    r.set(key, json.dumps(value), ex=ttl)
    return value


# --- Layered cache: L1 (local dict) → L2 (Redis) → L3 (database) ---

import functools
from collections import OrderedDict

class LRUCache:
    """Minimal in-process LRU cache for L1 layer."""
    def __init__(self, maxsize: int = 512):
        self.cache: OrderedDict = OrderedDict()
        self.maxsize = maxsize

    def get(self, key: str) -> Optional[Any]:
        if key in self.cache:
            self.cache.move_to_end(key)
            return self.cache[key]
        return None

    def set(self, key: str, value: Any) -> None:
        if key in self.cache:
            self.cache.move_to_end(key)
        self.cache[key] = value
        if len(self.cache) > self.maxsize:
            self.cache.popitem(last=False)

l1 = LRUCache(maxsize=512)

def get_with_layered_cache(
    key: str,
    db_fetch: Callable[[], Any],
    l2_ttl: int = 300,
) -> Any:
    """
    Three-layer cache lookup:
      L1 → in-process LRU dict (microseconds)
      L2 → Redis (sub-millisecond)
      L3 → database (milliseconds to seconds)
    """
    # L1 check
    value = l1.get(key)
    if value is not None:
        return value

    # L2 check (Redis), with stampede protection
    value = xfetch(key, ttl=l2_ttl, recompute=db_fetch)

    # Populate L1
    l1.set(key, value)
    return value

TTL Strategies by Data Volatility

TTL is not one-size-fits-all. A sensible tiering:

Data type TTL Rationale
User session 30 minutes (sliding) Active sessions stay warm; idle sessions expire
Product catalog 10 minutes Changes rarely; stale for a few minutes is acceptable
User profile 5 minutes Changes infrequently; short TTL keeps data fresh
Real-time prices 5 seconds Data staleness is a business risk
Feature flags 60 seconds Need to propagate quickly after changes
Computed aggregates 30 minutes Expensive to recompute; tolerate some staleness
Architecture diagram
flowchart LR A[Request] --> B{L1 Cache\nlocal dict} B -- Hit --> Z[Return value] B -- Miss --> C{L2 Cache\nRedis} C -- Hit --> D[Populate L1] D --> Z C -- Miss --> E[L3: Database] E --> F[Populate L2\nXFetch TTL] F --> D

2. Redis Streams for Event Processing

Redis Streams, stable since Redis 5.0 and hardened through 7.x, is a persistent, append-only log with consumer group semantics. It is not a replacement for Kafka at petabyte scale or with multi-day retention requirements. It is a serious replacement for Kafka in the 95 percent of systems where throughput stays under 1 million events per day, retention is hours-to-days rather than weeks-to-months, and the operational cost of running a Kafka cluster (Zookeeper or KRaft, broker replication, topic management, consumer group lag monitoring) is not justified.

A single Redis node benchmarks at over 1 million XADD operations per second. With consumer groups, you get competing consumers, at-least-once delivery semantics, and a built-in pending entries list (PEL) that tracks unacknowledged messages. This is Kafka-lite without the JVM.

Core Commands

  • XADD stream * field value [field value ...] — append entry, auto-generate ID
  • XREAD COUNT n STREAMS stream 0 — read from beginning
  • XREADGROUP GROUP grp consumer COUNT n STREAMS stream > — read undelivered messages to this group
  • XACK stream grp id — acknowledge processing complete
  • XPENDING stream grp - + n — list unacknowledged messages
  • XCLAIM stream grp consumer min-idle-ms id — reassign a stale pending message

Full Producer + Consumer Group with DLQ

// streams-consumer.js — Node.js (ioredis)
import Redis from "ioredis";

const redis = new Redis({ host: "localhost", port: 6379 });
const STREAM = "events:orders";
const GROUP = "order-processor";
const DLQ_STREAM = "events:orders:dlq";
const MAX_RETRIES = 3;
const CLAIM_IDLE_MS = 30_000; // reclaim messages idle > 30s

// --- Setup ---
async function ensureConsumerGroup() {
  try {
    // MKSTREAM creates the stream if it doesn't exist
    await redis.xgroup("CREATE", STREAM, GROUP, "$", "MKSTREAM");
    console.log(`Consumer group '${GROUP}' created`);
  } catch (err) {
    if (!err.message.includes("BUSYGROUP")) throw err;
    // Group already exists — fine
  }
}

// --- Producer ---
async function produce(order) {
  const id = await redis.xadd(
    STREAM,
    "*",                      // auto-generate ID (timestamp-based)
    "order_id", order.id,
    "customer", order.customer,
    "amount", String(order.amount),
    "payload", JSON.stringify(order),
  );
  console.log(`Produced message ${id}`);
  return id;
}

// --- Process one message ---
async function processMessage(id, fields) {
  // fields comes back as flat array: [key, val, key, val, ...]
  const data = {};
  for (let i = 0; i < fields.length; i += 2) {
    data[fields[i]] = fields[i + 1];
  }

  console.log(`Processing order ${data.order_id} for ${data.customer}`);

  // Simulate processing (replace with real business logic)
  if (Math.random() < 0.1) {
    throw new Error(`Simulated failure for order ${data.order_id}`);
  }

  console.log(`Order ${data.order_id} processed successfully`);
}

// --- Move to DLQ ---
async function sendToDLQ(id, fields, reason) {
  await redis.xadd(
    DLQ_STREAM,
    "*",
    "original_id", id,
    "reason", reason,
    "failed_at", String(Date.now()),
    ...fields,
  );
  console.warn(`Message ${id} sent to DLQ: ${reason}`);
}

// --- Consumer loop ---
async function runConsumer(consumerName) {
  await ensureConsumerGroup();

  console.log(`Consumer '${consumerName}' starting`);

  while (true) {
    // 1. Check for stale pending messages (unacked for > CLAIM_IDLE_MS)
    const pending = await redis.xpending(
      STREAM, GROUP, "-", "+", 10
    );

    for (const entry of pending) {
      const [msgId, owner, idleMs, deliveryCount] = entry;

      if (idleMs > CLAIM_IDLE_MS) {
        if (deliveryCount >= MAX_RETRIES) {
          // Exceeded retry limit → DLQ
          const claimed = await redis.xclaim(
            STREAM, GROUP, consumerName, CLAIM_IDLE_MS, msgId
          );
          if (claimed.length > 0) {
            const [claimedId, claimedFields] = claimed[0];
            await sendToDLQ(claimedId, claimedFields, `Max retries (${MAX_RETRIES}) exceeded`);
            await redis.xack(STREAM, GROUP, claimedId);
          }
        } else {
          // Reclaim and retry
          await redis.xclaim(STREAM, GROUP, consumerName, CLAIM_IDLE_MS, msgId);
          console.log(`Reclaimed stale message ${msgId} (attempt ${deliveryCount + 1})`);
        }
      }
    }

    // 2. Read new messages (> means "only undelivered to this group")
    const results = await redis.xreadgroup(
      "GROUP", GROUP,
      consumerName,
      "COUNT", "10",
      "BLOCK", "2000",   // block up to 2 seconds waiting for new messages
      "STREAMS", STREAM,
      ">",
    );

    if (!results) continue; // timeout with no messages — loop back

    for (const [_stream, messages] of results) {
      for (const [id, fields] of messages) {
        try {
          await processMessage(id, fields);
          await redis.xack(STREAM, GROUP, id); // ack only on success
        } catch (err) {
          // Don't ack — leave in PEL for retry via XCLAIM loop above
          console.error(`Failed to process ${id}: ${err.message}`);
        }
      }
    }
  }
}

// --- Entry point ---
const consumerName = process.argv[2] || "consumer-1";
runConsumer(consumerName).catch(console.error);
flowchart TD P[Producer] -->|XADD| S[(Redis Stream)] S -->|XREADGROUP| CG[Consumer Group] CG --> W1[Worker 1] CG --> W2[Worker 2] CG --> W3[Worker 3] W1 -->|Success: XACK| S W2 -->|Failure: stays in PEL| PE[Pending Entries List] PE -->|idle > 30s: XCLAIM| W3 W3 -->|retries > 3: XADD| DLQ[(Dead Letter Queue)] DLQ --> MON[DLQ Monitor / Alerting]

Redis Streams vs Kafka: When to Choose Which

Factor Redis Streams Kafka
Throughput 1M+ msg/s single node 10M+ msg/s multi-broker
Retention Hours to days (memory-backed) Weeks to months (disk)
Operational cost Zero — already running Redis Significant (brokers, ZK/KRaft)
Consumer groups Yes Yes
Replay Yes (XRANGE from any ID) Yes
Schema registry No Confluent Schema Registry
Exactly-once No (at-least-once) Yes (with transactions)

Choose Redis Streams when: throughput is under 1M events/day, retention under 48 hours, you already run Redis, and exactly-once semantics are not required. Choose Kafka when: throughput exceeds what a single Redis node handles, you need multi-week retention, or exactly-once delivery is a hard requirement.


3. Pub/Sub and Real-Time Patterns

Redis Pub/Sub and Redis Streams are complements, not alternatives. The key distinction: Pub/Sub is fire-and-forget — messages published to a channel are delivered only to subscribers active at that moment and are not persisted. Streams are persistent logs. A subscriber that goes offline for five seconds during a Streams workload misses nothing; a subscriber that goes offline for five seconds during a Pub/Sub workload misses everything published in that window.

Use Pub/Sub for: live notifications, presence indicators, real-time dashboards, and any pattern where a momentary gap is acceptable. Use Streams for: anything requiring guaranteed delivery or replay.

SUBSCRIBE, PUBLISH, PSUBSCRIBE

# pubsub_demo.py
import redis
import threading
import time

r_pub = redis.Redis(host="localhost", port=6379, decode_responses=True)
r_sub = redis.Redis(host="localhost", port=6379, decode_responses=True)

def subscriber():
    pubsub = r_sub.pubsub()

    # Subscribe to exact channel
    pubsub.subscribe("notifications:global")

    # Pattern subscription — catches notifications:user:*, notifications:team:*, etc.
    pubsub.psubscribe("notifications:*")

    for message in pubsub.listen():
        if message["type"] in ("message", "pmessage"):
            print(f"[{message['channel']}] {message['data']}")

def publisher():
    time.sleep(0.5)  # Let subscriber connect
    r_pub.publish("notifications:global", "System maintenance at 22:00 UTC")
    r_pub.publish("notifications:user:42", "Your export is ready")
    r_pub.publish("notifications:team:engineering", "Deploy window open")

t = threading.Thread(target=subscriber, daemon=True)
t.start()
publisher()
time.sleep(1)

Keyspace Notifications

Keyspace notifications let you subscribe to Redis key lifecycle events — expiry, deletion, set operations — without polling. Enable them in redis.conf or at runtime:

# Enable expired + generic key events
redis-cli CONFIG SET notify-keyspace-events "Ex"
# Watch for key expiry events
pubsub = r_sub.pubsub()
pubsub.psubscribe("__keyevent@0__:expired")

for message in pubsub.listen():
    if message["type"] == "pmessage":
        expired_key = message["data"]
        print(f"Key expired: {expired_key}")
        # Trigger: session cleanup, cache invalidation, reminder dispatch

Practical applications: session invalidation (trigger logout cleanup when session key expires), job timeout detection (set a key with the job TTL; expiry fires if the job never deletes it), and distributed lock monitoring.

Fan-Out Architecture

Redis Pub/Sub is the broadcast backbone for real-time fan-out. A single publisher can reach thousands of subscribers in under a millisecond. The pattern for a presence indicator in a chat application:

  1. On connect: SET presence:{user_id} online EX 30 + PUBLISH presence:channel "{user_id}:online"
  2. Heartbeat: EXPIRE presence:{user_id} 30 every 15 seconds
  3. On disconnect: key expires → keyspace notification fires → PUBLISH presence:channel "{user_id}:offline"
  4. All connected clients receive the publish and update the UI

In Redis Cluster mode, Pub/Sub messages are broadcast to all shards — the cluster itself handles routing, so your application code is identical in standalone and cluster deployments.


4. Lua Scripts for Atomic Operations

Every Redis MULTI/EXEC transaction has a fundamental limitation: the commands inside it are queued and sent as a batch, but the application must still make multiple round trips (WATCH, MULTI, commands, EXEC) and cannot branch based on intermediate values. If GET counter returns 5, you cannot conditionally SET counter 10 inside the same transaction without an optimistic lock retry loop.

Lua scripts run inside Redis's single-threaded execution model. From the moment EVAL fires, no other Redis command executes until the script completes. You get true atomicity, you can branch on intermediate values, and you eliminate round trips. The entire script is a single command from the client's perspective.

Rate Limiter: Sliding Window in Lua

# rate_limiter.py
import redis
import time

r = redis.Redis(host="localhost", port=6379, decode_responses=True)

# Sliding window rate limiter
# Uses a sorted set where each member is a unique request ID
# and the score is the request timestamp in milliseconds.
RATE_LIMIT_SCRIPT = """
local key = KEYS[1]
local now = tonumber(ARGV[1])
local window_ms = tonumber(ARGV[2])
local max_requests = tonumber(ARGV[3])
local request_id = ARGV[4]

-- Remove entries outside the sliding window
redis.call('ZREMRANGEBYSCORE', key, '-inf', now - window_ms)

-- Count current requests in window
local count = redis.call('ZCARD', key)

if count < max_requests then
    -- Allow: add this request to the window
    redis.call('ZADD', key, now, request_id)
    redis.call('PEXPIRE', key, window_ms)
    return {1, max_requests - count - 1}  -- {allowed, remaining}
else
    -- Deny
    return {0, 0}
end
"""

# Load script once, use SHA thereafter (saves bandwidth)
RATE_LIMIT_SHA = r.script_load(RATE_LIMIT_SCRIPT)

def check_rate_limit(
    user_id: str,
    max_requests: int = 100,
    window_seconds: int = 60,
) -> tuple[bool, int]:
    """
    Check if user_id is within rate limit.
    Returns (allowed: bool, remaining: int).
    """
    key = f"ratelimit:{user_id}"
    now_ms = int(time.time() * 1000)
    request_id = f"{now_ms}-{id(object())}"  # unique per request

    result = r.evalsha(
        RATE_LIMIT_SHA,
        1,             # number of KEYS arguments
        key,           # KEYS[1]
        now_ms,        # ARGV[1]
        window_seconds * 1000,  # ARGV[2]: window in ms
        max_requests,  # ARGV[3]
        request_id,    # ARGV[4]
    )

    allowed = bool(result[0])
    remaining = int(result[1])
    return allowed, remaining

Distributed Lock with Expiry

The canonical Redis distributed lock pattern uses SET key token NX EX ttl. The token (a UUID) ensures only the lock holder can release it — another process cannot accidentally release a lock it doesn't hold. The Lua script makes the check-and-delete atomic:

import uuid

RELEASE_LOCK_SCRIPT = """
-- Only release if we hold the lock (token matches)
if redis.call('GET', KEYS[1]) == ARGV[1] then
    return redis.call('DEL', KEYS[1])
else
    return 0
end
"""
RELEASE_LOCK_SHA = r.script_load(RELEASE_LOCK_SCRIPT)

def acquire_lock(resource: str, ttl_seconds: int = 10) -> str | None:
    """Acquire lock. Returns token if acquired, None if not."""
    token = str(uuid.uuid4())
    acquired = r.set(f"lock:{resource}", token, nx=True, ex=ttl_seconds)
    return token if acquired else None

def release_lock(resource: str, token: str) -> bool:
    """Release lock only if we hold it."""
    result = r.evalsha(RELEASE_LOCK_SHA, 1, f"lock:{resource}", token)
    return bool(result)

# Usage
token = acquire_lock("job:export:user:42", ttl_seconds=30)
if token:
    try:
        pass  # do work
    finally:
        release_lock("job:export:user:42", token)
Comparison visual
sequenceDiagram participant C1 as Client 1 participant C2 as Client 2 participant R as Redis rect rgb(255, 235, 235) Note over C1,R: Race condition — MULTI/EXEC with WATCH C1->>R: WATCH counter C2->>R: WATCH counter C1->>R: GET counter → 5 C2->>R: GET counter → 5 C1->>R: MULTI / INCR counter / EXEC → OK (counter=6) C2->>R: MULTI / INCR counter / EXEC → nil (conflict, retry needed) end rect rgb(235, 255, 235) Note over C1,R: Lua atomic — no conflict possible C1->>R: EVAL "if GET counter >= limit then return 0 end INCR counter return 1" Note over R: Executes atomically; C2 blocked until complete R-->>C1: 1 (allowed) C2->>R: EVAL same script R-->>C2: 0 (limit reached) or 1 (incremented) end

Conditional Leaderboard Update in Lua

# Only update a user's leaderboard score if the new score beats their current best
UPDATE_BEST_SCORE_SCRIPT = """
local key = KEYS[1]
local member = ARGV[1]
local new_score = tonumber(ARGV[2])

local current = redis.call('ZSCORE', key, member)

if current == false or new_score > tonumber(current) then
    redis.call('ZADD', key, new_score, member)
    return 1  -- updated
else
    return 0  -- not updated (new score wasn't better)
end
"""
UPDATE_BEST_SCORE_SHA = r.script_load(UPDATE_BEST_SCORE_SCRIPT)

def update_best_score(leaderboard: str, user_id: str, score: float) -> bool:
    result = r.evalsha(
        UPDATE_BEST_SCORE_SHA, 1,
        leaderboard,
        user_id,
        score,
    )
    return bool(result)

5. Redis as a Vector Database

Redis Stack ships with RediSearch, which since version 2.4 includes a production-grade vector search engine. It supports HNSW (Hierarchical Navigable Small World) and flat (brute-force) indexes, hybrid search combining vector similarity with metadata filters, and ANN (approximate nearest neighbor) search returning results in under a millisecond for millions of vectors on a single node.

This matters because teams running semantic search, recommendation engines, or RAG (retrieval-augmented generation) pipelines increasingly face the question: run a dedicated vector database (Pinecone, Weaviate, Qdrant), or use Redis Stack and keep the stack simple? For datasets under 10 million vectors where Redis is already in the stack, the answer is often Redis.

Setup: Creating a Vector Index

# vector_search.py
import redis
import numpy as np
from redis.commands.search.field import VectorField, TagField, TextField
from redis.commands.search.indexDefinition import IndexDefinition, IndexType
from redis.commands.search.query import Query

r = redis.Redis(host="localhost", port=6379, decode_responses=False)

VECTOR_DIM = 1536       # OpenAI text-embedding-3-small dimension
INDEX_NAME = "idx:docs"
DOC_PREFIX = "doc:"

def create_index():
    try:
        r.ft(INDEX_NAME).dropindex(delete_documents=False)
    except Exception:
        pass  # Index didn't exist

    schema = (
        TextField("$.text", as_name="text"),
        TagField("$.category", as_name="category"),
        VectorField(
            "$.embedding",
            "HNSW",           # HNSW for ANN (fast); FLAT for exact (small datasets)
            {
                "TYPE": "FLOAT32",
                "DIM": VECTOR_DIM,
                "DISTANCE_METRIC": "COSINE",   # or L2, IP (inner product)
                "INITIAL_CAP": 100_000,        # preallocate for 100k vectors
                "M": 16,                       # HNSW connectivity parameter
                "EF_CONSTRUCTION": 200,        # HNSW build-time quality
            },
            as_name="embedding",
        ),
    )

    r.ft(INDEX_NAME).create_index(
        schema,
        definition=IndexDefinition(
            prefix=[DOC_PREFIX],
            index_type=IndexType.JSON,
        ),
    )
    print(f"Index '{INDEX_NAME}' created")


def store_document(doc_id: str, text: str, category: str, embedding: np.ndarray):
    """Store a document with its embedding."""
    import json
    key = f"{DOC_PREFIX}{doc_id}"
    r.json().set(key, "$", {
        "text": text,
        "category": category,
        "embedding": embedding.astype(np.float32).tolist(),
    })


def vector_search(
    query_embedding: np.ndarray,
    top_k: int = 5,
    category_filter: str = None,
) -> list[dict]:
    """
    KNN vector search with optional metadata filter.

    Hybrid search: combine vector similarity with tag filter.
    This is where Redis outperforms many dedicated vector DBs —
    metadata filtering happens at the index level, not post-hoc.
    """
    query_bytes = query_embedding.astype(np.float32).tobytes()

    # Build filter expression
    if category_filter:
        # Hybrid: vector similarity AND metadata filter
        filter_expr = f"(@category:{{{category_filter}}})"
    else:
        filter_expr = "*"

    # KNN query syntax: @field_name:[VECTOR_RANGE radius $param]
    # or KNN top_k: @field_name:[KNN k $param]
    q = (
        Query(f"{filter_expr}=>[KNN {top_k} @embedding $vec AS score]")
        .sort_by("score")
        .return_fields("text", "category", "score")
        .paging(0, top_k)
        .dialect(2)
    )

    results = r.ft(INDEX_NAME).search(q, query_params={"vec": query_bytes})

    return [
        {
            "id": doc.id,
            "text": doc.text,
            "category": doc.category,
            "score": float(doc.score),   # cosine distance (lower = more similar)
        }
        for doc in results.docs
    ]

Performance Characteristics

On a single Redis node with 16 GB of RAM, HNSW handles 1 million 1536-dimension vectors in approximately 6 GB of memory and returns KNN results in under 2 milliseconds at the 99th percentile. Flat (brute-force) indexes are exact but O(n) — use flat for datasets under 50,000 vectors where perfect recall matters, HNSW for everything larger.

Redis Vector Search vs Dedicated Vector DBs

Factor Redis Stack Pinecone Weaviate Qdrant
Setup complexity Low (already in stack) Zero (managed) Medium Medium
Max scale (practical) ~10M vectors/node Unlimited (managed) Unlimited Unlimited
Hybrid search Yes Yes Yes Yes
Persistence RDB/AOF Managed Yes Yes
Cost at 1M vectors $0 (existing Redis) ~$70/mo (s1.x1) Self-host costs Self-host costs
Operational overhead Minimal Zero Moderate Moderate

Choose Redis for vectors when: you already run Redis Stack, dataset is under 10M vectors, and you want to avoid a separate service. Choose Pinecone when: you need fully managed, unlimited scale with zero ops. Choose Weaviate or Qdrant when: you need advanced filtering, multi-modal search, or open-source self-hosted control beyond what Redis offers.


6. Cluster Mode and High Availability

A standalone Redis node is a single point of failure. For production systems where Redis is on the critical path — and if you are using it as a message bus, session store, or real-time cache, it is — you need either Sentinel (automatic failover for standalone) or Redis Cluster (sharding + HA combined).

Hash Slots

Redis Cluster distributes keys across 16,384 hash slots. Each key maps to a slot via CRC16(key) % 16384. Slots are distributed across primary nodes — a three-node cluster gives approximately 5,461 slots per node. Reads from replicas are allowed with READONLY mode but are eventually consistent.

# Check which slot a key maps to
redis-cli CLUSTER KEYSLOT "user:123:session"
# → 8490 (example)

# Check which node owns that slot
redis-cli -c CLUSTER NODES | grep "8490"

Hash Tags for Co-location

Multi-key commands (MGET, MSET, Lua scripts referencing multiple keys) only work in Cluster mode if all keys hash to the same slot. Hash tags force co-location: only the portion of the key inside {} is used for slot calculation.

# Without hash tags — these keys may land on different nodes
# MGET user:123:profile user:123:session  ← may fail in cluster mode

# With hash tags — both keys hash on "user:123"
# MGET {user:123}:profile {user:123}:session  ← always same slot

user_id = 123
profile_key = f"{{user:{user_id}}}:profile"
session_key = f"{{user:{user_id}}}:session"
cart_key    = f"{{user:{user_id}}}:cart"

# Now safe to use in pipelines and Lua scripts in cluster mode
pipe = r.pipeline(transaction=True)
pipe.get(profile_key)
pipe.get(session_key)
pipe.get(cart_key)
results = pipe.execute()

Sentinel vs Cluster

Sentinel provides automatic failover for a single primary + N replicas. It does not shard data. Use Sentinel when your dataset fits on one node and you want automatic failover without the complexity of Cluster. Three Sentinel processes (odd number for quorum) monitor the primary; if the primary is unreachable from quorum Sentinels, a failover is triggered and a replica is promoted. Failover takes 30–60 seconds by default (down-after-milliseconds + failover-timeout).

Cluster provides sharding across multiple primaries, each with optional replicas. Use Cluster when your dataset exceeds single-node memory, when you need horizontal write throughput, or when you want HA and sharding in a single deployment model.

Connection Pooling

Every application connecting to Redis should use a connection pool. Creating a new TCP connection per command adds 1–3 ms of overhead — significant when Redis commands themselves take under 0.1 ms.

# redis_pool.py
import redis

# Connection pool — create once at application startup
pool = redis.ConnectionPool(
    host="localhost",
    port=6379,
    db=0,
    max_connections=50,        # tune based on worker count × commands-per-request
    decode_responses=True,
    socket_timeout=1.0,        # command timeout
    socket_connect_timeout=2.0,
)

# All clients share the pool
def get_redis() -> redis.Redis:
    return redis.Redis(connection_pool=pool)

For Redis Cluster with ioredis in Node.js:

// cluster-client.js
import Redis from "ioredis";

const cluster = new Redis.Cluster(
  [
    { host: "redis-node-1", port: 6379 },
    { host: "redis-node-2", port: 6379 },
    { host: "redis-node-3", port: 6379 },
  ],
  {
    redisOptions: {
      password: process.env.REDIS_PASSWORD,
      connectTimeout: 2000,
    },
    clusterRetryStrategy: (times) => Math.min(times * 100, 3000),
    // Read from replicas for read-heavy workloads
    scaleReads: "slave",
  }
);

export default cluster;

Sentinel Failover Configuration

# redis-sentinel.conf (minimal production config)
sentinel monitor mymaster 10.0.1.10 6379 2      # quorum = 2
sentinel down-after-milliseconds mymaster 5000   # 5s to declare primary down
sentinel failover-timeout mymaster 60000         # 60s max for failover
sentinel parallel-syncs mymaster 1               # replicas to sync in parallel

With down-after-milliseconds 5000 and a typical failover completing in 15–20 seconds, expect a 20–30 second window of write unavailability during an unplanned primary failure. For applications that cannot tolerate this, use Cluster with min-replicas-to-write 1 to fail writes fast.


Conclusion

Redis earns its place on the critical path of production systems not because it is fast (it is), but because it provides the right primitives at each layer of the application stack. The patterns in this post cover the full range: advanced caching with XFetch eliminates stampedes without coordination overhead; Streams give you Kafka-level durability for the majority of real-world event volumes with none of the operational weight; Pub/Sub is the right tool for fire-and-forget fan-out where persistence would add latency with no benefit; Lua scripts make compound operations truly atomic without multi-round-trip transaction protocols; and Redis Stack's vector search removes the need for a separate vector store for datasets up to tens of millions of embeddings.

The pattern-selection heuristic is straightforward: if you need persistence and replay, use Streams. If you need broadcast with no durability requirement, use Pub/Sub. If you need atomic compound operations on multiple keys, use Lua. If you need sub-millisecond semantic search and you already run Redis Stack, use the vector index before reaching for Pinecone.

Operational considerations that matter more than any individual pattern: connection pooling (don't create connections per request), hash tags for co-location in Cluster mode (or multi-key commands will fail), and TTL hygiene (keys without TTLs will grow Redis memory indefinitely). Monitor redis-cli INFO memory for used_memory_rss versus maxmemory, and set maxmemory-policy allkeys-lru in cache-only deployments so Redis degrades gracefully under memory pressure rather than refusing writes.

The full code in this post is production-ready. Drop the XFetch implementation into any cache layer, the consumer group worker into any event-driven service, and the Lua rate limiter into any API gateway. The primitives are stable across Redis 7.x.


Sources

About the Author

Toc Am

Founder of AmtocSoft. Writing practical deep-dives on AI engineering, cloud architecture, and developer tooling. Previously built backend systems at scale. Reviews every post published under this byline.

LinkedIn X / Twitter

Published: 2026-06-10 · Updated: 2026-04-18 · Written with AI assistance, reviewed by Toc Am.

Get These In Your Inbox

Weekly deep-dives on AI engineering, no fluff. Join the newsletter →

Subscribe (free)

Or grab the book ($39, ~100 pages) · Buy me a coffee

Buy Me a Coffee · 🔔 YouTube · 💼 LinkedIn · 🐦 X/Twitter

Bigger Is Not the Same as Better. The Job That Moved Is the Phone, Not the Lab.

Bigger is a plan. The phone is the receipt. The brief for this cycle is a question: does bigger always mean better in AI? The 2026 answer i...