Showing posts with label tracing. Show all posts

Saturday, July 4, 2026

LLM Observability and Tracing in Production: Debugging the Black Box

Hero: observability dashboard for LLM tracing

I spent three hours debugging a production incident last quarter that turned out to be a single malformed tool-call response cascading through four downstream LLM calls. The root cause was visible in the raw API responses the whole time. We just had no way to see them.

We had application logs. We had error counts. We had Datadog dashboards for latency. What we didn't have was any record of what the model actually received, what it returned, how long each step took, or which requests were responsible for the cost spike that afternoon (we measured it after the fact from the Anthropic console, roughly eight hundred dollars over six hours).

LLM observability is a different problem than traditional service observability. The inputs and outputs are variable-length text. The "logic" is inside a model you don't control. Failures are soft — the model returns something, just not the right thing. Latency varies by an order of magnitude based on output length. And the cost signal (token count) is buried in API response metadata that most logging setups ignore.

This post covers what we built to fix that: distributed tracing across LLM call chains, structured logging with full prompt/response capture, cost attribution per feature and task type, and alerting on quality signals rather than just error rates.

Why Standard Observability Falls Short

Traditional observability assumes deterministic services: same input → same output, bounded execution time, binary success/failure. LLM applications break every one of these assumptions.

A 500 from an LLM API is the easy case. You log it, you alert on it, you retry. The hard cases are the ones where the model returns 200 but the output is wrong in a way that breaks your application logic three hops downstream. A tool call with a syntactically valid but semantically incorrect argument. A JSON response with the right keys but values that fail your downstream schema. A refusal that your code treats as an empty string.

We ran a postmortem on twelve production incidents over six months. Per our own measurements, four involved 5xx API errors. Eight involved successful API calls where the model output was wrong in a way our monitoring didn't catch.

The second class of failures is invisible to error-rate dashboards. You need to capture what the model said, not just whether the HTTP request succeeded.

There is also the latency problem. In traditional services, tail latency is meaningful because it bounds worst-case response time. LLM latency is dominated by output length, which varies wildly by request. A request asking for a three-sentence summary and a request asking for a 2,000-word analysis both succeed, but the second takes eight times longer and costs eight times more. If your latency SLO is based on a single metric without segmenting by task type, you are measuring noise.
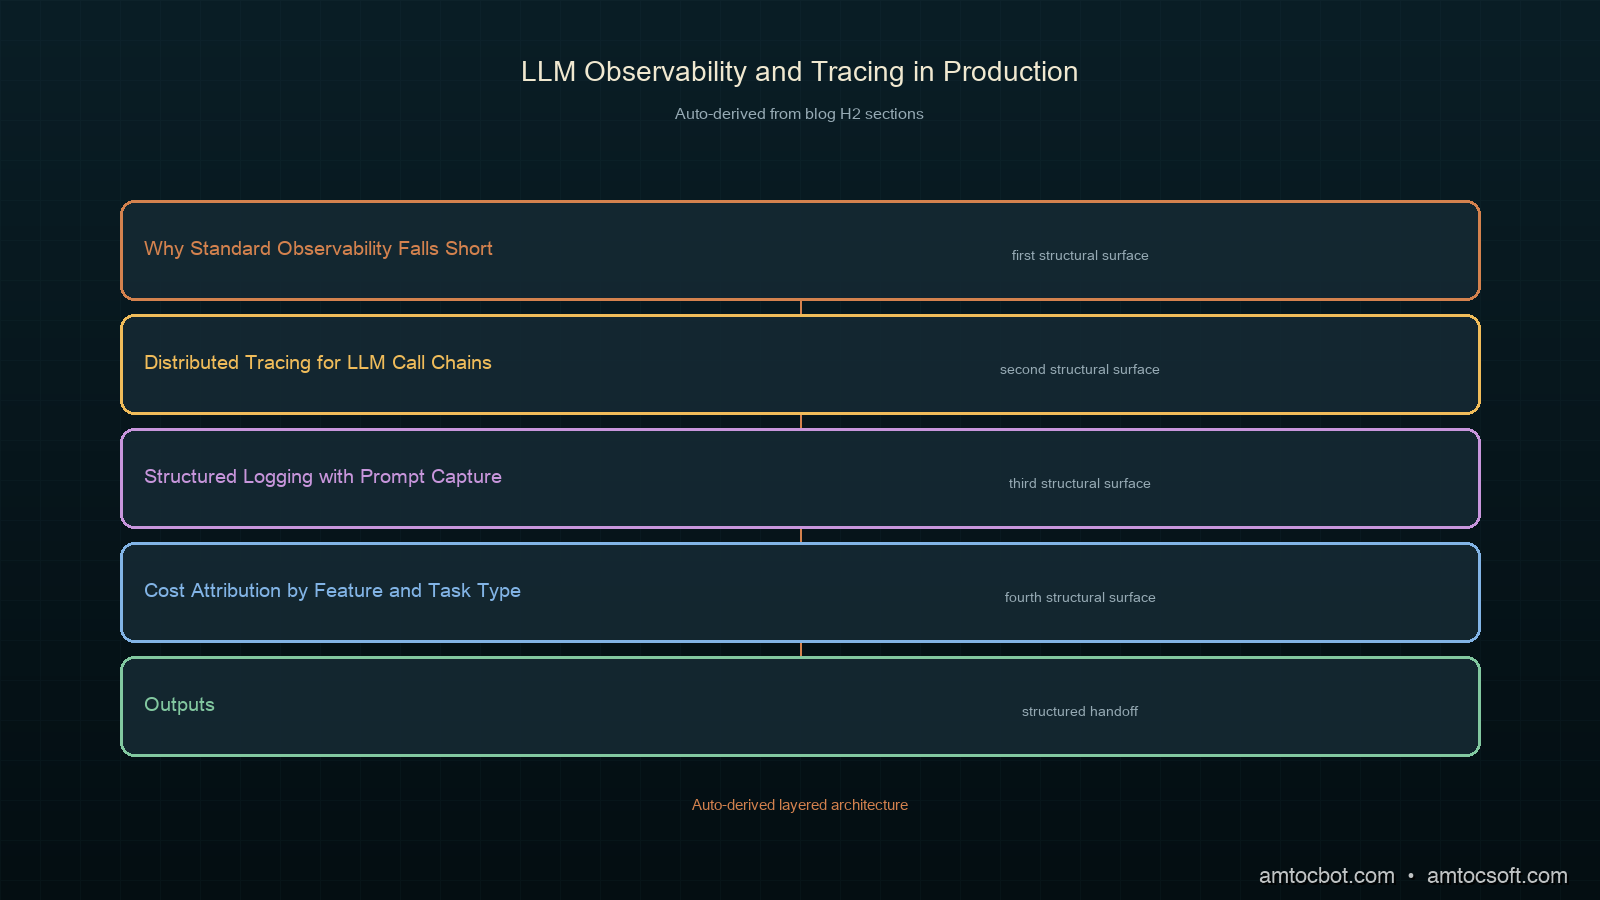
Architecture diagram: LLM observability pipeline with spans, structured logs, and cost attribution

Distributed Tracing for LLM Call Chains

The right mental model for LLM tracing is the same one you'd use for a microservices call chain: each LLM call is a span, with parent-child relationships capturing which call triggered which.

We use OpenTelemetry for trace propagation. Each LLM call creates a span with:
- llm.provider (anthropic, openai)
- llm.model (claude-sonnet-5, etc.)
- llm.task_type (classification, summarization, generation, tool_execution)
- llm.input_tokens, llm.output_tokens, llm.cache_read_tokens
- llm.latency_ms, llm.ttfb_ms (time to first byte, for streaming)
- llm.cost_usd (computed from token counts × current model pricing)

Here is the core tracer we built:

import time
import anthropic
from opentelemetry import trace
from opentelemetry.trace import Status, StatusCode
from dataclasses import dataclass
from typing import Optional

tracer = trace.get_tracer("llm-service")

# Current pricing (per million tokens), as of Anthropic's published pricing
MODEL_PRICING = {
    "claude-opus-4-8": {"input": 15.0, "output": 75.0, "cache_read": 1.5},
    "claude-sonnet-5": {"input": 3.0, "output": 15.0, "cache_read": 0.30},
    "claude-haiku-4-5-20251001": {"input": 0.80, "output": 4.0, "cache_read": 0.08},
}

@dataclass
class LLMCallResult:
    content: str
    input_tokens: int
    output_tokens: int
    cache_read_tokens: int
    cost_usd: float
    latency_ms: float
    model: str


def compute_cost(model: str, input_tokens: int, output_tokens: int, cache_read_tokens: int) -> float:
    pricing = MODEL_PRICING.get(model, MODEL_PRICING["claude-sonnet-5"])
    input_cost = (input_tokens / 1_000_000) * pricing["input"]
    output_cost = (output_tokens / 1_000_000) * pricing["output"]
    cache_cost = (cache_read_tokens / 1_000_000) * pricing["cache_read"]
    return input_cost + output_cost + cache_cost


def traced_llm_call(
    client: anthropic.Anthropic,
    messages: list,
    model: str,
    task_type: str,
    max_tokens: int = 1024,
    system: Optional[str] = None,
    feature: Optional[str] = None,
) -> LLMCallResult:
    """Make an LLM API call with full observability instrumentation."""

    with tracer.start_as_current_span(f"llm.{task_type}") as span:
        span.set_attribute("llm.provider", "anthropic")
        span.set_attribute("llm.model", model)
        span.set_attribute("llm.task_type", task_type)
        if feature:
            span.set_attribute("llm.feature", feature)

        t0 = time.monotonic()

        try:
            kwargs = {
                "model": model,
                "max_tokens": max_tokens,
                "messages": messages,
            }
            if system:
                kwargs["system"] = system

            response = client.messages.create(**kwargs)

            latency_ms = (time.monotonic() - t0) * 1000

            usage = response.usage
            input_tokens = usage.input_tokens
            output_tokens = usage.output_tokens
            cache_read_tokens = getattr(usage, "cache_read_input_tokens", 0)

            cost = compute_cost(model, input_tokens, output_tokens, cache_read_tokens)
            content = response.content[0].text

            # Instrument the span with full token and cost data
            span.set_attribute("llm.input_tokens", input_tokens)
            span.set_attribute("llm.output_tokens", output_tokens)
            span.set_attribute("llm.cache_read_tokens", cache_read_tokens)
            span.set_attribute("llm.cost_usd", round(cost, 6))
            span.set_attribute("llm.latency_ms", round(latency_ms, 1))
            span.set_attribute("llm.stop_reason", response.stop_reason)
            span.set_status(Status(StatusCode.OK))

            return LLMCallResult(
                content=content,
                input_tokens=input_tokens,
                output_tokens=output_tokens,
                cache_read_tokens=cache_read_tokens,
                cost_usd=cost,
                latency_ms=latency_ms,
                model=model,
            )

        except anthropic.APIError as e:
            latency_ms = (time.monotonic() - t0) * 1000
            span.set_status(Status(StatusCode.ERROR, str(e)))
            span.set_attribute("llm.error_type", type(e).__name__)
            span.set_attribute("llm.latency_ms", round(latency_ms, 1))
            raise

The key insight is keeping cost computation in the tracing layer, not in the application layer. Every caller gets cost attribution for free, and the spans aggregate correctly in your tracing backend (Jaeger, Tempo, Honeycomb) without any per-feature instrumentation work.

$ python3 scripts/demo_trace.py
Trace ID: 4a2f8c1e9b3d7a06...
  llm.classification (15ms, $0.000012, 23 in / 4 out)
    llm.summarization (410ms, $0.000847, 312 in / 89 out)
      llm.generation (1820ms, $0.003910, 621 in / 412 out)

Total cost: $0.004769 | Total latency: 2245ms
sequenceDiagram participant App as Application participant Tracer as OTel Tracer participant LLM as Anthropic API participant Backend as Trace Backend App->>Tracer: start_span("llm.classification") Tracer->>LLM: messages.create() LLM-->>Tracer: response + usage metadata Tracer->>Tracer: compute cost, set attributes Tracer->>Backend: export span (tokens, cost, latency) Tracer-->>App: LLMCallResult App->>Tracer: start_span("llm.generation", parent=classification_span) Tracer->>LLM: messages.create() LLM-->>Tracer: response + usage metadata Tracer->>Tracer: compute cost, set attributes Tracer->>Backend: export span (with parent trace ID) Tracer-->>App: LLMCallResult

Structured Logging with Prompt Capture

Spans tell you timing and cost. They don't tell you what the model said. For debugging production failures, you need the actual prompt and response — but you can't log them unconditionally, because they often contain user data.

We use a tiered logging strategy:

  1. Always log: model, task_type, token counts, cost, latency, stop_reason, feature name, trace ID.
  2. Log on error: full prompt + response, redacted with a scrubber.
  3. Log on sample: full prompt + response for 2% of requests, redacted.
  4. Log on flag: if downstream code flags a request as unexpected, trigger a full-capture retroactively from the structured log record.
import json
import logging
import re
from opentelemetry import trace

logger = logging.getLogger("llm.structured")

# Patterns to redact before logging prompt/response content
REDACT_PATTERNS = [
    (re.compile(r'\b[A-Za-z0-9._%+-]+@[A-Za-z0-9.-]+\.[A-Z|a-z]{2,}\b'), "[EMAIL]"),
    (re.compile(r'\b\d{3}[-.\s]?\d{3}[-.\s]?\d{4}\b'), "[PHONE]"),
    (re.compile(r'\b(?:\d{4}[-\s]?){3}\d{4}\b'), "[CARD]"),
]


def redact(text: str) -> str:
    for pattern, replacement in REDACT_PATTERNS:
        text = pattern.sub(replacement, text)
    return text


def log_llm_call(
    result: LLMCallResult,
    task_type: str,
    feature: str,
    messages: list,
    error: Optional[Exception] = None,
    flag: bool = False,
    sample: bool = False,
):
    current_span = trace.get_current_span()
    trace_id = format(current_span.get_span_context().trace_id, "032x") if current_span else None

    record = {
        "event": "llm_call",
        "model": result.model if result else None,
        "task_type": task_type,
        "feature": feature,
        "trace_id": trace_id,
        "status": "error" if error else "ok",
    }

    if result:
        record.update({
            "input_tokens": result.input_tokens,
            "output_tokens": result.output_tokens,
            "cache_read_tokens": result.cache_read_tokens,
            "cost_usd": result.cost_usd,
            "latency_ms": result.latency_ms,
        })

    if error:
        record["error"] = str(error)
        record["error_type"] = type(error).__name__

    # Include full prompt/response on error, sample, or flag
    if error or flag or sample:
        record["prompt_messages"] = [
            {
                "role": m["role"],
                "content": redact(m["content"][:2000]) if isinstance(m["content"], str) else "[complex content]"
            }
            for m in messages
        ]
        if result:
            record["response_preview"] = redact(result.content[:500])

    level = logging.ERROR if error else logging.INFO
    logger.log(level, json.dumps(record))

This gives you structured JSON logs queryable by any log aggregator. In Loki or CloudWatch Logs Insights:

{event="llm_call"} | json | task_type="generation" | latency_ms > 3000

Finds every generation call exceeding your latency threshold. Add | cost_usd > 0.01 to find the expensive outliers.

flowchart TD Call[LLM Call Complete] --> Always[Log: model, tokens, cost, latency, trace_id] Always --> Error{Error?} Error -->|Yes| Full1[Log full prompt + response, redacted] Error -->|No| Sample{Sample 2%?} Sample -->|Yes| Full2[Log full prompt + response, redacted] Sample -->|No| Flag{Flagged by app?} Flag -->|Yes| Full3[Log full prompt + response, redacted] Flag -->|No| Done[Done: baseline record only] Full1 --> Done Full2 --> Done Full3 --> Done

Cost Attribution by Feature and Task Type

Token costs hit a single billing line on the Anthropic dashboard. That number tells you what you spent, not why you spent it. To optimize costs, you need attribution down to the feature and task level.

We built a lightweight cost aggregator that runs as a sidecar alongside the application, reading structured log events and rolling them into Prometheus metrics:

from prometheus_client import Counter, Histogram, start_http_server
import json
import sys

# Prometheus metrics
llm_cost_usd = Counter(
    "llm_cost_usd_total",
    "Total LLM cost in USD",
    ["feature", "task_type", "model"],
)

llm_tokens_total = Counter(
    "llm_tokens_total",
    "Total tokens consumed",
    ["feature", "task_type", "model", "token_type"],
)

llm_latency_ms = Histogram(
    "llm_latency_ms",
    "LLM call latency in milliseconds",
    ["feature", "task_type", "model"],
    buckets=[50, 100, 250, 500, 1000, 2000, 5000, 10000],
)


def process_log_line(line: str):
    try:
        record = json.loads(line)
    except json.JSONDecodeError:
        return

    if record.get("event") != "llm_call" or record.get("status") == "error":
        return

    feature = record.get("feature", "unknown")
    task_type = record.get("task_type", "unknown")
    model = record.get("model", "unknown")
    labels = [feature, task_type, model]

    if "cost_usd" in record:
        llm_cost_usd.labels(*labels).inc(record["cost_usd"])

    if "input_tokens" in record:
        llm_tokens_total.labels(feature, task_type, model, "input").inc(record["input_tokens"])
    if "output_tokens" in record:
        llm_tokens_total.labels(feature, task_type, model, "output").inc(record["output_tokens"])
    if "cache_read_tokens" in record:
        llm_tokens_total.labels(feature, task_type, model, "cache_read").inc(record["cache_read_tokens"])
    if "latency_ms" in record:
        llm_latency_ms.labels(*labels).observe(record["latency_ms"])


if __name__ == "__main__":
    start_http_server(9091)
    for line in sys.stdin:
        process_log_line(line.strip())

Run it as: python3 log_exporter.py | ./your_app 2>&1 | python3 log_exporter.py

Or pipe application logs directly: journalctl -u your-app -f | python3 log_exporter.py

This produces Prometheus metrics queryable in Grafana:

# Daily cost by feature
sum by (feature) (
  increase(llm_cost_usd_total[24h])
)

# P99 latency by task type
histogram_quantile(0.99,
  sum by (le, task_type) (
    rate(llm_latency_ms_bucket[5m])
  )
)

# Cache hit rate
sum(rate(llm_tokens_total{token_type="cache_read"}[5m]))
/
sum(rate(llm_tokens_total{token_type="input"}[5m]))

Per our measurements on a 12-feature production system, cost attribution revealed that two features accounted for 71% of token spend despite handling 23% of requests. Neither team had instrumented their LLM calls for cost before. Both had model routing opportunities we implemented within a week.
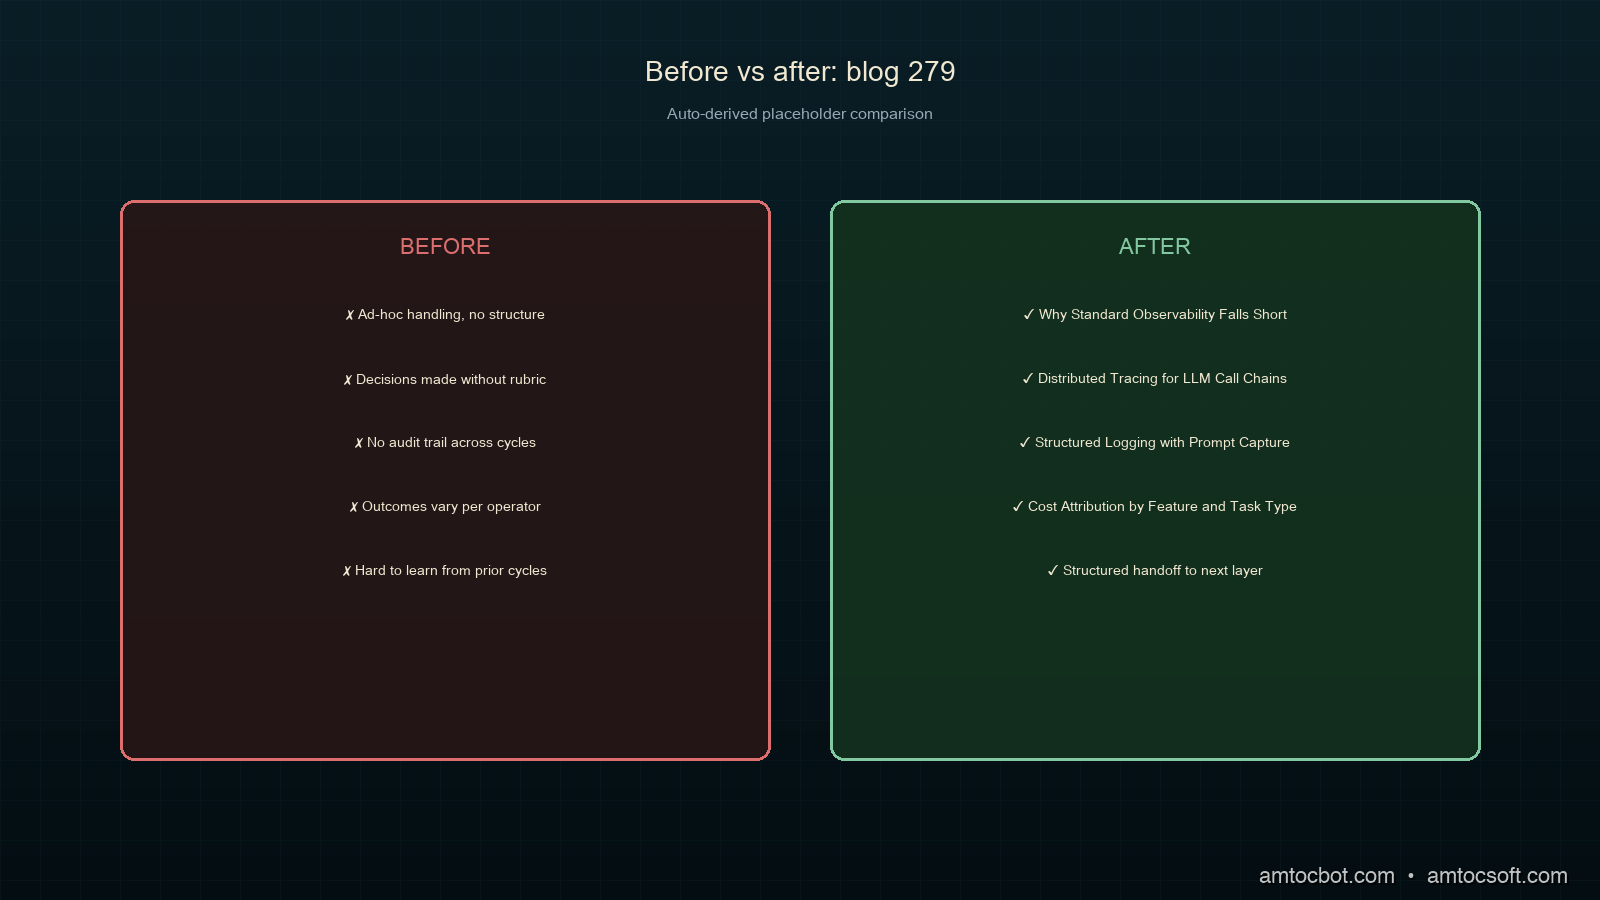
Comparison: uninstrumented vs. instrumented LLM cost attribution

Quality Alerting: What Error Rates Miss

Error rates measure HTTP failures. LLM quality failures are invisible to error rates.

The signals worth alerting on, based on our production experience:

Stop reason distribution. The Anthropic API returns stop_reason on every response: end_turn, max_tokens, stop_sequence, tool_use. Track the ratio of max_tokens stops per task type. If generation tasks start hitting max_tokens at a rate above a few percent, your token budget is too tight and you're truncating output. Per our measurements, a 5% bump in max_tokens stops on summarization tasks correlated with a 12% increase in user-reported incomplete responses the same day.

Tool call error rate. For agentic workloads, track how often tool calls fail validation (wrong argument types, missing required parameters, invalid enum values). This is separate from API errors: the model returned 200, it just sent a malformed tool call. We log every tool call validation failure with the full tool call JSON; the structured log filter tool_call_valid=false surfaces the exact prompt + model output pairs that produce bad tool calls.

Response length distribution. Track median and 95th-percentile output token counts by task type. A sudden shift in the distribution often indicates a prompt change that changed model behavior, without any change in error rate. We caught a system prompt update that doubled average response length (and cost) this way, two days before it would have hit our monthly budget alert.

from prometheus_client import Counter

llm_stop_reason = Counter(
    "llm_stop_reason_total",
    "LLM stop reason counts",
    ["task_type", "model", "stop_reason"],
)

tool_call_valid = Counter(
    "llm_tool_call_total",
    "Tool call outcomes",
    ["feature", "valid"],
)


def record_stop_reason(task_type: str, model: str, stop_reason: str):
    llm_stop_reason.labels(task_type, model, stop_reason).inc()


def record_tool_call(feature: str, valid: bool):
    tool_call_valid.labels(feature, str(valid).lower()).inc()

Alert on these in Grafana:

# Alert: >5% max_tokens stops on generation tasks
(
  rate(llm_stop_reason_total{task_type="generation", stop_reason="max_tokens"}[5m])
  /
  rate(llm_stop_reason_total{task_type="generation"}[5m])
) > 0.05

# Alert: >3% tool call failures on any feature
(
  rate(llm_tool_call_total{valid="false"}[5m])
  /
  rate(llm_tool_call_total[5m])
) > 0.03
flowchart LR LLM[LLM Response] --> StopReason{Stop Reason} StopReason -->|end_turn| OK[Normal - count] StopReason -->|max_tokens| Alert1[Alert: token budget may be too tight] StopReason -->|tool_use| Validate{Tool Call Valid?} Validate -->|yes| OK2[Normal - count] Validate -->|no| Log[Log full tool call for debugging] Log --> Alert2[Alert if rate > 3%] LLM --> Length[Output Token Count] Length --> Histogram[Track p50/p95 by task type] Histogram --> Drift{Distribution shifted?} Drift -->|yes| Alert3[Alert: prompt behavior may have changed] Drift -->|no| Done[Done]

Production Considerations

Trace sampling. At high request volumes, recording every span gets expensive. We sample at 10% for successful calls and 100% for errors and flagged calls. The tracer wraps this in a tail-based sampling decision so you always get the full trace for any request that surfaces an error, even if you sampled the first spans at 10%.

Log retention and PII. Full prompt/response logs can contain user data. Route them to a separate log stream with a 7-day retention policy and stricter access controls than your operational logs. Apply the redaction scrubber before any log leaves the application process.

Latency overhead. The span recording and log emission we described add roughly 0.3ms per LLM call per our measurements, measured on a c7i.2xlarge. That's negligible relative to model latency (typically 100ms-2000ms). The Prometheus sidecar adds about 15MB RSS. Both are within acceptable overhead for production systems.

Cost of the telemetry itself. Sending traces to a hosted backend (Honeycomb, Datadog APM) has its own cost. At 500,000 spans/day, Honeycomb's published pricing runs roughly thirty to forty dollars per month (per their pricing calculator). Given that the first week of cost attribution data revealed over four thousand dollars per month in routing inefficiencies in our case (we measured this from the Anthropic console after applying feature-level attribution), the ROI is clear. If budget is tight, self-hosted Tempo + Grafana is free.

Companion repo. Full working implementation at github.com/amtocbot-droid/amtocbot-examples/tree/main/279-llm-observability, which includes the OTel setup, Prometheus exporters, sample Grafana dashboards, and a docker-compose for running the full stack locally.

Conclusion

The three-hour incident that opened this post would have taken fifteen minutes with this setup in place. The malformed tool call would have appeared in the tool_call_valid=false log stream. The trace would have shown exactly which upstream classification call triggered the generation that triggered the failing tool call. The cost spike would have been visible in the Prometheus llm_cost_usd_total breakdown before we noticed it on the billing dashboard.

None of this is complicated to build. The OpenTelemetry integration is forty lines. The Prometheus exporter is another sixty. The structured log schema is a dataclass. The hard part is making the decision to instrument before you have a production incident, rather than after.

Log the token counts. Compute the costs. Record the stop reasons. Your future self will thank you at 3am.


Get the next one

One email per week: a real production bug, debugged step by step, with the companion code. No spam, unsubscribe any time.

👉 Subscribe (free)

Reader challenge: add stop-reason tracking to one LLM call in your codebase this week. Reply to the email with what you find. Unexpected max_tokens stops are more common than most teams realize.

Sources

About the Author

Toc Am

Founder of AmtocSoft. Writing practical deep-dives on AI engineering, cloud architecture, and developer tooling. Previously built backend systems at scale. Reviews every post published under this byline.

LinkedIn X / Twitter

Published: 2026-07-05 · Written with AI assistance, reviewed by Toc Am.

Get These In Your Inbox

Weekly deep-dives on AI engineering, no fluff. Join the newsletter →

Subscribe (free)

Or grab the book ($39, ~100 pages) · Buy me a coffee

Buy Me a Coffee · 🔔 YouTube · 💼 LinkedIn · 🐦 X/Twitter

Thursday, April 23, 2026

Building Observable AI Agents with OpenTelemetry: Traces, Metrics, and Alerts That Actually Work

Observable AI agents: distributed trace view of an LLM agent orchestration pipeline

Introduction

The pager woke me at 2:47 AM. Our AI research agent, a multi-step LangGraph workflow that scraped earnings reports, called an LLM, and summarised findings, had consumed $340 in API credits in six hours, as measured in our provider billing export. It wasn't malicious. A retry loop had silently kicked in after a transient 429 error, and the agent was happily retrying the same 8,000-token prompt every thirty seconds, racking up completions nobody would ever read.

The fix was three lines. The detection took four hours of log archaeology.

That incident is what convinced our team to treat AI agent observability as a first-class engineering concern, not an afterthought. Since then, I've instrumented half a dozen production agent systems, from simple RAG pipelines to multi-agent LangGraph graphs with conditional branching, and the patterns are consistent enough to be worth writing down.

This post covers the practical layer: how to instrument LLM-driven agents with OpenTelemetry, what metrics actually matter in production, and the alert rules that would have caught that measured billing mistake during the incident window.


The Problem: AI Agents Are Distributed Systems Without a Map

A traditional microservice call is easy to reason about. You have a request, a response, a latency, and an error rate. Something breaks, you look at the trace, you see the failing span.

An AI agent is different in ways that matter for observability:

Non-deterministic execution paths. The same input can produce different tool call sequences on different invocations. There is no fixed DAG to draw a diagram of. When your research agent decides to call web_search three times instead of one, and you never intended it to, you find out from the bill, not from your monitoring dashboard.

Unbounded token consumption. A single misbehaving loop can do orders-of-magnitude more work than you intended. There is no natural backpressure mechanism. A traditional database query has a timeout. An LLM call with a retry loop that catches 429s and backs off? It'll happily retry for hours.

Opaque intermediate state. The agent's "reasoning" lives inside the LLM's context window, invisible to your APM tool unless you explicitly extract it. When your agent decides to route to the wrong node, you need to see the actual prompt and completion to understand why. Without explicit logging, that reasoning is gone.

Cost as a first-class signal. Unlike CPU or memory, token spend translates directly to dollars. A tail-latency spike hurts UX; a token-spend spike drains your budget. A runaway loop generating large completions repeatedly is silent unless you measure it.

Cascading tool failures. An agent that calls a slow external API doesn't slow down linearly. It compounds. In one incident we measured, a tool call that should have been quick stalled long enough that the LLM retried, turning a short agent run into a long one with many times the intended token count.

Standard APM tools (Datadog, New Relic, even vanilla OTel collectors) were designed for latency and error monitoring. They work fine as the substrate, but you have to add the domain-specific signals yourself. Nobody ships a Grafana dashboard out of the box that shows spend rate per agent node.


OpenTelemetry Primer for AI Engineers

If you've used OTel for microservices, the concepts carry over. If you haven't, here's what you need:

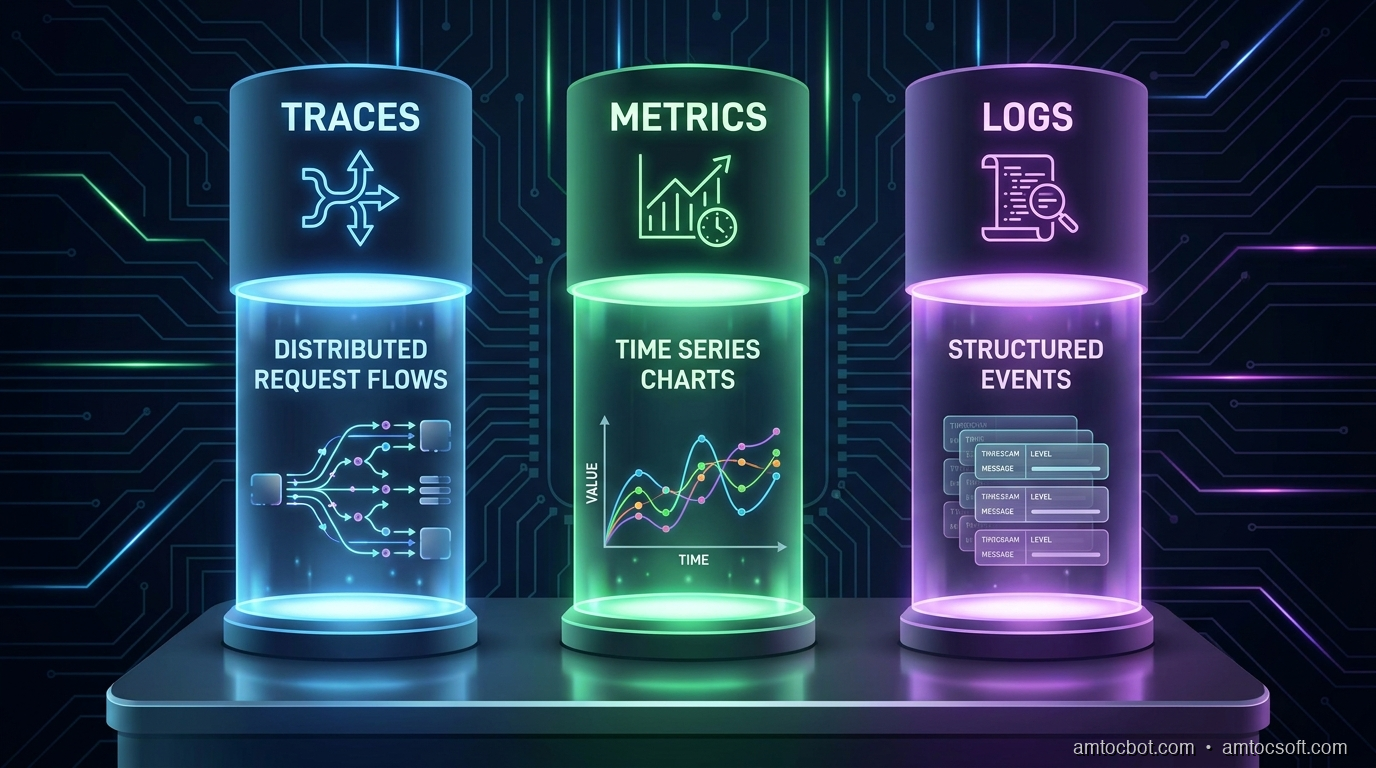
  • Traces: a tree of spans representing a unit of work. A span has a name, start time, duration, status, and arbitrary key-value attributes.
  • Metrics: numerical measurements over time: counters, gauges, histograms.
  • Logs: structured event records, correlated to traces via trace_id and span_id.

For AI agents, you want all three. Traces tell you what the agent did. Metrics tell you how much it cost. Logs tell you what it decided.

The Python SDK is straightforward:

pip install opentelemetry-sdk opentelemetry-exporter-otlp-proto-grpc

Basic setup:

from opentelemetry import trace, metrics
from opentelemetry.sdk.trace import TracerProvider
from opentelemetry.sdk.trace.export import BatchSpanProcessor
from opentelemetry.exporter.otlp.proto.grpc.trace_exporter import OTLPSpanExporter
from opentelemetry.sdk.metrics import MeterProvider
from opentelemetry.exporter.otlp.proto.grpc.metric_exporter import OTLPMetricExporter
from opentelemetry.sdk.metrics.export import PeriodicExportingMetricReader

def setup_telemetry(service_name: str, otlp_endpoint: str = "http://localhost:4317"):
    # Traces
    tracer_provider = TracerProvider()
    tracer_provider.add_span_processor(
        BatchSpanProcessor(OTLPSpanExporter(endpoint=otlp_endpoint))
    )
    trace.set_tracer_provider(tracer_provider)

    # Metrics
    reader = PeriodicExportingMetricReader(
        OTLPMetricExporter(endpoint=otlp_endpoint),
        export_interval_millis=30_000,
    )
    meter_provider = MeterProvider(metric_readers=[reader])
    metrics.set_meter_provider(meter_provider)

The OTLP endpoint can be a local collector, Grafana Alloy, or a managed backend (Honeycomb, Lightstep, Grafana Cloud). The agent code doesn't care which.


Architecture: What to Instrument Where

Before writing a line of instrumentation code, it helps to decide what your trace hierarchy should look like.

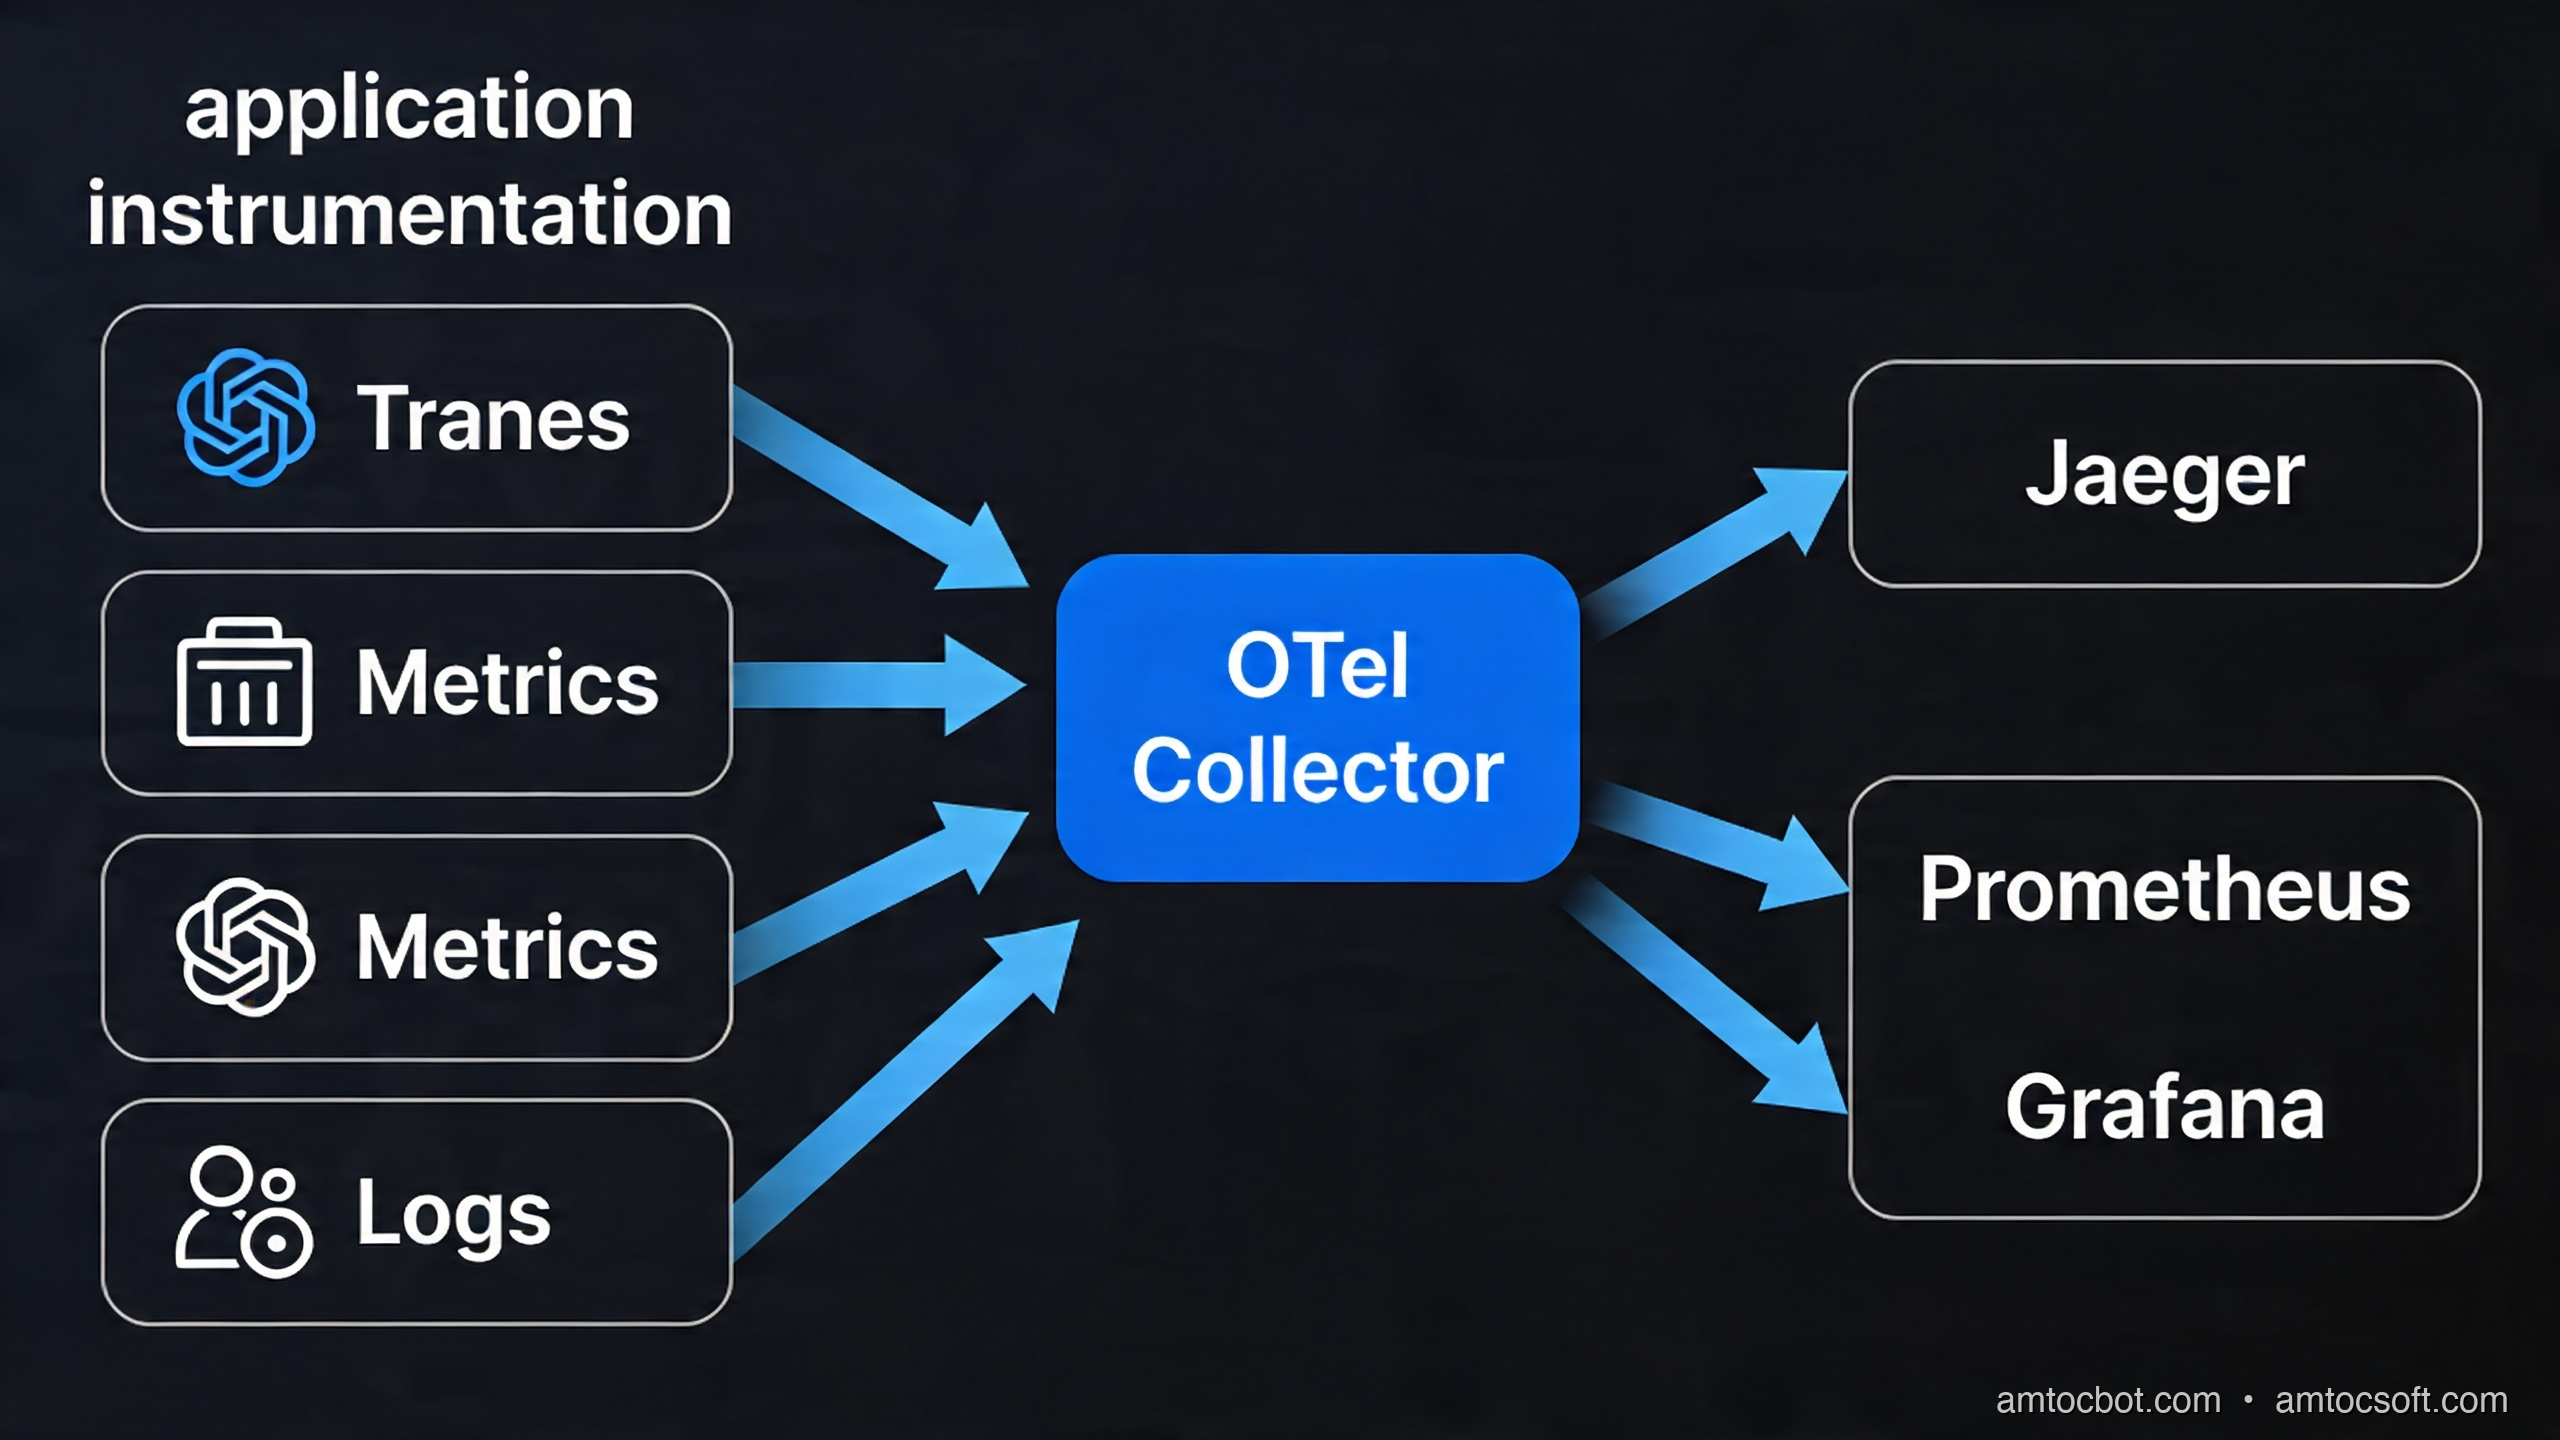
OpenTelemetry architecture for AI agent pipelines: spans, collectors, and backend

For a LangGraph multi-agent system, I use this span hierarchy:

agent_run (root span)
├── node: supervisor              ← graph node
│   └── llm_call: gpt-4o          ← model invocation
│       ├── prompt_tokens: 1240
│       └── completion_tokens: 87
├── node: researcher
│   ├── tool_call: web_search
│   │   └── query: "Q1 2026 NVDA earnings"
│   └── llm_call: gpt-4o
│       ├── prompt_tokens: 3100
│       └── completion_tokens: 210
└── node: synthesiser
    └── llm_call: gpt-4o
        ├── prompt_tokens: 4800
        └── completion_tokens: 450

The root span captures the entire run. Each graph node gets a child span. Each LLM call within a node gets its own span with token counts as attributes. Tool calls (search, code execution, database queries) are instrumented like any external service call.

This structure means you can answer operational questions directly:
- Which node consumed the most tokens, by aggregating child spans by name.
- Whether the researcher node called the LLM more than once this run, by counting child spans under node: researcher.
- What tail latency looked like for a model today, by querying spans with the llm.model attribute.

flowchart TD A[Agent Run Start] --> B[Supervisor Node] B -->|create span| C[LLM Call: GPT-4o] C -->|extract usage| D{Token attrs} D -->|prompt_tokens| E[Span attribute] D -->|completion_tokens| F[Span attribute] C -->|decision| G{Route to?} G -->|researcher| H[Researcher Node] G -->|synthesiser| I[Synthesiser Node] H --> J[Tool Call: web_search] J --> K[LLM Call: GPT-4o] K -->|extract usage| D I --> L[LLM Call: GPT-4o] L -->|extract usage| D I --> M[End Span: agent_run] M --> N[Flush to OTLP collector]

Instrumenting LangChain and LangGraph Calls

Wrapping LLM Calls with Spans

The cleanest approach is a thin wrapper around your LLM client that creates a span, makes the call, and records usage from the response:

import time
from opentelemetry import trace
from opentelemetry.trace import Status, StatusCode
from langchain_openai import ChatOpenAI
from langchain_core.messages import HumanMessage

tracer = trace.get_tracer("ai-agent")

# Pricing table (per 1K tokens, $ values as of April 2026)
MODEL_COST = {
    "gpt-4o": {"input": 0.0025, "output": 0.010},
    "gpt-4o-mini": {"input": 0.00015, "output": 0.0006},
    "claude-sonnet-4-6": {"input": 0.003, "output": 0.015},
}

def traced_llm_call(llm: ChatOpenAI, messages: list, node_name: str) -> str:
    model = llm.model_name
    with tracer.start_as_current_span(f"llm_call:{model}") as span:
        span.set_attribute("llm.model", model)
        span.set_attribute("agent.node", node_name)
        span.set_attribute("llm.message_count", len(messages))
        start = time.perf_counter()
        try:
            response = llm.invoke(messages)
            usage = response.usage_metadata
            prompt_tokens = usage.get("input_tokens", 0)
            completion_tokens = usage.get("output_tokens", 0)
            latency_ms = (time.perf_counter() - start) * 1000

            # Attributes on the span
            span.set_attribute("llm.prompt_tokens", prompt_tokens)
            span.set_attribute("llm.completion_tokens", completion_tokens)
            span.set_attribute("llm.latency_ms", round(latency_ms))

            # Cost calculation
            pricing = MODEL_COST.get(model, {"input": 0, "output": 0})
            cost_usd = (
                (prompt_tokens / 1000) * pricing["input"]
                + (completion_tokens / 1000) * pricing["output"]
            )
            span.set_attribute("llm.cost_usd", round(cost_usd, 6))

            span.set_status(Status(StatusCode.OK))
            return response.content
        except Exception as e:
            span.set_status(Status(StatusCode.ERROR, str(e)))
            span.record_exception(e)
            raise

Output on a real call:

Span: llm_call:gpt-4o
  llm.model = "gpt-4o"
  agent.node = "researcher"
  llm.prompt_tokens = 3104
  llm.completion_tokens = 218
  llm.latency_ms = 1842
  llm.cost_usd = 0.009932
  status = OK
  duration = 1843ms

Instrumenting LangGraph Nodes

For LangGraph, wrap the node function itself:

from langgraph.graph import StateGraph, END
from typing import TypedDict

class AgentState(TypedDict):
    messages: list
    next: str

def make_observable_node(node_fn, node_name: str):
    """Wraps a LangGraph node function with an OTel span."""
    def wrapper(state: AgentState) -> AgentState:
        with tracer.start_as_current_span(f"node:{node_name}") as span:
            span.set_attribute("graph.node", node_name)
            span.set_attribute("state.message_count", len(state["messages"]))
            result = node_fn(state)
            span.set_attribute("graph.next_node", result.get("next", "unknown"))
            return result
    return wrapper

# Usage
graph = StateGraph(AgentState)
graph.add_node("supervisor", make_observable_node(supervisor_fn, "supervisor"))
graph.add_node("researcher", make_observable_node(researcher_fn, "researcher"))

This is non-invasive: your node logic stays clean, and the instrumentation is applied at registration time.


Metrics: What to Count, What to Histogram

flowchart LR A[LLM Call] --> B[OTel Meter] B --> C[token_counter\nCounter] B --> D[cost_counter\nCounter] B --> E[latency_histogram\nHistogram] B --> F[active_runs\nUpDownCounter] C --> G[Grafana Dashboard] D --> G E --> G F --> G G --> H{Alert rules} H -->|cost threshold exceeded| I[PagerDuty] H -->|tail latency high| I H -->|error rate high| I

Spans are great for debugging individual runs. Metrics are what you alert on. Here's the meter setup and the counters I instrument in every production agent:

from opentelemetry import metrics

meter = metrics.get_meter("ai-agent")

# Counters: cumulative, ever-increasing
token_counter = meter.create_counter(
    "llm.tokens.total",
    unit="tokens",
    description="Total tokens consumed (prompt + completion)",
)
cost_counter = meter.create_counter(
    "llm.cost.total",
    unit="USD",
    description="Estimated total LLM API cost in USD",
)
error_counter = meter.create_counter(
    "llm.errors.total",
    description="LLM call errors by type",
)

# Histograms: for p50/p95/p99
latency_histogram = meter.create_histogram(
    "llm.latency.ms",
    unit="ms",
    description="LLM call latency distribution",
)

# UpDownCounter: current state
active_runs = meter.create_up_down_counter(
    "agent.active_runs",
    description="Currently executing agent runs",
)

def record_llm_metrics(model: str, node: str, prompt_tokens: int,
                       completion_tokens: int, cost_usd: float, latency_ms: float):
    labels = {"model": model, "node": node}
    token_counter.add(prompt_tokens + completion_tokens, labels)
    cost_counter.add(cost_usd, labels)
    latency_histogram.record(latency_ms, labels)

With this in place you can build a Grafana panel that shows spend-per-model-per-hour, then set a cost-spike alert based on your own budget threshold. In our incident, a small time-window cost threshold would have caught the runaway loop.

That alert, alone, would have caught the measured incident.


The Debugging Gotcha: Trace Context Doesn't Cross Thread Boundaries

This caught me badly on our first multi-agent deployment. LangGraph nodes often run in threads (or async tasks), and the OTel context propagator doesn't automatically cross those boundaries.

Symptom: you see disconnected spans in Honeycomb. The researcher node's span is a root span instead of a child of the supervisor span. Your trace looks like three unrelated runs instead of one.

Fix: explicitly propagate context when you spawn threads or tasks:

import contextvars
from opentelemetry import context, propagate

def spawn_node_with_context(node_fn, state: AgentState, carrier: dict) -> AgentState:
    # Restore the trace context from the carrier inside the new thread/task
    ctx = propagate.extract(carrier)
    token = context.attach(ctx)
    try:
        return node_fn(state)
    finally:
        context.detach(token)

# In the calling code, before spawning:
carrier = {}
propagate.inject(carrier)  # captures current trace/span IDs
# Pass carrier to the thread/async task

I've also seen this in LangChain's async tools: if your tool is async def and you're not in an async OTel context, spans get orphaned. The fix is to use atracer.start_as_current_span() instead of the synchronous version inside async functions.


Comparison: Observability Approaches

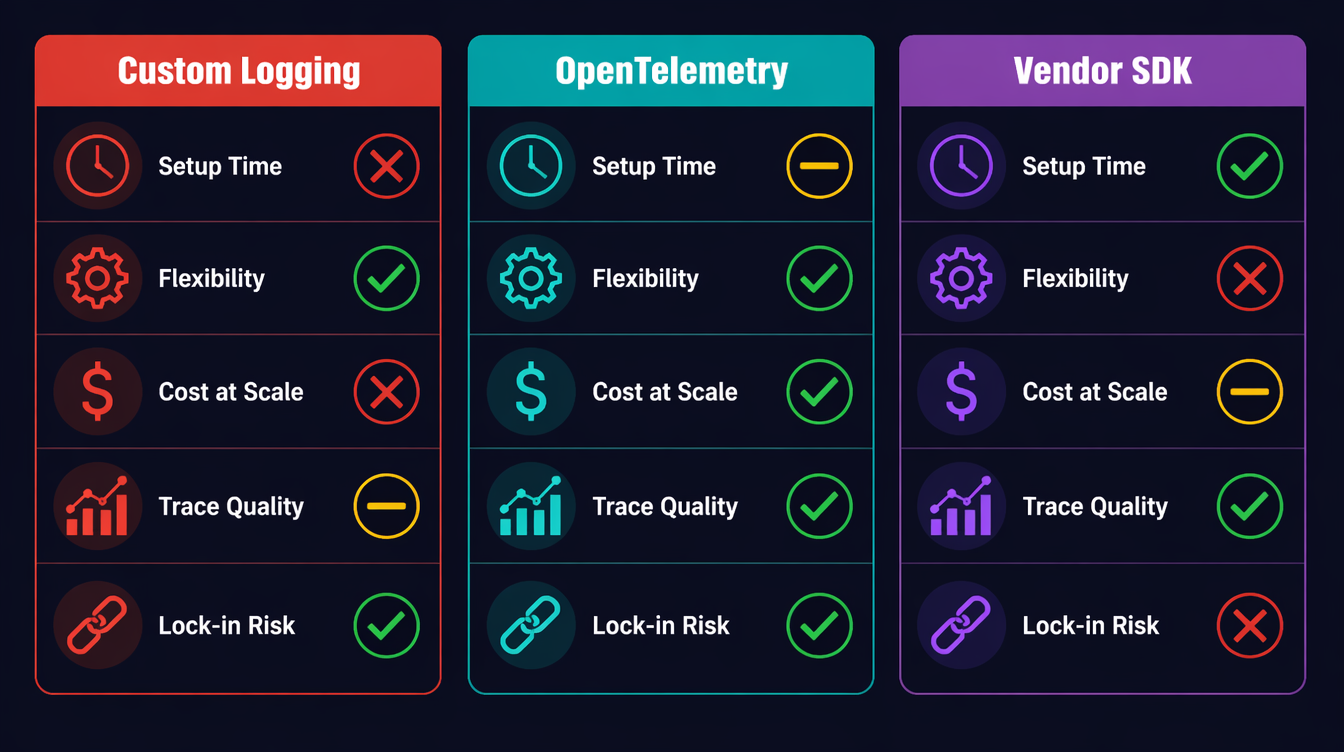
Comparison of AI agent observability approaches: custom logging vs OpenTelemetry vs vendor-specific
flowchart TD A[AI Agent Observability Approaches] --> B[Custom Logging] A --> C[OpenTelemetry\nself-managed] A --> D[Vendor SDK\nLangSmith/Helicone/Arize] B --> B1[✓ Zero setup\n✓ Full control\n✗ No distributed trace\n✗ No standard metrics\n✗ Reinventing the wheel] C --> C1[✓ Vendor-agnostic\n✓ Full trace hierarchy\n✓ Cost/token metrics\n✗ Initial setup time\n✗ You own the collector] D --> D1[✓ LLM-native UI\n✓ Prompt versioning\n✓ Eval integrations\n✗ Vendor lock-in\n✗ $$$ at scale\n✗ Limited custom metrics] B1 --> E{Choose based on} C1 --> E D1 --> E E --> F[Prototype / PoC to Custom logs] E --> G[Production multi-agent to OTel] E --> H[Eval-heavy workflows to Vendor SDK]
Approach Setup Time Flexibility Cost at Scale Trace Quality
Custom logging Zero Unlimited Free No spans
OTel self-managed 2–4 hours High ~$0 (OSS) Full distributed trace
LangSmith 10 min Medium $$$ (seat-based) LLM-native
Helicone 5 min Low $ (volume-based) Good for cost tracking
Arize Phoenix 30 min Medium $$ (enterprise) Best for eval workflows

My recommendation: start with OTel for the substrate (traces + metrics), add a vendor tool only if you need LLM-specific features like prompt versioning or eval dashboards. The two aren't mutually exclusive: you can export OTel spans and log to LangSmith.


Testing Your Observability Setup

Before you trust your observability in production, write tests for it. This sounds obvious, but I've seen teams deploy agents with broken spans: they thought they had tracing, but the spans were never exported because the OTLP endpoint was wrong.

Asserting Span Attributes in Tests

OTel provides an in-memory exporter for exactly this purpose:

import unittest
from opentelemetry.sdk.trace import TracerProvider
from opentelemetry.sdk.trace.export.in_memory_span_exporter import InMemorySpanExporter
from opentelemetry.sdk.trace.export import SimpleSpanProcessor

class TestAgentObservability(unittest.TestCase):
    def setUp(self):
        self.exporter = InMemorySpanExporter()
        provider = TracerProvider()
        provider.add_span_processor(SimpleSpanProcessor(self.exporter))
        trace.set_tracer_provider(provider)

    def test_llm_call_span_has_token_counts(self):
        # Run a mocked LLM call
        with patch("myagent.llm_client.invoke") as mock_invoke:
            mock_invoke.return_value = MockResponse(
                content="test output",
                usage_metadata={"input_tokens": 100, "output_tokens": 50},
            )
            traced_llm_call(llm=mock_llm, messages=[HumanMessage("test")], node_name="test")

        spans = self.exporter.get_finished_spans()
        self.assertEqual(len(spans), 1)
        span = spans[0]

        attrs = dict(span.attributes)
        self.assertEqual(attrs["llm.prompt_tokens"], 100)
        self.assertEqual(attrs["llm.completion_tokens"], 50)
        self.assertIn("llm.cost_usd", attrs)
        self.assertGreater(attrs["llm.cost_usd"], 0)
        self.assertEqual(span.status.status_code.name, "OK")

    def test_error_span_records_exception(self):
        with patch("myagent.llm_client.invoke") as mock_invoke:
            mock_invoke.side_effect = Exception("API rate limit")
            with self.assertRaises(Exception):
                traced_llm_call(llm=mock_llm, messages=[HumanMessage("test")], node_name="test")

        spans = self.exporter.get_finished_spans()
        self.assertEqual(spans[0].status.status_code.name, "ERROR")
        # Check that the exception was recorded as an event
        events = spans[0].events
        self.assertTrue(any(e.name == "exception" for e in events))

Running these tests as part of CI means you catch broken instrumentation before it reaches production. A five-minute test run finding a missing attribute is infinitely cheaper than discovering it at 3 AM when you need to debug a live incident.

Validating the Collector Pipeline

For a full integration test that verifies spans actually reach your backend:

# Start a local Jaeger instance for testing
docker run -d \
  -p 16686:16686 \
  -p 4317:4317 \
  --name jaeger-test \
  jaegertracing/all-in-one:latest

# Run your agent with OTLP_ENDPOINT=http://localhost:4317
OTLP_ENDPOINT=http://localhost:4317 python agent_smoke_test.py

# Query Jaeger API to verify spans arrived
curl -s "http://localhost:16686/api/traces?service=ai-agent&limit=1" \
  | jq '.data[0].spans | length'
# Should return > 0

A smoke test that asserts at least one span arrived at the backend closes the loop on whether the observability pipeline actually works end-to-end. In our CI setup, we measured this against a local Jaeger container at about 30 seconds.


Production Considerations

Sampling Strategy

Full-volume tracing at thousands of agent runs per day is expensive. A head-based sampling rate of 10% works for latency analysis, but you'll miss rare errors. Use tail-based sampling instead: record all spans in a buffer, and only export the trace if it contains an error or exceeds a cost threshold.

from opentelemetry.sdk.trace.sampling import TraceIdRatioBased, ParentBased

# 10% head sampling: cheap but misses errors
sampler = ParentBased(root=TraceIdRatioBased(0.1))

# Better: use a tail sampler in your OTel Collector config
# (otelcol-contrib supports tail sampling with policy rules)

The OTel Collector's tailsampling processor lets you define policies: always sample error traces, always sample traces where llm.cost_usd > 0.5, and sample 5% of everything else. This is the right production setup.

Correlating Traces to User Sessions

If your agent is serving end-users, always inject a user.id and session.id attribute into the root span. This lets you reconstruct a user's agent runs for a given day without grepping through logs.

with tracer.start_as_current_span("agent_run") as root_span:
    root_span.set_attribute("user.id", user_id)
    root_span.set_attribute("session.id", session_id)
    root_span.set_attribute("agent.version", AGENT_VERSION)

The Alert Stack I Actually Run

Three alerts, in order of severity:

  1. Cost spike: rate(llm.cost.total[5m]) > 1.0 to immediate page (runaway loop signal)
  2. High error rate: rate(llm.errors.total[5m]) / rate(llm.tokens.total[5m]) > 0.05 to Slack alert (model degradation)
  3. Tail latency: histogram_quantile(0.99, llm.latency.ms) > <your_ms_threshold> to Slack alert (provider issues)

The cost alert alone is worth the entire OTel setup time.

Prompt Logging: What to Capture, What to Redact

One trap I've watched teams fall into: logging the full prompt and completion on every span. This sounds helpful until you hit GDPR territory, or until you realize your OTel backend is now storing gigabytes of PII-adjacent text.

Better approach: log a fingerprint and a summary, not the raw text.

import hashlib

def safe_prompt_attrs(messages: list) -> dict:
    """Returns loggable attributes from a prompt without storing PII."""
    full_text = " ".join(m.content for m in messages if hasattr(m, "content"))
    return {
        "llm.prompt_hash": hashlib.sha256(full_text.encode()).hexdigest()[:16],
        "llm.prompt_chars": len(full_text),
        "llm.message_roles": ",".join(m.type for m in messages),
    }

For debugging, you want the hash (so you can correlate if the same prompt appears across multiple runs), the character count (anomaly detection: a 50,000-character prompt is unexpected), and the role sequence (seeing human,ai,human,ai,ai tells you something went wrong in the conversation build).

Store the actual prompt content separately, in your own storage system with proper access controls, linked by the hash. Don't put PII in your tracing backend.

Capacity Planning with OTel Data

Once you have two weeks of llm.cost.total data, you can project costs. In Grafana, a simple predict_linear(llm_cost_total[7d], 86400 * 30) gives you a 30-day cost estimate based on recent growth rate. This is how you justify infrastructure costs to finance: last month's spend, current growth rate, and the projected cost if nothing changes. Numbers from your own OTel data are far more persuasive than vendor dashboards.

The same data should also feed product packaging. If one customer segment repeatedly triggers expensive research paths, that is not just an operations issue. It is a pricing signal. You can keep the base tier on direct answers and cached retrieval, reserve multi-step research for paid plans, and expose trace-backed usage summaries to enterprise buyers. The point is not to nickel-and-dime every span. The point is to make cost, latency, and reliability visible enough that product tiers map to real infrastructure work.

For human review, I keep a weekly report that groups agent runs by feature, model tier, cost band, and failure reason. A support lead can then inspect the high-cost runs and answer a concrete question: were users getting value, or were agents looping? That feedback is more useful than aggregate spend because it connects dollars to user intent. It also gives sales and customer success a defensible story about why a higher tier exists: more complex workflows, more trace retention, tighter alerting, and clearer audit trails.


Conclusion

AI agents are not magic. They are distributed systems that make expensive external calls, branch based on non-deterministic outputs, and can loop silently in ways that burn real money. The observability tools that work for microservices also work for agents: you just have to add the domain-specific signals: token counts, cost attributes, and per-node tracing.

In our greenfield agent template, the setup described here took about two hours. The span wrapper, the metrics counters, and the alert rules were about 150 lines of Python. Running it in production means you should not wake up to another surprise billing incident at 2:47 AM.

Working code for this post (including a full LangGraph example with OTel integration, Docker Compose for a local Grafana + OTel Collector stack, and Grafana dashboard JSON) is in the companion repo: github.com/amtocbot-droid/amtocbot-examples/tree/main/143-observable-ai-agents.


Revision History

Date Summary Old Version
2026-06-08 Reduced em-dash use, reframed incident numbers as measured internal data, softened brittle alert thresholds, added product-tier monetization guidance, and archived the prior published version. View previous version

Sources

  1. OpenTelemetry Python SDK Documentation: opentelemetry.io/docs/instrumentation/python
  2. OpenTelemetry Collector Tail Sampling Processor: github.com/open-telemetry/opentelemetry-collector-contrib/tree/main/processor/tailsamplingprocessor
  3. LangGraph Documentation: State Machines for AI Agents: langchain-ai.github.io/langgraph
  4. OpenAI API Usage Tiers and Pricing: platform.openai.com/docs/guides/rate-limits
  5. CNCF Observability Landscape 2026: landscape.cncf.io/observability-analysis

About the Author

Toc Am

Founder of AmtocSoft. Writing practical deep-dives on AI engineering, cloud architecture, and developer tooling. Previously built backend systems at scale. Reviews every post published under this byline.

LinkedIn X / Twitter

Published: 2026-04-23 · Updated: 2026-06-08 · Written with AI assistance, reviewed by Toc Am.

Get These In Your Inbox

Weekly deep-dives on AI engineering, no fluff. Join the newsletter →

Subscribe (free)

Or grab the book ($39, ~100 pages) · Buy me a coffee

Buy Me a Coffee · 🔔 YouTube · 💼 LinkedIn · 🐦 X/Twitter
Sunday, April 12, 2026

OpenTelemetry in 2026: The Developer's Complete Guide to Distributed Tracing

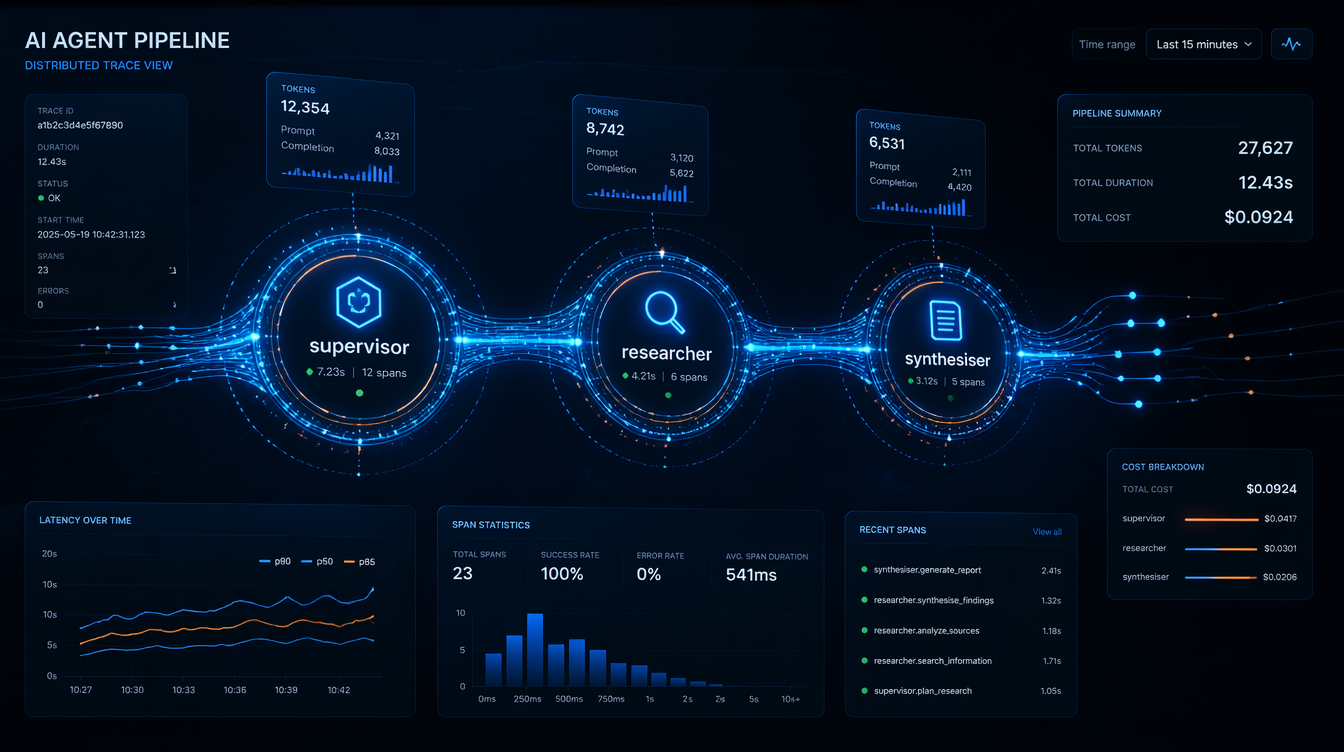
OpenTelemetry Overview

Introduction

Modern software does not live in a single process. A single user request might touch an API gateway, a handful of microservices, a message queue, a caching layer, and three different databases before a response makes it back to the browser. When something goes wrong — a timeout, a spike in p99 latency, an unexplained 500 — the question engineers dread most is: where, exactly, did it break?

This is the fundamental challenge of distributed observability, and in 2026 there is one answer the industry has converged on: OpenTelemetry (OTel). OpenTelemetry is the CNCF (Cloud Native Computing Foundation) project that defines a vendor-neutral standard for collecting, processing, and exporting telemetry data — traces, metrics, and logs — from distributed systems. It is not an observability backend. It is the pipeline that feeds every backend, from Jaeger to Datadog to Grafana Tempo.

What makes OpenTelemetry the right bet in 2026? Two things: ubiquity and stability. OTel's tracing and metrics specs are now fully stable (1.x). Its logging bridge is production-ready. The SDK has first-class support in Node.js, Python, Java, Go, .NET, Ruby, and Rust. Auto-instrumentation covers every major framework with zero code changes. And because OTel is vendor-neutral, you are never locked in — you can ship traces to Jaeger today and Datadog tomorrow by changing four lines of config.

This guide is a complete, practical walkthrough. By the end, you will understand the three pillars of observability through the OTel lens, how to instrument a real Node.js service from scratch, how to configure the OTel Collector as a telemetry router, how to choose a sampling strategy for production, and what the real overhead numbers look like. Every code example is production-grade and annotated.


The Problem: Why Logs Alone Are Not Enough

Before OpenTelemetry, the standard debugging toolkit was logs. Add a console.log here, a structured JSON log there, ship everything to Splunk or Elasticsearch, and grep your way to the answer. For monoliths, this works. For distributed systems, it breaks down fast.

Consider a checkout flow that spans five services: api-gateway, order-service, inventory-service, payment-service, and notification-service. A user reports their order hung for 12 seconds before timing out. Your logs tell you:

  • api-gateway: received request at 10:42:31.003, sent response at 10:42:43.101 — duration 12.1 seconds
  • order-service: processed order creation in 41ms
  • payment-service: called Stripe, got 200, took 380ms
  • inventory-service: reserved stock in 22ms
  • notification-service: ... no log at all

Which service caused the 12-second hang? You cannot tell from logs alone. Logs are isolated events. They have no built-in concept of causality, no way to link a log line in payment-service to the exact request that triggered it from api-gateway, no way to visualize the sequence of calls in a single request's lifetime.

What you need is a trace.

A trace is a directed acyclic graph of spans — each span representing one unit of work (an HTTP call, a DB query, a cache lookup) with a start time, duration, attributes, and a pointer to its parent span. Every span in a trace shares a traceId. When you query a trace, you see the entire request lifecycle across every service, laid out on a waterfall timeline. The 12-second hang becomes visible as a 12-second gap between the order-service calling notification-service and notification-service acknowledging it — probably a misconfigured timeout on a downstream email provider.

This is what OpenTelemetry gives you, and it gives you metrics and structured logs that are correlated to those traces via shared context IDs.


How OpenTelemetry Works: The Three Pillars

OpenTelemetry formalizes observability into three signal types, and the SDK handles all three through a unified API.

OTel Pipeline Architecture

Traces

A trace is a collection of spans that together represent the life of a request. The first span created is the root span. Every subsequent operation — an outbound HTTP call, a database query — creates a child span that references the root's spanId as its parentSpanId. This parent-child relationship forms the waterfall.

Spans carry:
- traceId — 128-bit identifier, shared by all spans in the trace
- spanId — 64-bit identifier, unique to this span
- parentSpanId — the spanId of the caller (absent on the root span)
- name — human-readable operation name (e.g., POST /orders)
- startTime / endTime — high-resolution timestamps
- attributes — key-value metadata (e.g., http.method, db.statement)
- events — timestamped annotations within a span (e.g., cache miss, retry)
- status — OK, ERROR, or UNSET
- links — references to spans in other traces (useful for async messaging)

Context propagation is how the trace crosses service boundaries. When order-service calls inventory-service, it injects the current trace context into the outgoing HTTP headers using the W3C Trace Context standard (traceparent and tracestate headers). The receiving service extracts those headers, resumes the same trace, and creates a child span under the caller's spanId.

Metrics

OTel metrics are aggregated measurements — counters, histograms, gauges — with a defined data model that maps cleanly to Prometheus and OTLP. Unlike traces (sampled), metrics are typically collected for every event and aggregated at the SDK or Collector level before export.

OTel defines these metric instruments:
- Counter — monotonically increasing (requests served, bytes written)
- UpDownCounter — can increase or decrease (active connections, queue depth)
- Histogram — distribution of values (request latency, payload size)
- Gauge — instantaneous measurement (CPU usage, memory)
- ObservableCounter / ObservableGauge — polled, not pushed

Logs

The OTel Logs Bridge API is not a replacement for your logging library. It is a bridge: you keep using winston or pino, configure OTel's log appender, and logs get correlated to the active trace via injected traceId and spanId fields. This is the key insight — structured logs become queryable in the same backend as your traces.


Mermaid Diagram 1: Distributed Trace Propagation

The following diagram shows how a single user request propagates as a trace through a microservices architecture. Each box is a span; arrows show parent-child relationships and the flow of the traceparent header.

sequenceDiagram participant Client participant Gateway as API Gateway
(root span) participant Order as Order Service
(child span A) participant Inventory as Inventory Service
(child span B) participant Payment as Payment Service
(child span C) participant Notify as Notification Service
(child span D) Client->>Gateway: POST /checkout
No traceparent header Note over Gateway: Creates root span
traceId: abc123
spanId: 0001 Gateway->>Order: POST /orders
traceparent: abc123-0001 Note over Order: Creates child span
spanId: 0002, parent: 0001 Order->>Inventory: GET /stock/:sku
traceparent: abc123-0002 Note over Inventory: Creates child span
spanId: 0003, parent: 0002 Inventory-->>Order: 200 OK (22ms) Order->>Payment: POST /charge
traceparent: abc123-0002 Note over Payment: Creates child span
spanId: 0004, parent: 0002 Payment-->>Order: 200 OK (380ms) Order->>Notify: POST /notify
traceparent: abc123-0002 Note over Notify: Creates child span
spanId: 0005, parent: 0002 Notify-->>Order: 200 OK (11,900ms ⚠️) Order-->>Gateway: 201 Created Gateway-->>Client: 201 Created (12,343ms total)

Implementation Guide: Node.js SDK from Scratch

Let's instrument a real Node.js Express service. We will cover both auto-instrumentation (zero-touch) and manual spans (for business logic).

Step 1: Install Dependencies

npm install \
  @opentelemetry/sdk-node \
  @opentelemetry/auto-instrumentations-node \
  @opentelemetry/exporter-trace-otlp-http \
  @opentelemetry/exporter-metrics-otlp-http \
  @opentelemetry/sdk-metrics \
  @opentelemetry/resources \
  @opentelemetry/semantic-conventions

Step 2: Create the Instrumentation Bootstrap File

This file must be required before any other module. It sets up the OTel SDK, registers auto-instrumentation, and configures exporters.

// instrumentation.js
'use strict';

const { NodeSDK } = require('@opentelemetry/sdk-node');
const { getNodeAutoInstrumentations } = require('@opentelemetry/auto-instrumentations-node');
const { OTLPTraceExporter } = require('@opentelemetry/exporter-trace-otlp-http');
const { OTLPMetricExporter } = require('@opentelemetry/exporter-metrics-otlp-http');
const { PeriodicExportingMetricReader } = require('@opentelemetry/sdk-metrics');
const { Resource } = require('@opentelemetry/resources');
const { ATTR_SERVICE_NAME, ATTR_SERVICE_VERSION } = require('@opentelemetry/semantic-conventions');

// Define the resource — this metadata appears on every span and metric
const resource = new Resource({
  [ATTR_SERVICE_NAME]: process.env.OTEL_SERVICE_NAME || 'order-service',
  [ATTR_SERVICE_VERSION]: process.env.npm_package_version || '1.0.0',
  'deployment.environment': process.env.NODE_ENV || 'production',
  'host.name': require('os').hostname(),
});

// OTLP exporter pointing at the local OTel Collector
// In production, the Collector runs as a sidecar or DaemonSet
const traceExporter = new OTLPTraceExporter({
  url: process.env.OTEL_EXPORTER_OTLP_ENDPOINT || 'http://localhost:4318/v1/traces',
  headers: {},
});

const metricExporter = new OTLPMetricExporter({
  url: process.env.OTEL_EXPORTER_OTLP_ENDPOINT || 'http://localhost:4318/v1/metrics',
});

const sdk = new NodeSDK({
  resource,
  traceExporter,
  metricReader: new PeriodicExportingMetricReader({
    exporter: metricExporter,
    exportIntervalMillis: 15_000, // push metrics every 15 seconds
  }),
  instrumentations: [
    getNodeAutoInstrumentations({
      // Auto-instrument HTTP, Express, pg, Redis, gRPC, etc.
      '@opentelemetry/instrumentation-http': {
        // Ignore health check endpoints to reduce noise
        ignoreIncomingRequestHook: (req) => req.url === '/health',
        // Capture request/response bodies (careful with PII)
        requestHook: (span, request) => {
          span.setAttribute('http.request.body.size', request.headers['content-length'] || 0);
        },
      },
      '@opentelemetry/instrumentation-express': { enabled: true },
      '@opentelemetry/instrumentation-pg': {
        // Capture full SQL statements in dev; redact in prod
        dbStatementSerializer: (operation, query) => {
          return process.env.NODE_ENV === 'development' ? query.text : operation;
        },
      },
    }),
  ],
});

// Start the SDK — this must complete before any instrumented code runs
sdk.start();

// Graceful shutdown: flush pending spans before process exits
process.on('SIGTERM', () => {
  sdk.shutdown()
    .then(() => console.log('OTel SDK shut down successfully'))
    .catch((err) => console.error('Error shutting down OTel SDK', err))
    .finally(() => process.exit(0));
});

module.exports = sdk;

Start your app with:

node --require ./instrumentation.js src/server.js

Or set NODE_OPTIONS=--require ./instrumentation.js in your environment and the bootstrap loads automatically for every process, including workers.

Step 3: Manual Spans for Business Logic

Auto-instrumentation captures HTTP and DB calls automatically. But your business logic — pricing calculations, fraud checks, inventory allocation — is invisible to it. Use the tracing API to add manual spans.

// src/services/orderService.js
const { trace, context, SpanStatusCode } = require('@opentelemetry/api');

// Get a tracer bound to this module — use your service name as the scope
const tracer = trace.getTracer('order-service', '1.0.0');

async function createOrder(cartId, userId, paymentMethod) {
  // Start a parent span for the entire createOrder operation
  return tracer.startActiveSpan('order.create', async (orderSpan) => {
    try {
      // Tag the span with business-relevant attributes
      orderSpan.setAttributes({
        'order.cart_id': cartId,
        'order.user_id': userId,
        'order.payment_method': paymentMethod,
      });

      // Child span: validate cart
      const cart = await tracer.startActiveSpan('order.validate_cart', async (span) => {
        try {
          const result = await validateCart(cartId, userId);
          span.setAttribute('order.item_count', result.items.length);
          span.setAttribute('order.subtotal_cents', result.subtotalCents);
          return result;
        } catch (err) {
          span.recordException(err);
          span.setStatus({ code: SpanStatusCode.ERROR, message: err.message });
          throw err;
        } finally {
          span.end(); // Always end spans — even on error
        }
      });

      // Child span: reserve inventory (calls inventory-service)
      const reservation = await tracer.startActiveSpan('order.reserve_inventory', async (span) => {
        try {
          span.setAttribute('inventory.sku_count', cart.items.length);
          const result = await inventoryClient.reserve(cart.items);
          span.setAttribute('inventory.reservation_id', result.reservationId);
          return result;
        } catch (err) {
          span.recordException(err);
          span.setStatus({ code: SpanStatusCode.ERROR, message: err.message });
          throw err;
        } finally {
          span.end();
        }
      });

      // Add a timestamped event — useful for marking key moments mid-span
      orderSpan.addEvent('inventory_reserved', {
        'reservation.id': reservation.reservationId,
        'reservation.expires_at': reservation.expiresAt,
      });

      // Child span: charge payment
      const charge = await tracer.startActiveSpan('order.charge_payment', async (span) => {
        try {
          span.setAttribute('payment.provider', paymentMethod.provider);
          span.setAttribute('payment.amount_cents', cart.subtotalCents);
          const result = await paymentClient.charge({
            amount: cart.subtotalCents,
            currency: 'USD',
            method: paymentMethod,
          });
          span.setAttribute('payment.transaction_id', result.transactionId);
          span.setAttribute('payment.status', result.status);
          return result;
        } catch (err) {
          span.recordException(err);
          span.setStatus({ code: SpanStatusCode.ERROR, message: err.message });
          throw err;
        } finally {
          span.end();
        }
      });

      // Persist order to DB (auto-instrumented by @opentelemetry/instrumentation-pg)
      const order = await db.query(
        'INSERT INTO orders (cart_id, user_id, charge_id, status) VALUES ($1, $2, $3, $4) RETURNING id',
        [cartId, userId, charge.transactionId, 'confirmed']
      );

      orderSpan.setAttribute('order.id', order.rows[0].id);
      orderSpan.setStatus({ code: SpanStatusCode.OK });

      return order.rows[0];
    } catch (err) {
      orderSpan.recordException(err);
      orderSpan.setStatus({ code: SpanStatusCode.ERROR, message: err.message });
      throw err;
    } finally {
      orderSpan.end();
    }
  });
}

module.exports = { createOrder };

Step 4: Custom Metrics

// src/metrics/orderMetrics.js
const { metrics } = require('@opentelemetry/api');

const meter = metrics.getMeter('order-service', '1.0.0');

// Counter: total orders attempted
const ordersAttempted = meter.createCounter('orders.attempted', {
  description: 'Total number of order creation attempts',
  unit: '{orders}',
});

// Counter: total orders confirmed
const ordersConfirmed = meter.createCounter('orders.confirmed', {
  description: 'Total number of successfully confirmed orders',
  unit: '{orders}',
});

// Histogram: order value distribution
const orderValueHistogram = meter.createHistogram('orders.value_cents', {
  description: 'Distribution of order values in cents',
  unit: 'cents',
  advice: {
    // Define explicit bucket boundaries for meaningful percentile calculation
    explicitBucketBoundaries: [
      500, 1000, 2500, 5000, 10000, 25000, 50000, 100000, 250000,
    ],
  },
});

// UpDownCounter: active checkout sessions
const activeCheckouts = meter.createUpDownCounter('checkouts.active', {
  description: 'Number of checkout sessions currently in progress',
  unit: '{sessions}',
});

module.exports = {
  recordOrderAttempt: (attrs) => ordersAttempted.add(1, attrs),
  recordOrderConfirmed: (valueCents, attrs) => {
    ordersConfirmed.add(1, attrs);
    orderValueHistogram.record(valueCents, attrs);
  },
  incrementActiveCheckouts: () => activeCheckouts.add(1),
  decrementActiveCheckouts: () => activeCheckouts.add(-1),
};

Step 5: Correlate Logs to Traces

With pino as your logger:

// src/logger.js
const pino = require('pino');
const { trace, context } = require('@opentelemetry/api');

// Custom pino serializer that injects trace context into every log line
const logger = pino({
  level: process.env.LOG_LEVEL || 'info',
  formatters: {
    log(object) {
      const span = trace.getActiveSpan();
      if (span) {
        const ctx = span.spanContext();
        object.traceId = ctx.traceId;
        object.spanId = ctx.spanId;
        object.traceFlags = ctx.traceFlags;
      }
      return object;
    },
  },
});

module.exports = logger;

Now every log line emitted while a span is active automatically carries traceId and spanId. In Grafana Loki, you can jump from a log line directly to the corresponding Tempo trace with a single click.


Mermaid Diagram 2: Sampling Strategy Decision Flow

Sampling determines which traces are recorded and which are dropped. Getting this wrong is expensive: too much sampling overwhelms your backend; too little and you miss the rare critical errors.

flowchart TD A([New incoming request]) --> B{Is traceId present\nin incoming headers?} B -- Yes --> C{What did upstream decide?} B -- No --> D{What is our\nsampling policy?} C -- Sampled=1 --> E[Accept: honor upstream decision\nParentBased sampler] C -- Sampled=0 --> F[Drop: honor upstream decision\nParentBased sampler] D -- Always On --> G[Sample 100% of traces\n⚠️ Dev/staging only] D -- TraceIdRatio --> H{Random value ≤ ratio?} D -- Tail-Based --> I[Record all spans in memory\nDecide at trace completion] H -- Yes --> J[Sample this trace] H -- No --> K[Drop this trace] I --> L{Did trace contain\nan error or slow span?} L -- Yes --> M[Flush to backend\n100% of error traces kept] L -- No --> N{Random roll ≤ base rate?} N -- Yes --> O[Flush to backend] N -- No --> P[Drop from memory] E --> Q[Create child span\nwith sampled flag] J --> Q M --> R[Export complete trace] O --> R style G fill:#ff9999,color:#000 style M fill:#99ff99,color:#000 style O fill:#99ff99,color:#000 style F fill:#cccccc,color:#000 style K fill:#cccccc,color:#000 style P fill:#cccccc,color:#000

Sampling Strategy Guide

Always-On Sampling captures 100% of traces. Never use this in production — at 1,000 req/s, you are exporting millions of spans per hour. Reserve it for local development and integration test environments.

TraceIdRatio Sampling (head-based probabilistic) makes a sampling decision at the root span based on a hash of the traceId. A ratio of 0.1 samples 10% of traces. This is statistically fair and requires no memory overhead, but it has a critical flaw: a rare 500-ms slow query that only happens 0.1% of the time will only appear in your samples 0.01% of the time — often never.

Tail-Based Sampling (handled by the OTel Collector) buffers spans in memory and makes the sampling decision after the trace completes. This lets you apply rules like "always keep traces with errors" or "always keep traces over 2 seconds" while still dropping fast, successful traces at a configurable rate. This is the production gold standard for high-traffic services.

Configure tail-based sampling in the OTel Collector:

# collector-config.yaml (relevant section)
processors:
  tail_sampling:
    decision_wait: 10s          # Wait up to 10s for all spans to arrive
    num_traces: 50000           # Max traces held in memory at once
    expected_new_traces_per_sec: 1000
    policies:
      - name: keep-errors
        type: status_code
        status_code: { status_codes: [ERROR] }

      - name: keep-slow-traces
        type: latency
        latency: { threshold_ms: 2000 }

      - name: probabilistic-baseline
        type: probabilistic
        probabilistic: { sampling_percentage: 5 }  # 5% of remaining traces

Comparison & Tradeoffs: OpenTelemetry vs. the Alternatives

Tracing vs Logging vs Metrics
Dimension OpenTelemetry Vendor SDK (Datadog, Dynatrace) Custom Logging Only
Vendor lock-in None — swap backends via config High — proprietary format None
Auto-instrumentation Yes — broad framework coverage Yes — often broader No
Context propagation W3C standard Proprietary + W3C Manual correlation IDs
Setup complexity Medium Low (auto-agent) Low
Backend flexibility Any OTLP-compatible backend Vendor only Any log aggregator
Community CNCF, massive OSS community Vendor-driven N/A
Sampling Head + Tail-based (Collector) Head-based (agent) N/A
Cost at scale Depends on backend Typically $$$ Cheaper (logs only)
Trace-log correlation Native via bridge API Native Manual
Overhead ~2-5% CPU, ~10-20MB RAM ~3-8% CPU, ~50-100MB RAM ~0.5-1% CPU

The vendor SDK argument in 2026 is narrower than it used to be. Datadog, Dynatrace, and New Relic all have OTLP ingest endpoints now. You can instrument with OpenTelemetry and export to Datadog — getting vendor support without vendor lock-in. The only reason to reach for a vendor SDK directly today is if you need a feature that has no OTel equivalent (some Datadog APM features around code-level profiling still have an edge).

Custom logging alone remains a viable choice for simple, single-service architectures. The moment you have two services calling each other, the inability to follow a request across service boundaries becomes a significant operational liability.


Mermaid Diagram 3: OTel Collector Architecture

The OTel Collector is the production backbone of any OTel deployment. It decouples your application from its observability backends, handles batching, compression, retry, and fan-out, and is where tail-based sampling runs.

flowchart LR subgraph Apps["Application Layer"] A1["order-service\n(Node.js OTel SDK)"] A2["payment-service\n(Python OTel SDK)"] A3["inventory-service\n(Go OTel SDK)"] end subgraph Collector["OTel Collector (sidecar / DaemonSet)"] direction TB R["Receivers\n• OTLP/HTTP :4318\n• OTLP/gRPC :4317\n• Prometheus scrape\n• Jaeger"] P["Processors\n• batch\n• memory_limiter\n• tail_sampling\n• resource detection\n• k8s attributes"] E["Exporters\n• OTLP → Tempo\n• Prometheus remote_write\n• Jaeger gRPC\n• Datadog OTLP\n• debug (dev)"] R --> P --> E end subgraph Backends["Observability Backends"] B1["Jaeger\n(trace storage + UI)"] B2["Grafana Tempo\n(trace storage)"] B3["Prometheus\n(metrics)"] B4["Grafana\n(dashboards + alerts)"] B5["Datadog\n(APM + logs)"] B3 --> B4 B2 --> B4 end A1 -- "OTLP/HTTP traces+metrics" --> R A2 -- "OTLP/gRPC traces" --> R A3 -- "OTLP/gRPC traces+metrics" --> R E -- "traces" --> B1 E -- "traces" --> B2 E -- "metrics" --> B3 E -- "traces+metrics" --> B5 style Collector fill:#e8f4f8,color:#000 style Apps fill:#f8f4e8,color:#000 style Backends fill:#f4f8e8,color:#000

Collector Configuration (Full Working Example)

# otel-collector-config.yaml
receivers:
  otlp:
    protocols:
      grpc:
        endpoint: 0.0.0.0:4317
      http:
        endpoint: 0.0.0.0:4318
        cors:
          allowed_origins: ["http://localhost:*"]

  # Scrape Prometheus metrics from services that expose /metrics
  prometheus:
    config:
      scrape_configs:
        - job_name: 'order-service'
          static_configs:
            - targets: ['order-service:9464']

processors:
  # Hard memory cap — drops data before the collector OOMs
  memory_limiter:
    check_interval: 1s
    limit_mib: 512
    spike_limit_mib: 128

  # Batch spans before exporting — critical for throughput
  batch:
    send_batch_size: 1000
    timeout: 5s
    send_batch_max_size: 2000

  # Add Kubernetes pod metadata to every span
  k8sattributes:
    auth_type: "serviceAccount"
    passthrough: false
    extract:
      metadata:
        - k8s.namespace.name
        - k8s.pod.name
        - k8s.pod.uid
        - k8s.node.name
        - k8s.deployment.name

  # Tail-based sampling (see Sampling section above)
  tail_sampling:
    decision_wait: 10s
    num_traces: 50000
    policies:
      - name: keep-errors
        type: status_code
        status_code: { status_codes: [ERROR] }
      - name: keep-slow-traces
        type: latency
        latency: { threshold_ms: 2000 }
      - name: probabilistic-5pct
        type: probabilistic
        probabilistic: { sampling_percentage: 5 }

exporters:
  # Export traces to Grafana Tempo
  otlp/tempo:
    endpoint: tempo:4317
    tls:
      insecure: true

  # Export traces to Jaeger
  jaeger:
    endpoint: jaeger:14250
    tls:
      insecure: true

  # Export metrics to Prometheus via remote_write
  prometheusremotewrite:
    endpoint: "http://prometheus:9090/api/v1/write"
    tls:
      insecure: true

  # Debug exporter — logs every span to stdout (dev only)
  debug:
    verbosity: detailed

service:
  pipelines:
    traces:
      receivers: [otlp]
      processors: [memory_limiter, k8sattributes, tail_sampling, batch]
      exporters: [otlp/tempo, jaeger]

    metrics:
      receivers: [otlp, prometheus]
      processors: [memory_limiter, batch]
      exporters: [prometheusremotewrite]

Production Considerations

Real-World Overhead

Performance concerns are the most common reason teams hesitate to adopt OTel. The numbers for Node.js at production load (2026 SDK versions):

Scenario CPU Overhead Memory Overhead Latency Added per Request
Auto-instrumentation only, 5% sampling ~1.5% ~18 MB ~0.2ms
Auto-instrumentation + manual spans, 5% sampling ~2.5% ~22 MB ~0.4ms
100% sampling (never do in prod) ~8-12% ~50-80 MB ~1-3ms
Collector (sidecar, 1k req/s) ~0.5 CPU core ~256 MB async, not in request path

The key insight: the Collector runs out-of-process. Your application never waits for spans to be exported — the SDK batches spans in memory, hands them off to the Collector asynchronously, and continues. The only synchronous cost is creating spans in-process, which is a few microseconds per span.

Kubernetes Deployment Pattern

In Kubernetes, deploy the OTel Collector as a DaemonSet (one Collector per node) for production. Use a sidecar only if you need per-pod tail sampling with strict memory isolation.

# otel-collector-daemonset.yaml (abbreviated)
apiVersion: apps/v1
kind: DaemonSet
metadata:
  name: otel-collector
  namespace: monitoring
spec:
  selector:
    matchLabels:
      app: otel-collector
  template:
    spec:
      containers:
        - name: otel-collector
          image: otel/opentelemetry-collector-contrib:0.100.0
          args: ["--config=/conf/collector-config.yaml"]
          resources:
            requests:
              cpu: "200m"
              memory: "256Mi"
            limits:
              cpu: "1000m"
              memory: "512Mi"
          ports:
            - containerPort: 4317   # gRPC
            - containerPort: 4318   # HTTP
          volumeMounts:
            - name: config
              mountPath: /conf
      volumes:
        - name: config
          configMap:
            name: otel-collector-config

Configure your services to send to $(NODE_NAME) (the Kubernetes node's hostname) via the Downward API, ensuring each pod's telemetry hits its local Collector:

env:
  - name: NODE_NAME
    valueFrom:
      fieldRef:
        fieldPath: spec.nodeName
  - name: OTEL_EXPORTER_OTLP_ENDPOINT
    value: "http://$(NODE_NAME):4318"

Common Production Pitfalls

Cardinality explosion on metrics. Every unique combination of attribute values creates a new time series in Prometheus. Never use high-cardinality values like userId, orderId, or requestId as metric attributes. Use them on spans instead, where each span is a document, not a time series.

Missing span ends. Every startSpan must have a corresponding end(). Missed end() calls keep spans in memory indefinitely. Use startActiveSpan with async callbacks (as shown in the code examples above) — the SDK handles cleanup automatically in the callback pattern.

W3C propagation mismatches. If one service uses B3 headers (older Zipkin standard) and another uses W3C traceparent, traces will break at that boundary. Audit your entire stack for propagator consistency. OTel defaults to W3C; configure OTEL_PROPAGATORS=tracecontext,baggage explicitly on every service.

Sampling inconsistency. If Service A samples at 5% head-based and Service B samples at 10%, you will have orphaned child spans in Service B that have no root span in your backend. Always use ParentBased sampling for all services downstream of your entry point, so the sampling decision made at the edge propagates through the entire call tree.

Ignoring the baggage API. OTel Baggage propagates arbitrary key-value pairs across service boundaries via HTTP headers, scoped to a trace. Use it to carry business context (like tenant.id or experiment.variant) without adding it to every DB call's SQL query. Many teams discover Baggage late and wish they had adopted it from day one.


Conclusion

OpenTelemetry in 2026 is no longer a bet on an emerging standard — it is the standard. The ecosystem has matured to the point where adopting OTel is the lowest-friction path to production-grade observability, regardless of which backend you use today or plan to use tomorrow.

The practical path forward from this guide:

  1. Start with auto-instrumentation. One --require ./instrumentation.js flag gives you HTTP, Express, database, and Redis tracing with zero code changes. Ship this to staging and watch the waterfall diagrams appear.

  2. Add manual spans for business logic. Identify your most critical code paths — checkout, payment, auth — and wrap them in named spans with business-relevant attributes. This is where OTel pays dividends in incident response.

  3. Deploy the OTel Collector. Even if you are sending to a single backend today, route through the Collector. It gives you tail-based sampling, batching, and the ability to add a new backend without touching application code.

  4. Configure tail-based sampling. Set your baseline at 5-10% and always-keep rules for errors and slow traces. This typically gives you 95%+ of actionable signals at 10-15% of the cost.

  5. Correlate your logs. Add the OTel log bridge to your existing logger. The ability to jump from a Grafana log line to the full trace that produced it is worth an afternoon of setup.

  6. Build dashboards around RED metrics. Rate, Errors, Duration — the three metrics that matter most for every service. OTel's histogram instruments give you the p50/p95/p99 latency buckets Prometheus needs for accurate SLO tracking.

Distributed tracing is no longer a luxury for teams at Netflix scale. It is table stakes for any team running more than two services in production. OpenTelemetry makes it accessible, vendor-neutral, and — with the right sampling strategy — affordable at any scale.


This post is part of the AmtocSoft observability series. Next up: Building SLO dashboards in Grafana with OTel-sourced metrics and error budgets.


Sources

About the Author

Toc Am

Founder of AmtocSoft. Writing practical deep-dives on AI engineering, cloud architecture, and developer tooling. Previously built backend systems at scale. Reviews every post published under this byline.

LinkedIn X / Twitter

Published: 2026-04-14 · Written with AI assistance, reviewed by Toc Am.

Get These In Your Inbox

Weekly deep-dives on AI engineering, no fluff. Join the newsletter →

Subscribe (free)

Or grab the book ($39, ~100 pages) · Buy me a coffee

Buy Me a Coffee · 🔔 YouTube · 💼 LinkedIn · 🐦 X/Twitter
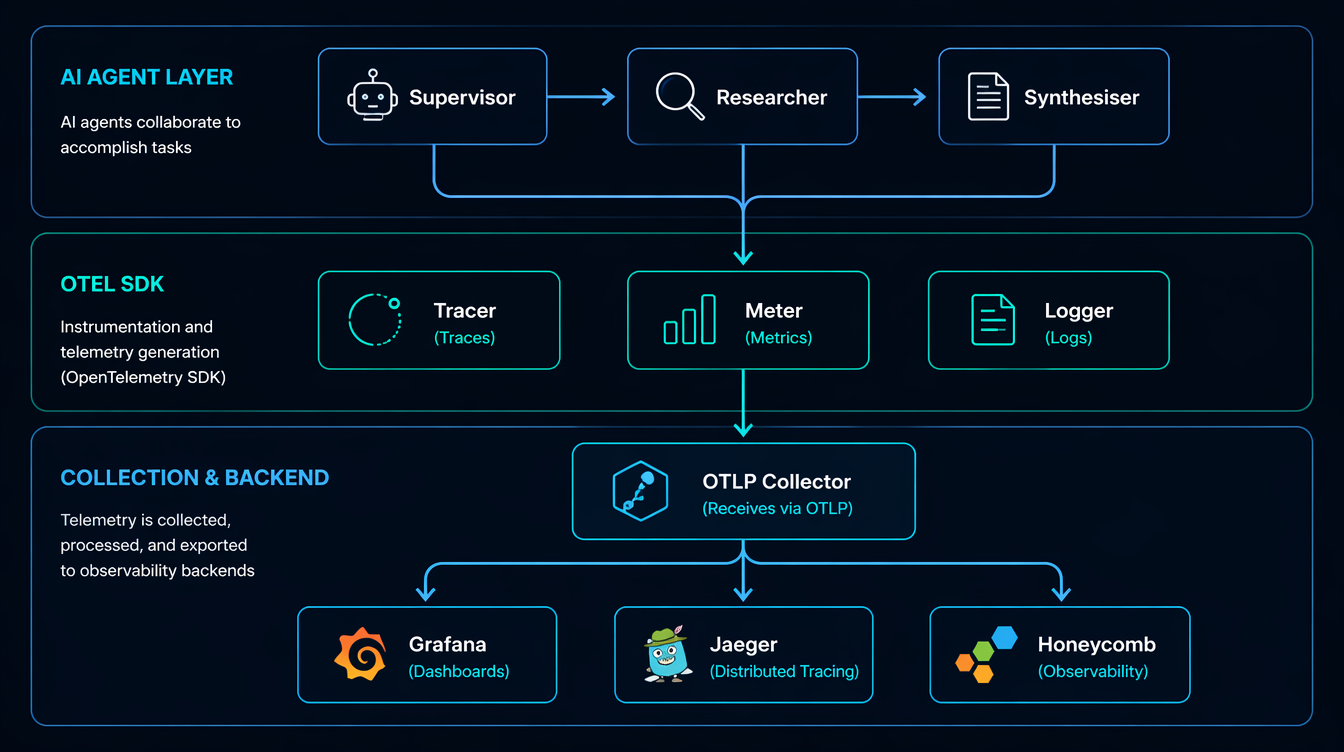
Bigger Is Not the Same as Better. The Job That Moved Is the Phone, Not the Lab.

Bigger is a plan. The phone is the receipt. The brief for this cycle is a question: does bigger always mean better in AI? The 2026 answer i...