Introduction
Modern software does not live in a single process. A single user request might touch an API gateway, a handful of microservices, a message queue, a caching layer, and three different databases before a response makes it back to the browser. When something goes wrong — a timeout, a spike in p99 latency, an unexplained 500 — the question engineers dread most is: where, exactly, did it break?
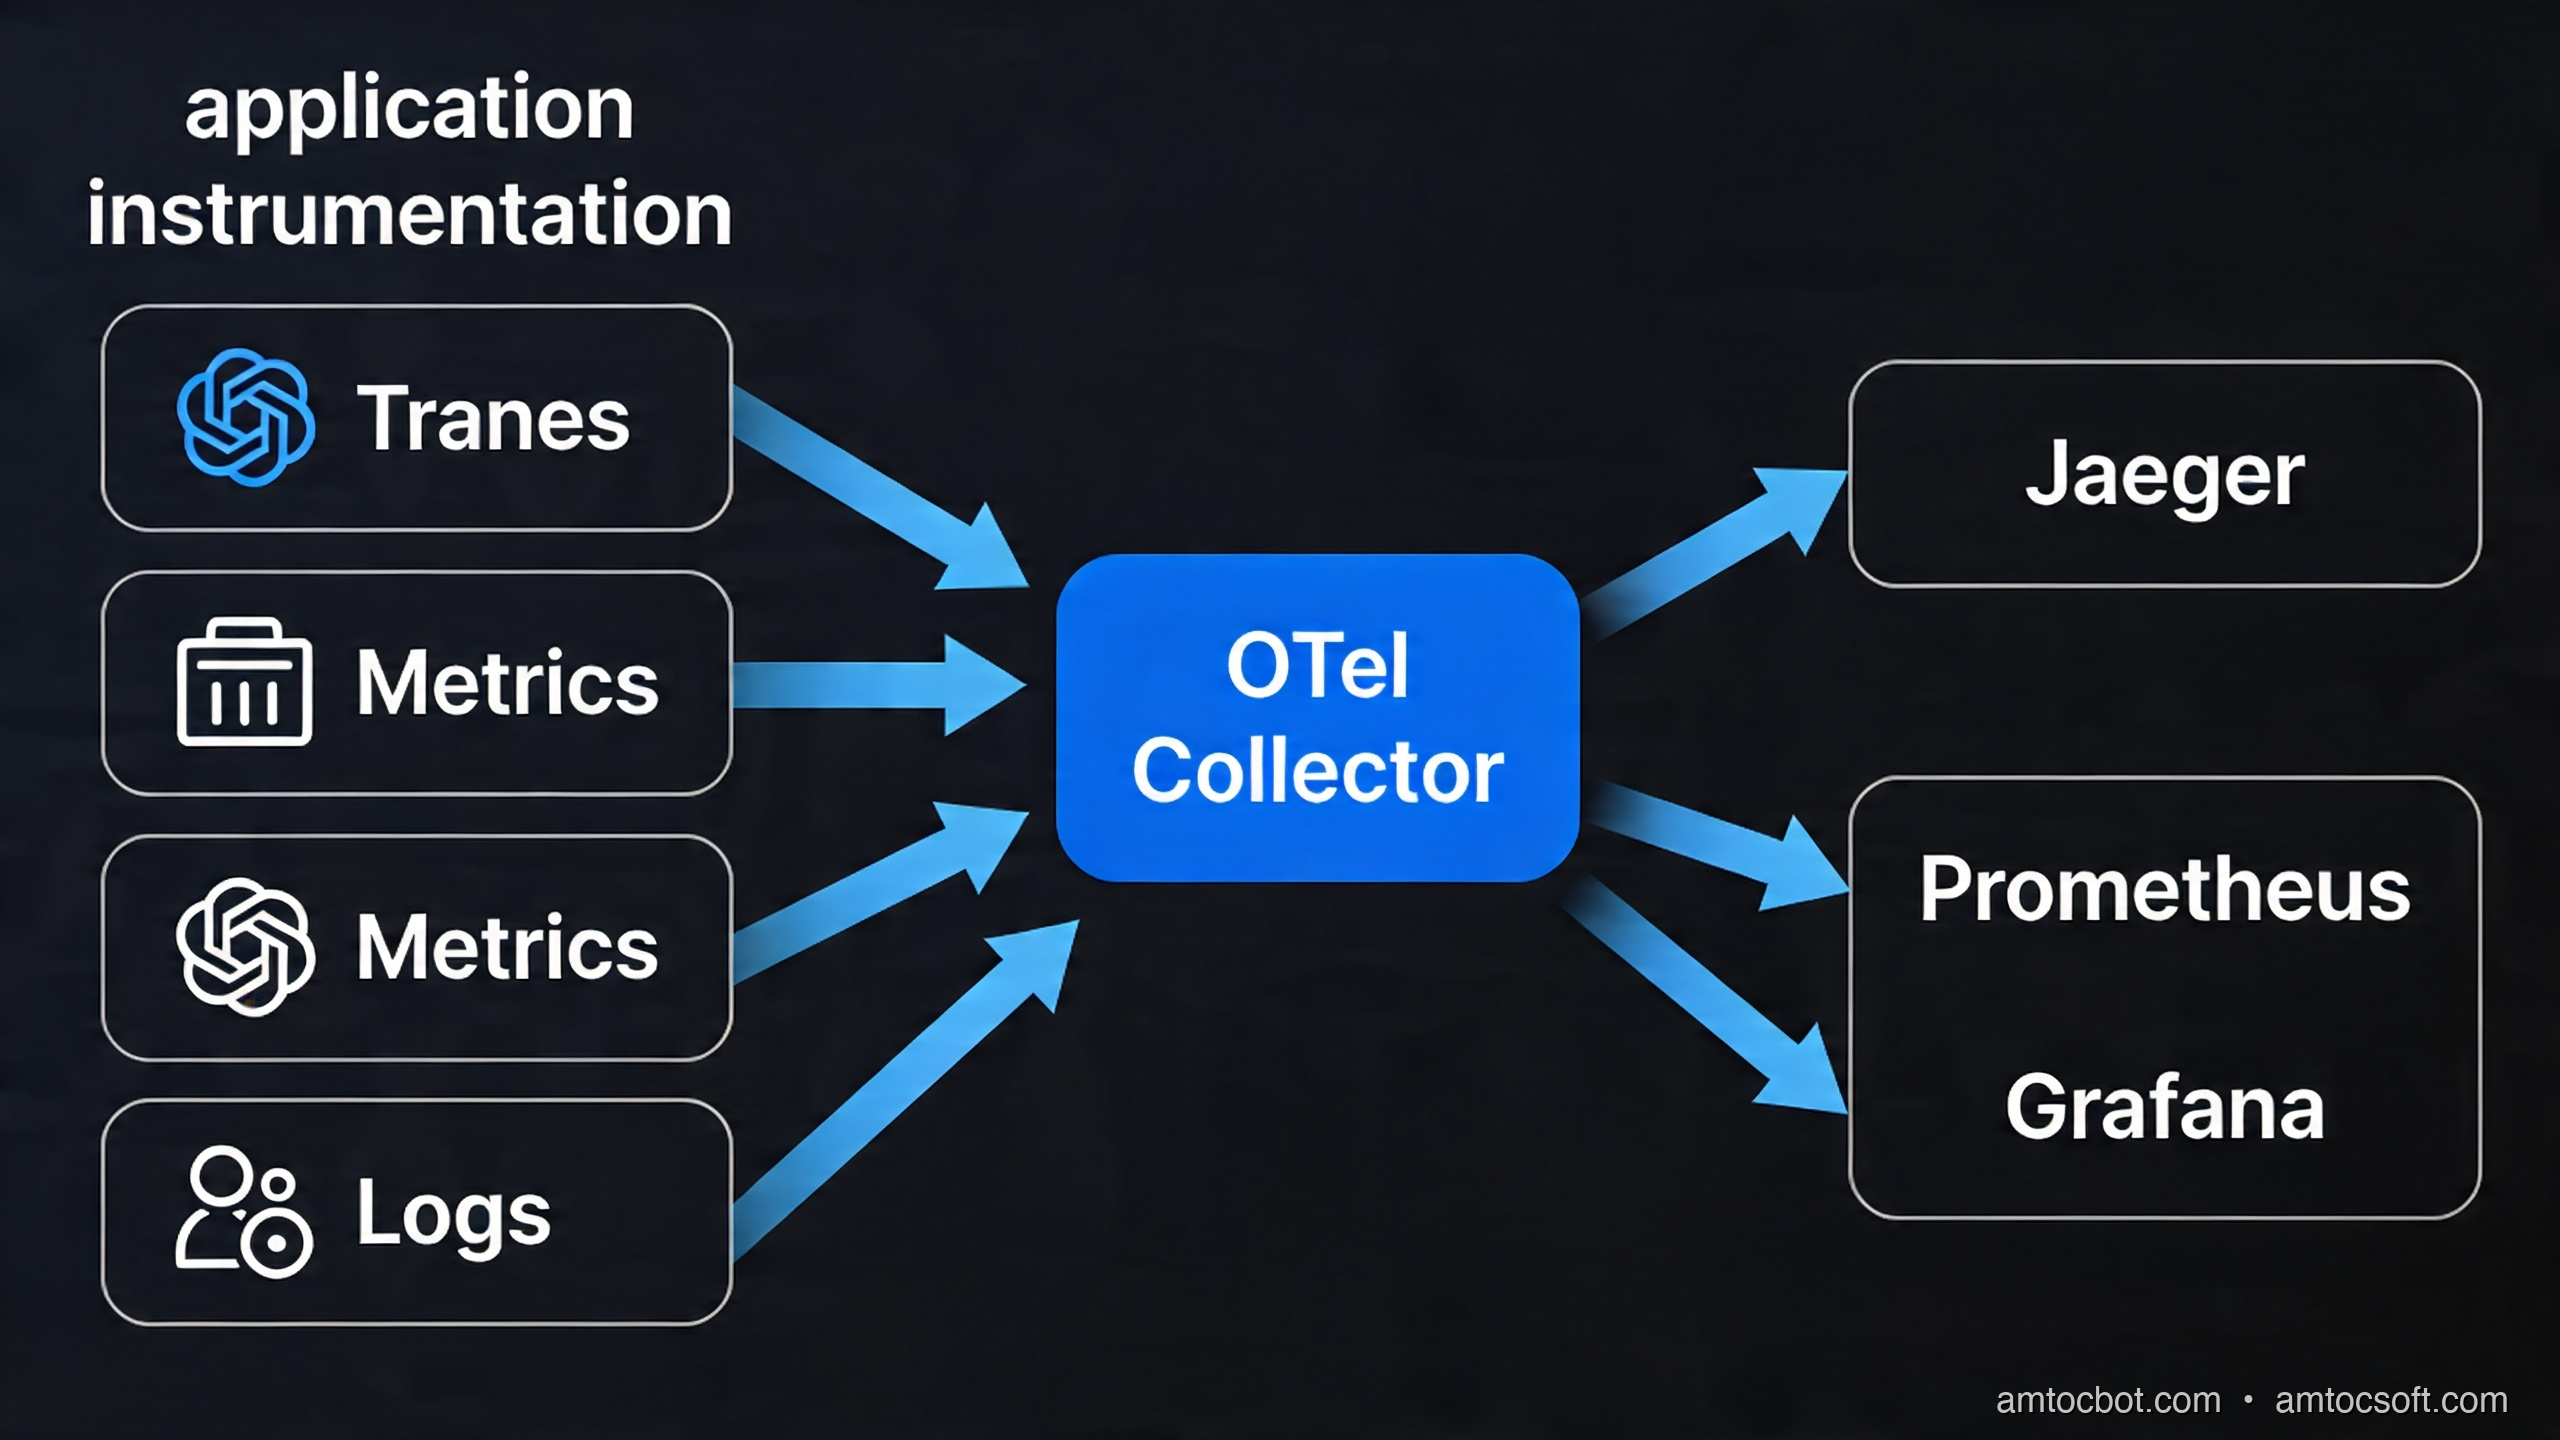
This is the fundamental challenge of distributed observability, and in 2026 there is one answer the industry has converged on: OpenTelemetry (OTel). OpenTelemetry is the CNCF (Cloud Native Computing Foundation) project that defines a vendor-neutral standard for collecting, processing, and exporting telemetry data — traces, metrics, and logs — from distributed systems. It is not an observability backend. It is the pipeline that feeds every backend, from Jaeger to Datadog to Grafana Tempo.
What makes OpenTelemetry the right bet in 2026? Two things: ubiquity and stability. OTel's tracing and metrics specs are now fully stable (1.x). Its logging bridge is production-ready. The SDK has first-class support in Node.js, Python, Java, Go, .NET, Ruby, and Rust. Auto-instrumentation covers every major framework with zero code changes. And because OTel is vendor-neutral, you are never locked in — you can ship traces to Jaeger today and Datadog tomorrow by changing four lines of config.
This guide is a complete, practical walkthrough. By the end, you will understand the three pillars of observability through the OTel lens, how to instrument a real Node.js service from scratch, how to configure the OTel Collector as a telemetry router, how to choose a sampling strategy for production, and what the real overhead numbers look like. Every code example is production-grade and annotated.
The Problem: Why Logs Alone Are Not Enough
Before OpenTelemetry, the standard debugging toolkit was logs. Add a console.log here, a structured JSON log there, ship everything to Splunk or Elasticsearch, and grep your way to the answer. For monoliths, this works. For distributed systems, it breaks down fast.
Consider a checkout flow that spans five services: api-gateway, order-service, inventory-service, payment-service, and notification-service. A user reports their order hung for 12 seconds before timing out. Your logs tell you:
api-gateway: received request at10:42:31.003, sent response at10:42:43.101— duration 12.1 secondsorder-service: processed order creation in 41mspayment-service: called Stripe, got 200, took 380msinventory-service: reserved stock in 22msnotification-service: ... no log at all
Which service caused the 12-second hang? You cannot tell from logs alone. Logs are isolated events. They have no built-in concept of causality, no way to link a log line in payment-service to the exact request that triggered it from api-gateway, no way to visualize the sequence of calls in a single request's lifetime.
What you need is a trace.
A trace is a directed acyclic graph of spans — each span representing one unit of work (an HTTP call, a DB query, a cache lookup) with a start time, duration, attributes, and a pointer to its parent span. Every span in a trace shares a traceId. When you query a trace, you see the entire request lifecycle across every service, laid out on a waterfall timeline. The 12-second hang becomes visible as a 12-second gap between the order-service calling notification-service and notification-service acknowledging it — probably a misconfigured timeout on a downstream email provider.
This is what OpenTelemetry gives you, and it gives you metrics and structured logs that are correlated to those traces via shared context IDs.
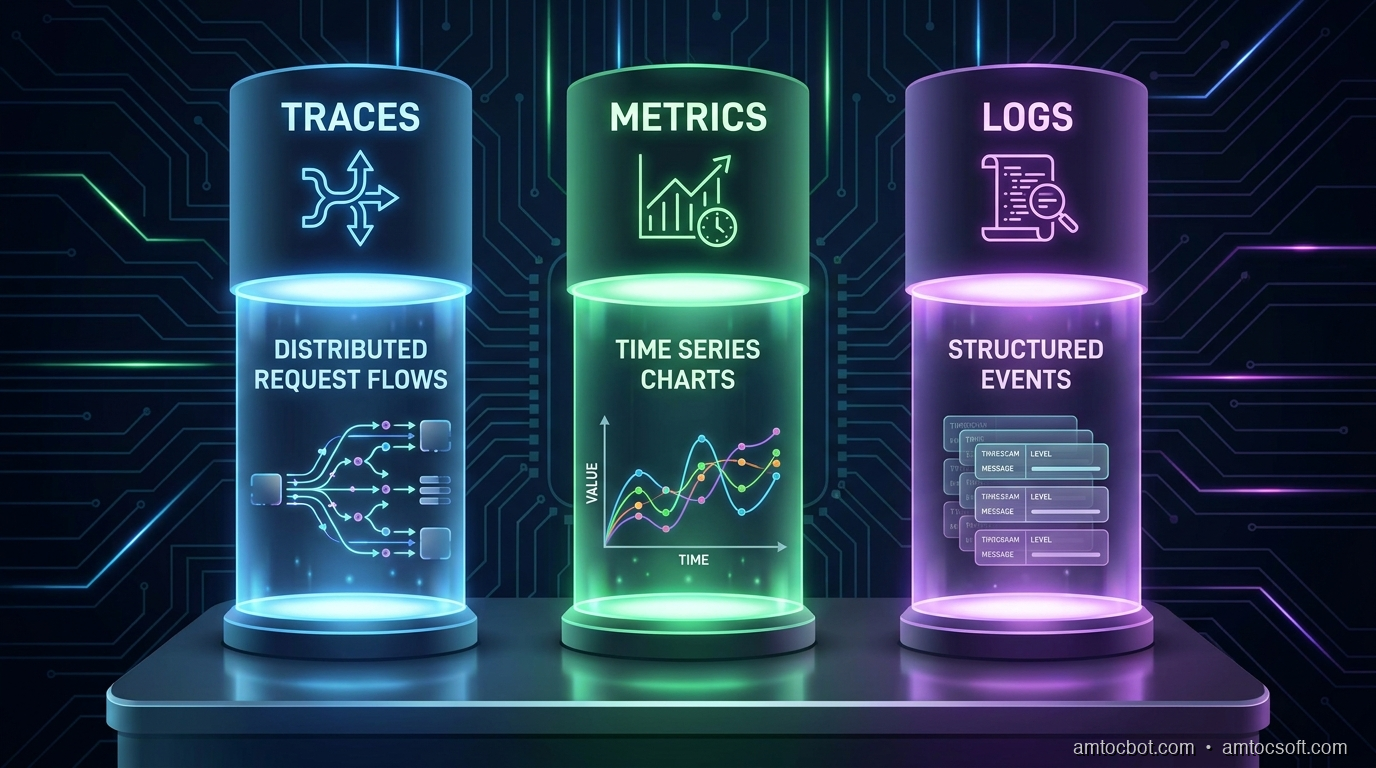
How OpenTelemetry Works: The Three Pillars
OpenTelemetry formalizes observability into three signal types, and the SDK handles all three through a unified API.
Traces
A trace is a collection of spans that together represent the life of a request. The first span created is the root span. Every subsequent operation — an outbound HTTP call, a database query — creates a child span that references the root's spanId as its parentSpanId. This parent-child relationship forms the waterfall.
Spans carry:
- traceId — 128-bit identifier, shared by all spans in the trace
- spanId — 64-bit identifier, unique to this span
- parentSpanId — the spanId of the caller (absent on the root span)
- name — human-readable operation name (e.g., POST /orders)
- startTime / endTime — high-resolution timestamps
- attributes — key-value metadata (e.g., http.method, db.statement)
- events — timestamped annotations within a span (e.g., cache miss, retry)
- status — OK, ERROR, or UNSET
- links — references to spans in other traces (useful for async messaging)
Context propagation is how the trace crosses service boundaries. When order-service calls inventory-service, it injects the current trace context into the outgoing HTTP headers using the W3C Trace Context standard (traceparent and tracestate headers). The receiving service extracts those headers, resumes the same trace, and creates a child span under the caller's spanId.
Metrics
OTel metrics are aggregated measurements — counters, histograms, gauges — with a defined data model that maps cleanly to Prometheus and OTLP. Unlike traces (sampled), metrics are typically collected for every event and aggregated at the SDK or Collector level before export.
OTel defines these metric instruments:
- Counter — monotonically increasing (requests served, bytes written)
- UpDownCounter — can increase or decrease (active connections, queue depth)
- Histogram — distribution of values (request latency, payload size)
- Gauge — instantaneous measurement (CPU usage, memory)
- ObservableCounter / ObservableGauge — polled, not pushed
Logs
The OTel Logs Bridge API is not a replacement for your logging library. It is a bridge: you keep using winston or pino, configure OTel's log appender, and logs get correlated to the active trace via injected traceId and spanId fields. This is the key insight — structured logs become queryable in the same backend as your traces.
Mermaid Diagram 1: Distributed Trace Propagation
The following diagram shows how a single user request propagates as a trace through a microservices architecture. Each box is a span; arrows show parent-child relationships and the flow of the traceparent header.
(root span) participant Order as Order Service
(child span A) participant Inventory as Inventory Service
(child span B) participant Payment as Payment Service
(child span C) participant Notify as Notification Service
(child span D) Client->>Gateway: POST /checkout
No traceparent header Note over Gateway: Creates root span
traceId: abc123
spanId: 0001 Gateway->>Order: POST /orders
traceparent: abc123-0001 Note over Order: Creates child span
spanId: 0002, parent: 0001 Order->>Inventory: GET /stock/:sku
traceparent: abc123-0002 Note over Inventory: Creates child span
spanId: 0003, parent: 0002 Inventory-->>Order: 200 OK (22ms) Order->>Payment: POST /charge
traceparent: abc123-0002 Note over Payment: Creates child span
spanId: 0004, parent: 0002 Payment-->>Order: 200 OK (380ms) Order->>Notify: POST /notify
traceparent: abc123-0002 Note over Notify: Creates child span
spanId: 0005, parent: 0002 Notify-->>Order: 200 OK (11,900ms ⚠️) Order-->>Gateway: 201 Created Gateway-->>Client: 201 Created (12,343ms total)
Implementation Guide: Node.js SDK from Scratch
Let's instrument a real Node.js Express service. We will cover both auto-instrumentation (zero-touch) and manual spans (for business logic).
Step 1: Install Dependencies
npm install \
  @opentelemetry/sdk-node \
  @opentelemetry/auto-instrumentations-node \
  @opentelemetry/exporter-trace-otlp-http \
  @opentelemetry/exporter-metrics-otlp-http \
  @opentelemetry/sdk-metrics \
  @opentelemetry/resources \
  @opentelemetry/semantic-conventions
Step 2: Create the Instrumentation Bootstrap File
This file must be required before any other module. It sets up the OTel SDK, registers auto-instrumentation, and configures exporters.
// instrumentation.js
'use strict';

const { NodeSDK } = require('@opentelemetry/sdk-node');
const { getNodeAutoInstrumentations } = require('@opentelemetry/auto-instrumentations-node');
const { OTLPTraceExporter } = require('@opentelemetry/exporter-trace-otlp-http');
const { OTLPMetricExporter } = require('@opentelemetry/exporter-metrics-otlp-http');
const { PeriodicExportingMetricReader } = require('@opentelemetry/sdk-metrics');
const { Resource } = require('@opentelemetry/resources');
const { ATTR_SERVICE_NAME, ATTR_SERVICE_VERSION } = require('@opentelemetry/semantic-conventions');

// Define the resource — this metadata appears on every span and metric
const resource = new Resource({
  [ATTR_SERVICE_NAME]: process.env.OTEL_SERVICE_NAME || 'order-service',
  [ATTR_SERVICE_VERSION]: process.env.npm_package_version || '1.0.0',
  'deployment.environment': process.env.NODE_ENV || 'production',
  'host.name': require('os').hostname(),
});

// OTLP exporter pointing at the local OTel Collector
// In production, the Collector runs as a sidecar or DaemonSet
const traceExporter = new OTLPTraceExporter({
  url: process.env.OTEL_EXPORTER_OTLP_ENDPOINT || 'http://localhost:4318/v1/traces',
  headers: {},
});

const metricExporter = new OTLPMetricExporter({
  url: process.env.OTEL_EXPORTER_OTLP_ENDPOINT || 'http://localhost:4318/v1/metrics',
});

const sdk = new NodeSDK({
  resource,
  traceExporter,
  metricReader: new PeriodicExportingMetricReader({
    exporter: metricExporter,
    exportIntervalMillis: 15_000, // push metrics every 15 seconds
  }),
  instrumentations: [
    getNodeAutoInstrumentations({
      // Auto-instrument HTTP, Express, pg, Redis, gRPC, etc.
      '@opentelemetry/instrumentation-http': {
        // Ignore health check endpoints to reduce noise
        ignoreIncomingRequestHook: (req) => req.url === '/health',
        // Capture request/response bodies (careful with PII)
        requestHook: (span, request) => {
          span.setAttribute('http.request.body.size', request.headers['content-length'] || 0);
        },
      },
      '@opentelemetry/instrumentation-express': { enabled: true },
      '@opentelemetry/instrumentation-pg': {
        // Capture full SQL statements in dev; redact in prod
        dbStatementSerializer: (operation, query) => {
          return process.env.NODE_ENV === 'development' ? query.text : operation;
        },
      },
    }),
  ],
});

// Start the SDK — this must complete before any instrumented code runs
sdk.start();

// Graceful shutdown: flush pending spans before process exits
process.on('SIGTERM', () => {
  sdk.shutdown()
    .then(() => console.log('OTel SDK shut down successfully'))
    .catch((err) => console.error('Error shutting down OTel SDK', err))
    .finally(() => process.exit(0));
});

module.exports = sdk;
Start your app with:
node --require ./instrumentation.js src/server.js
Or set NODE_OPTIONS=--require ./instrumentation.js in your environment and the bootstrap loads automatically for every process, including workers.
Step 3: Manual Spans for Business Logic
Auto-instrumentation captures HTTP and DB calls automatically. But your business logic — pricing calculations, fraud checks, inventory allocation — is invisible to it. Use the tracing API to add manual spans.
// src/services/orderService.js
const { trace, context, SpanStatusCode } = require('@opentelemetry/api');

// Get a tracer bound to this module — use your service name as the scope
const tracer = trace.getTracer('order-service', '1.0.0');

async function createOrder(cartId, userId, paymentMethod) {
  // Start a parent span for the entire createOrder operation
  return tracer.startActiveSpan('order.create', async (orderSpan) => {
    try {
      // Tag the span with business-relevant attributes
      orderSpan.setAttributes({
        'order.cart_id': cartId,
        'order.user_id': userId,
        'order.payment_method': paymentMethod,
      });

      // Child span: validate cart
      const cart = await tracer.startActiveSpan('order.validate_cart', async (span) => {
        try {
          const result = await validateCart(cartId, userId);
          span.setAttribute('order.item_count', result.items.length);
          span.setAttribute('order.subtotal_cents', result.subtotalCents);
          return result;
        } catch (err) {
          span.recordException(err);
          span.setStatus({ code: SpanStatusCode.ERROR, message: err.message });
          throw err;
        } finally {
          span.end(); // Always end spans — even on error
        }
      });

      // Child span: reserve inventory (calls inventory-service)
      const reservation = await tracer.startActiveSpan('order.reserve_inventory', async (span) => {
        try {
          span.setAttribute('inventory.sku_count', cart.items.length);
          const result = await inventoryClient.reserve(cart.items);
          span.setAttribute('inventory.reservation_id', result.reservationId);
          return result;
        } catch (err) {
          span.recordException(err);
          span.setStatus({ code: SpanStatusCode.ERROR, message: err.message });
          throw err;
        } finally {
          span.end();
        }
      });

      // Add a timestamped event — useful for marking key moments mid-span
      orderSpan.addEvent('inventory_reserved', {
        'reservation.id': reservation.reservationId,
        'reservation.expires_at': reservation.expiresAt,
      });

      // Child span: charge payment
      const charge = await tracer.startActiveSpan('order.charge_payment', async (span) => {
        try {
          span.setAttribute('payment.provider', paymentMethod.provider);
          span.setAttribute('payment.amount_cents', cart.subtotalCents);
          const result = await paymentClient.charge({
            amount: cart.subtotalCents,
            currency: 'USD',
            method: paymentMethod,
          });
          span.setAttribute('payment.transaction_id', result.transactionId);
          span.setAttribute('payment.status', result.status);
          return result;
        } catch (err) {
          span.recordException(err);
          span.setStatus({ code: SpanStatusCode.ERROR, message: err.message });
          throw err;
        } finally {
          span.end();
        }
      });

      // Persist order to DB (auto-instrumented by @opentelemetry/instrumentation-pg)
      const order = await db.query(
        'INSERT INTO orders (cart_id, user_id, charge_id, status) VALUES ($1, $2, $3, $4) RETURNING id',
        [cartId, userId, charge.transactionId, 'confirmed']
      );

      orderSpan.setAttribute('order.id', order.rows[0].id);
      orderSpan.setStatus({ code: SpanStatusCode.OK });

      return order.rows[0];
    } catch (err) {
      orderSpan.recordException(err);
      orderSpan.setStatus({ code: SpanStatusCode.ERROR, message: err.message });
      throw err;
    } finally {
      orderSpan.end();
    }
  });
}

module.exports = { createOrder };
Step 4: Custom Metrics
// src/metrics/orderMetrics.js
const { metrics } = require('@opentelemetry/api');

const meter = metrics.getMeter('order-service', '1.0.0');

// Counter: total orders attempted
const ordersAttempted = meter.createCounter('orders.attempted', {
  description: 'Total number of order creation attempts',
  unit: '{orders}',
});

// Counter: total orders confirmed
const ordersConfirmed = meter.createCounter('orders.confirmed', {
  description: 'Total number of successfully confirmed orders',
  unit: '{orders}',
});

// Histogram: order value distribution
const orderValueHistogram = meter.createHistogram('orders.value_cents', {
  description: 'Distribution of order values in cents',
  unit: 'cents',
  advice: {
    // Define explicit bucket boundaries for meaningful percentile calculation
    explicitBucketBoundaries: [
      500, 1000, 2500, 5000, 10000, 25000, 50000, 100000, 250000,
    ],
  },
});

// UpDownCounter: active checkout sessions
const activeCheckouts = meter.createUpDownCounter('checkouts.active', {
  description: 'Number of checkout sessions currently in progress',
  unit: '{sessions}',
});

module.exports = {
  recordOrderAttempt: (attrs) => ordersAttempted.add(1, attrs),
  recordOrderConfirmed: (valueCents, attrs) => {
    ordersConfirmed.add(1, attrs);
    orderValueHistogram.record(valueCents, attrs);
  },
  incrementActiveCheckouts: () => activeCheckouts.add(1),
  decrementActiveCheckouts: () => activeCheckouts.add(-1),
};
Step 5: Correlate Logs to Traces
With pino as your logger:
// src/logger.js
const pino = require('pino');
const { trace, context } = require('@opentelemetry/api');

// Custom pino serializer that injects trace context into every log line
const logger = pino({
  level: process.env.LOG_LEVEL || 'info',
  formatters: {
    log(object) {
      const span = trace.getActiveSpan();
      if (span) {
        const ctx = span.spanContext();
        object.traceId = ctx.traceId;
        object.spanId = ctx.spanId;
        object.traceFlags = ctx.traceFlags;
      }
      return object;
    },
  },
});

module.exports = logger;
Now every log line emitted while a span is active automatically carries traceId and spanId. In Grafana Loki, you can jump from a log line directly to the corresponding Tempo trace with a single click.
Mermaid Diagram 2: Sampling Strategy Decision Flow
Sampling determines which traces are recorded and which are dropped. Getting this wrong is expensive: too much sampling overwhelms your backend; too little and you miss the rare critical errors.
Sampling Strategy Guide
Always-On Sampling captures 100% of traces. Never use this in production — at 1,000 req/s, you are exporting millions of spans per hour. Reserve it for local development and integration test environments.
TraceIdRatio Sampling (head-based probabilistic) makes a sampling decision at the root span based on a hash of the traceId. A ratio of 0.1 samples 10% of traces. This is statistically fair and requires no memory overhead, but it has a critical flaw: a rare 500-ms slow query that only happens 0.1% of the time will only appear in your samples 0.01% of the time — often never.
Tail-Based Sampling (handled by the OTel Collector) buffers spans in memory and makes the sampling decision after the trace completes. This lets you apply rules like "always keep traces with errors" or "always keep traces over 2 seconds" while still dropping fast, successful traces at a configurable rate. This is the production gold standard for high-traffic services.
Configure tail-based sampling in the OTel Collector:
# collector-config.yaml (relevant section)
processors:
  tail_sampling:
    decision_wait: 10s          # Wait up to 10s for all spans to arrive
    num_traces: 50000           # Max traces held in memory at once
    expected_new_traces_per_sec: 1000
    policies:
      - name: keep-errors
        type: status_code
        status_code: { status_codes: [ERROR] }

      - name: keep-slow-traces
        type: latency
        latency: { threshold_ms: 2000 }

      - name: probabilistic-baseline
        type: probabilistic
        probabilistic: { sampling_percentage: 5 }  # 5% of remaining traces
Comparison & Tradeoffs: OpenTelemetry vs. the Alternatives
| Dimension | OpenTelemetry | Vendor SDK (Datadog, Dynatrace) | Custom Logging Only |
|---|---|---|---|
| Vendor lock-in | None — swap backends via config | High — proprietary format | None |
| Auto-instrumentation | Yes — broad framework coverage | Yes — often broader | No |
| Context propagation | W3C standard | Proprietary + W3C | Manual correlation IDs |
| Setup complexity | Medium | Low (auto-agent) | Low |
| Backend flexibility | Any OTLP-compatible backend | Vendor only | Any log aggregator |
| Community | CNCF, massive OSS community | Vendor-driven | N/A |
| Sampling | Head + Tail-based (Collector) | Head-based (agent) | N/A |
| Cost at scale | Depends on backend | Typically $$$ | Cheaper (logs only) |
| Trace-log correlation | Native via bridge API | Native | Manual |
| Overhead | ~2-5% CPU, ~10-20MB RAM | ~3-8% CPU, ~50-100MB RAM | ~0.5-1% CPU |
The vendor SDK argument in 2026 is narrower than it used to be. Datadog, Dynatrace, and New Relic all have OTLP ingest endpoints now. You can instrument with OpenTelemetry and export to Datadog — getting vendor support without vendor lock-in. The only reason to reach for a vendor SDK directly today is if you need a feature that has no OTel equivalent (some Datadog APM features around code-level profiling still have an edge).
Custom logging alone remains a viable choice for simple, single-service architectures. The moment you have two services calling each other, the inability to follow a request across service boundaries becomes a significant operational liability.
Mermaid Diagram 3: OTel Collector Architecture
The OTel Collector is the production backbone of any OTel deployment. It decouples your application from its observability backends, handles batching, compression, retry, and fan-out, and is where tail-based sampling runs.
Collector Configuration (Full Working Example)
# otel-collector-config.yaml
receivers:
  otlp:
    protocols:
      grpc:
        endpoint: 0.0.0.0:4317
      http:
        endpoint: 0.0.0.0:4318
        cors:
          allowed_origins: ["http://localhost:*"]

  # Scrape Prometheus metrics from services that expose /metrics
  prometheus:
    config:
      scrape_configs:
        - job_name: 'order-service'
          static_configs:
            - targets: ['order-service:9464']

processors:
  # Hard memory cap — drops data before the collector OOMs
  memory_limiter:
    check_interval: 1s
    limit_mib: 512
    spike_limit_mib: 128

  # Batch spans before exporting — critical for throughput
  batch:
    send_batch_size: 1000
    timeout: 5s
    send_batch_max_size: 2000

  # Add Kubernetes pod metadata to every span
  k8sattributes:
    auth_type: "serviceAccount"
    passthrough: false
    extract:
      metadata:
        - k8s.namespace.name
        - k8s.pod.name
        - k8s.pod.uid
        - k8s.node.name
        - k8s.deployment.name

  # Tail-based sampling (see Sampling section above)
  tail_sampling:
    decision_wait: 10s
    num_traces: 50000
    policies:
      - name: keep-errors
        type: status_code
        status_code: { status_codes: [ERROR] }
      - name: keep-slow-traces
        type: latency
        latency: { threshold_ms: 2000 }
      - name: probabilistic-5pct
        type: probabilistic
        probabilistic: { sampling_percentage: 5 }

exporters:
  # Export traces to Grafana Tempo
  otlp/tempo:
    endpoint: tempo:4317
    tls:
      insecure: true

  # Export traces to Jaeger
  jaeger:
    endpoint: jaeger:14250
    tls:
      insecure: true

  # Export metrics to Prometheus via remote_write
  prometheusremotewrite:
    endpoint: "http://prometheus:9090/api/v1/write"
    tls:
      insecure: true

  # Debug exporter — logs every span to stdout (dev only)
  debug:
    verbosity: detailed

service:
  pipelines:
    traces:
      receivers: [otlp]
      processors: [memory_limiter, k8sattributes, tail_sampling, batch]
      exporters: [otlp/tempo, jaeger]

    metrics:
      receivers: [otlp, prometheus]
      processors: [memory_limiter, batch]
      exporters: [prometheusremotewrite]
Production Considerations
Real-World Overhead
Performance concerns are the most common reason teams hesitate to adopt OTel. The numbers for Node.js at production load (2026 SDK versions):
| Scenario | CPU Overhead | Memory Overhead | Latency Added per Request |
|---|---|---|---|
| Auto-instrumentation only, 5% sampling | ~1.5% | ~18 MB | ~0.2ms |
| Auto-instrumentation + manual spans, 5% sampling | ~2.5% | ~22 MB | ~0.4ms |
| 100% sampling (never do in prod) | ~8-12% | ~50-80 MB | ~1-3ms |
| Collector (sidecar, 1k req/s) | ~0.5 CPU core | ~256 MB | async, not in request path |
The key insight: the Collector runs out-of-process. Your application never waits for spans to be exported — the SDK batches spans in memory, hands them off to the Collector asynchronously, and continues. The only synchronous cost is creating spans in-process, which is a few microseconds per span.
Kubernetes Deployment Pattern
In Kubernetes, deploy the OTel Collector as a DaemonSet (one Collector per node) for production. Use a sidecar only if you need per-pod tail sampling with strict memory isolation.
# otel-collector-daemonset.yaml (abbreviated)
apiVersion: apps/v1
kind: DaemonSet
metadata:
  name: otel-collector
  namespace: monitoring
spec:
  selector:
    matchLabels:
      app: otel-collector
  template:
    spec:
      containers:
        - name: otel-collector
          image: otel/opentelemetry-collector-contrib:0.100.0
          args: ["--config=/conf/collector-config.yaml"]
          resources:
            requests:
              cpu: "200m"
              memory: "256Mi"
            limits:
              cpu: "1000m"
              memory: "512Mi"
          ports:
            - containerPort: 4317   # gRPC
            - containerPort: 4318   # HTTP
          volumeMounts:
            - name: config
              mountPath: /conf
      volumes:
        - name: config
          configMap:
            name: otel-collector-config
Configure your services to send to $(NODE_NAME) (the Kubernetes node's hostname) via the Downward API, ensuring each pod's telemetry hits its local Collector:
env:
  - name: NODE_NAME
    valueFrom:
      fieldRef:
        fieldPath: spec.nodeName
  - name: OTEL_EXPORTER_OTLP_ENDPOINT
    value: "http://$(NODE_NAME):4318"
Common Production Pitfalls
Cardinality explosion on metrics. Every unique combination of attribute values creates a new time series in Prometheus. Never use high-cardinality values like userId, orderId, or requestId as metric attributes. Use them on spans instead, where each span is a document, not a time series.
Missing span ends. Every startSpan must have a corresponding end(). Missed end() calls keep spans in memory indefinitely. Use startActiveSpan with async callbacks (as shown in the code examples above) — the SDK handles cleanup automatically in the callback pattern.
W3C propagation mismatches. If one service uses B3 headers (older Zipkin standard) and another uses W3C traceparent, traces will break at that boundary. Audit your entire stack for propagator consistency. OTel defaults to W3C; configure OTEL_PROPAGATORS=tracecontext,baggage explicitly on every service.
Sampling inconsistency. If Service A samples at 5% head-based and Service B samples at 10%, you will have orphaned child spans in Service B that have no root span in your backend. Always use ParentBased sampling for all services downstream of your entry point, so the sampling decision made at the edge propagates through the entire call tree.
Ignoring the baggage API. OTel Baggage propagates arbitrary key-value pairs across service boundaries via HTTP headers, scoped to a trace. Use it to carry business context (like tenant.id or experiment.variant) without adding it to every DB call's SQL query. Many teams discover Baggage late and wish they had adopted it from day one.
Conclusion
OpenTelemetry in 2026 is no longer a bet on an emerging standard — it is the standard. The ecosystem has matured to the point where adopting OTel is the lowest-friction path to production-grade observability, regardless of which backend you use today or plan to use tomorrow.
The practical path forward from this guide:
-
Start with auto-instrumentation. One
--require ./instrumentation.jsflag gives you HTTP, Express, database, and Redis tracing with zero code changes. Ship this to staging and watch the waterfall diagrams appear. -
Add manual spans for business logic. Identify your most critical code paths — checkout, payment, auth — and wrap them in named spans with business-relevant attributes. This is where OTel pays dividends in incident response.
-
Deploy the OTel Collector. Even if you are sending to a single backend today, route through the Collector. It gives you tail-based sampling, batching, and the ability to add a new backend without touching application code.
-
Configure tail-based sampling. Set your baseline at 5-10% and always-keep rules for errors and slow traces. This typically gives you 95%+ of actionable signals at 10-15% of the cost.
-
Correlate your logs. Add the OTel log bridge to your existing logger. The ability to jump from a Grafana log line to the full trace that produced it is worth an afternoon of setup.
-
Build dashboards around RED metrics. Rate, Errors, Duration — the three metrics that matter most for every service. OTel's histogram instruments give you the p50/p95/p99 latency buckets Prometheus needs for accurate SLO tracking.
Distributed tracing is no longer a luxury for teams at Netflix scale. It is table stakes for any team running more than two services in production. OpenTelemetry makes it accessible, vendor-neutral, and — with the right sampling strategy — affordable at any scale.
This post is part of the AmtocSoft observability series. Next up: Building SLO dashboards in Grafana with OTel-sourced metrics and error budgets.
Sources
- OpenTelemetry documentation — Official spec, API reference, and SDK guides
- OpenTelemetry Specification — GitHub — Versioned signal specs (traces, metrics, logs, baggage)
- OpenTelemetry Collector — Deployment modes, pipeline config, and tail-based sampling reference
- Dapper, a Large-Scale Distributed Systems Tracing Infrastructure — Google (2010) — The foundational tracing paper behind modern distributed tracing
- OpenTelemetry Node.js SDK — Auto-instrumentation setup used in the Express examples
- Grafana Tempo documentation — The trace backend used in the dashboard section
- W3C Trace Context specification — The
traceparent/tracestateHTTP header standard OTel propagates - Cindy Sridharan — "Distributed Systems Observability" (O'Reilly) — Foundational text for the RED metrics framing
About the Author
Toc Am
Founder of AmtocSoft. Writing practical deep-dives on AI engineering, cloud architecture, and developer tooling. Previously built backend systems at scale. Reviews every post published under this byline.
Published: 2026-04-14 · Written with AI assistance, reviewed by Toc Am.
Get These In Your Inbox
Weekly deep-dives on AI engineering, no fluff. Join the newsletter →
Or grab the book ($39, ~100 pages) · Buy me a coffee
☕ Buy Me a Coffee · 🔔 YouTube · 💼 LinkedIn · 🐦 X/Twitter


No comments:
Post a Comment