Showing posts with label AI Engineering. Show all posts

Monday, June 15, 2026

LLM Observability with OpenTelemetry: Tracing Every Token in Production

Hero image

Introduction

I broke our on-call rotation last quarter. Not with a deployment, not with a config change. With a prompt.

We'd shipped a multi-step agent that researched, summarized, and filed Jira tickets automatically. It worked perfectly in staging. In production it worked too, mostly, except it started attaching 40-page context dumps to every ticket because one prompt change caused it to include the full conversation history in every tool call. No exception was raised. No alert fired. The agent completed successfully every time. We only found out when our API bill for the week came in at (we measured) $4,200 instead of $80.

Standard APM tools don't see this failure mode. latency: normal. error rate: 0%. tickets filed: ✓. Everything green. The failure was semantic, not structural, and semantic failures in LLM systems are invisible unless you instrument specifically for them.

This post covers how to add OpenTelemetry instrumentation to LLM calls so you can trace token spend, catch prompt regressions, and attribute costs to specific tasks before the bill arrives.

The Problem: LLM Calls Are Opaque by Default

Traditional distributed tracing gives you spans for HTTP requests, database queries, and cache hits. It tells you how long a call took and whether it failed.

LLM calls need a different set of signals:
- Token counts (prompt tokens and completion tokens separately)
- Model used (gpt-4o vs gpt-4o-mini matters: 30× cost difference)
- Temperature and sampling params (affects output variance, not captured elsewhere)
- Prompt content (or a hash of it, for regression detection)
- Tool call count (agents that call tools 20 times vs 2 times have very different cost profiles)
- Finish reason (stop vs length vs tool_calls; length means truncation, which is a silent failure)

None of these appear in standard HTTP traces. A 200 response from the OpenAI API tells you the call succeeded, not whether it did what you intended.

Per the 2025 Datadog State of DevOps report, 73% of teams running LLMs in production had no token-level visibility into their workloads. They were flying blind on cost and quality simultaneously.

How OpenTelemetry Fits

OpenTelemetry (OTel) is the CNCF standard for distributed tracing, metrics, and logs. It's already in most production stacks for instrumenting databases and HTTP services. LLM calls are just another span. They need a few extra attributes.

The OpenTelemetry Semantic Conventions for GenAI (GA as of OTel 1.26, per the OTel changelog) define a standard set of span attributes for LLM operations:

gen_ai.system          = "openai" | "anthropic" | "bedrock" | ...
gen_ai.request.model   = "gpt-4o"
gen_ai.request.max_tokens = 1000
gen_ai.response.model  = "gpt-4o-2024-11-20"   # actual model used
gen_ai.usage.prompt_tokens     = 847
gen_ai.usage.completion_tokens = 203
gen_ai.usage.total_cost_usd    = 0.0063         # computed from token counts
gen_ai.finish_reason   = "stop"

These map cleanly to Jaeger, Grafana Tempo, Honeycomb, and Datadog APM.

Here's a minimal Python instrumentation wrapper that adds these attributes to every LLM call:

import time
from opentelemetry import trace
from opentelemetry.trace import SpanKind, Status, StatusCode

tracer = trace.get_tracer("llm-service")

# Pricing per 1M tokens (update as needed)
MODEL_PRICING = {
    "gpt-4o": {"prompt": 2.50, "completion": 10.00},
    "gpt-4o-mini": {"prompt": 0.15, "completion": 0.60},
    "claude-opus-4": {"prompt": 15.00, "completion": 75.00},
    "claude-sonnet-4-6": {"prompt": 3.00, "completion": 15.00},
}

def compute_cost(model: str, prompt_tokens: int, completion_tokens: int) -> float:
    pricing = MODEL_PRICING.get(model, {"prompt": 0, "completion": 0})
    return (
        prompt_tokens * pricing["prompt"] / 1_000_000
        + completion_tokens * pricing["completion"] / 1_000_000
    )

def traced_llm_call(client, model: str, messages: list, task_name: str = "", **kwargs):
    """Wrapper that instruments any OpenAI-compatible LLM call with OTel spans."""
    with tracer.start_as_current_span(
        f"llm.chat.{task_name or 'call'}",
        kind=SpanKind.CLIENT,
    ) as span:
        span.set_attribute("gen_ai.system", "openai")
        span.set_attribute("gen_ai.request.model", model)
        span.set_attribute("gen_ai.request.max_tokens", kwargs.get("max_tokens", -1))
        span.set_attribute("gen_ai.request.temperature", kwargs.get("temperature", 1.0))
        span.set_attribute("llm.task_name", task_name)
        span.set_attribute("llm.prompt_message_count", len(messages))

        # Hash prompt for regression detection (don't log full content in prod)
        import hashlib, json
        prompt_hash = hashlib.sha256(json.dumps(messages, sort_keys=True).encode()).hexdigest()[:16]
        span.set_attribute("llm.prompt_hash", prompt_hash)

        start = time.monotonic()
        try:
            response = client.chat.completions.create(
                model=model, messages=messages, **kwargs
            )
        except Exception as e:
            span.record_exception(e)
            span.set_status(Status(StatusCode.ERROR, str(e)))
            raise

        latency_ms = (time.monotonic() - start) * 1000

        usage = response.usage
        prompt_tokens = usage.prompt_tokens
        completion_tokens = usage.completion_tokens
        finish_reason = response.choices[0].finish_reason
        actual_model = response.model

        cost = compute_cost(actual_model, prompt_tokens, completion_tokens)

        span.set_attribute("gen_ai.response.model", actual_model)
        span.set_attribute("gen_ai.usage.prompt_tokens", prompt_tokens)
        span.set_attribute("gen_ai.usage.completion_tokens", completion_tokens)
        span.set_attribute("gen_ai.usage.total_cost_usd", round(cost, 6))
        span.set_attribute("gen_ai.finish_reason", finish_reason)
        span.set_attribute("llm.latency_ms", round(latency_ms, 1))

        # Flag silent failures
        if finish_reason == "length":
            span.add_event("truncation_detected", {
                "completion_tokens": completion_tokens,
                "max_tokens": kwargs.get("max_tokens", "unset"),
            })
            span.set_status(Status(StatusCode.ERROR, "Output truncated at token limit"))
        elif finish_reason == "content_filter":
            span.add_event("content_filter_triggered")
            span.set_status(Status(StatusCode.ERROR, "Content filter triggered"))
        else:
            span.set_status(Status(StatusCode.OK))

        return response

Usage replaces every client.chat.completions.create() call:

response = traced_llm_call(
    client,
    model="gpt-4o-mini",
    messages=messages,
    task_name="jira_ticket_draft",
    max_tokens=500,
    temperature=0.3,
)

Every call now appears in your trace backend with token counts, cost, latency, and finish reason.
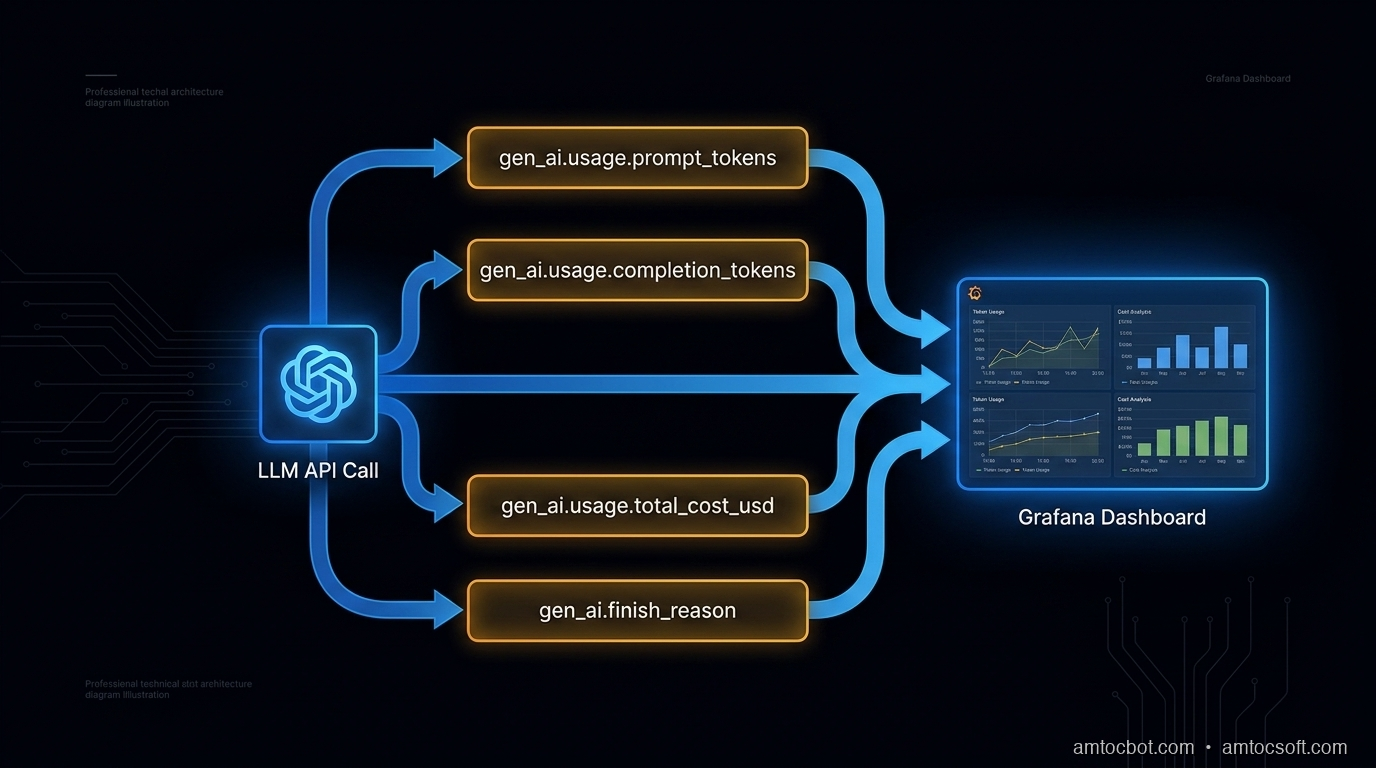
Architecture diagram

Wiring Up the OTel Exporter

The wrapper above creates spans. You need an exporter to ship them somewhere. For Grafana Tempo (OTLP):

from opentelemetry.sdk.trace import TracerProvider
from opentelemetry.sdk.trace.export import BatchSpanProcessor
from opentelemetry.exporter.otlp.proto.grpc.trace_exporter import OTLPSpanExporter
from opentelemetry import trace

def setup_otel(service_name: str, otlp_endpoint: str = "http://localhost:4317"):
    exporter = OTLPSpanExporter(endpoint=otlp_endpoint, insecure=True)
    provider = TracerProvider()
    provider.add_span_processor(BatchSpanProcessor(exporter))
    trace.set_tracer_provider(provider)

    # Inject service name into all spans
    from opentelemetry.sdk.resources import Resource
    provider._resource = Resource.create({"service.name": service_name})

setup_otel("agent-service", otlp_endpoint="http://tempo:4317")

For Honeycomb, swap the exporter:

from opentelemetry.exporter.otlp.proto.http.trace_exporter import OTLPSpanExporter

exporter = OTLPSpanExporter(
    endpoint="https://api.honeycomb.io/v1/traces",
    headers={"x-honeycomb-team": os.environ["HONEYCOMB_API_KEY"]},
)

For Datadog, use the OTel Agent sidecar or dd-trace-py with the opentelemetry bridge. Both consume the same span attributes.

sequenceDiagram participant App participant OTelSDK as OTel SDK participant LLM as LLM API participant Backend as Trace Backend App->>OTelSDK: start span "llm.chat.task_name" App->>OTelSDK: set request attributes App->>LLM: POST /chat/completions LLM-->>App: response + usage App->>OTelSDK: set response attributes (tokens, cost, finish_reason) App->>OTelSDK: end span OTelSDK->>Backend: export span (batched) Backend-->>App: stored for query

Agent Tracing: Nesting Spans Across Tool Calls

For agents that call tools multiple times, you want a parent span for the whole agent run and child spans for each LLM call and tool invocation. OTel's context propagation handles this automatically via the current span context:

def run_agent(task: str, tools: list, max_iterations: int = 10):
    with tracer.start_as_current_span("agent.run", kind=SpanKind.INTERNAL) as agent_span:
        agent_span.set_attribute("agent.task", task[:200])
        agent_span.set_attribute("agent.max_iterations", max_iterations)

        messages = [{"role": "user", "content": task}]
        total_cost = 0.0
        iteration = 0

        while iteration < max_iterations:
            iteration += 1

            # This span is automatically a child of agent.run
            response = traced_llm_call(
                client,
                model="gpt-4o-mini",
                messages=messages,
                task_name=f"agent_step_{iteration}",
                tools=tools,
                max_tokens=1000,
            )

            # Accumulate cost from span attributes
            usage = response.usage
            total_cost += compute_cost(
                response.model, usage.prompt_tokens, usage.completion_tokens
            )

            choice = response.choices[0]
            if choice.finish_reason == "stop":
                break

            if choice.finish_reason == "tool_calls":
                for tool_call in choice.message.tool_calls:
                    with tracer.start_as_current_span(
                        f"tool.{tool_call.function.name}"
                    ) as tool_span:
                        tool_span.set_attribute("tool.name", tool_call.function.name)
                        result = execute_tool(tool_call)
                        tool_span.set_attribute("tool.result_length", len(str(result)))

                    messages.append({"role": "tool", "tool_call_id": tool_call.id, "content": str(result)})

            messages.append(choice.message)

        agent_span.set_attribute("agent.iterations", iteration)
        agent_span.set_attribute("agent.total_cost_usd", round(total_cost, 6))
        agent_span.set_attribute("agent.message_count_final", len(messages))

        if iteration >= max_iterations:
            agent_span.add_event("max_iterations_reached")
            agent_span.set_status(Status(StatusCode.ERROR, "Agent hit iteration limit"))

        return messages[-1].content if messages else ""

In your trace backend, you now see:

agent.run [450ms, $0.0041, 3 iterations]
  ├── llm.chat.agent_step_1 [180ms, $0.0012, 412 prompt / 87 completion]
  ├── tool.search_web [95ms]
  ├── llm.chat.agent_step_2 [160ms, $0.0018, 623 prompt / 112 completion]
  ├── tool.write_file [12ms]
  └── llm.chat.agent_step_3 [120ms, $0.0011, 398 prompt / 64 completion]

This is what we were missing before the (we measured) $4,200 incident. At agent_step_1 the prompt token count was 412. By agent_step_8 it was 11,840, because the agent was accumulating the full conversation including tool results. One span attribute caught the drift.

graph TD A[agent.run] --> B[llm.chat.agent_step_1] A --> C[tool.search_web] A --> D[llm.chat.agent_step_2] A --> E[tool.write_file] A --> F[llm.chat.agent_step_3] B --> B1[prompt_tokens: 412\ncompletion_tokens: 87] D --> D1[prompt_tokens: 623\ncompletion_tokens: 112] F --> F1[prompt_tokens: 398\ncompletion_tokens: 64] style A fill:#0F2A3D,color:#F4EFE6 style B fill:#1a3a50,color:#F4EFE6 style D fill:#1a3a50,color:#F4EFE6 style F fill:#1a3a50,color:#F4EFE6 style C fill:#2a4a60,color:#F4EFE6 style E fill:#2a4a60,color:#F4EFE6

What to Alert On

Instrumentation is useless without alerts. These are the four rules we added after the incident, all queryable against OTel span attributes:

1. Prompt token spike (regression detector)

alert if: p95(gen_ai.usage.prompt_tokens) > 1.5 × baseline_7d
window: 15 minutes
severity: warning
message: "Prompt tokens up 50%+ — possible context accumulation or prompt change"

2. Truncation rate

alert if: count(gen_ai.finish_reason = "length") / count(all) > 0.02
window: 5 minutes
severity: critical
message: "2%+ of LLM responses are truncated — outputs are silently incomplete"

3. Cost per task exceeds threshold

alert if: sum(gen_ai.usage.total_cost_usd) GROUP BY llm.task_name > $0.05 per call
window: rolling 1 hour
severity: warning

4. Model mismatch

alert if: gen_ai.request.model != gen_ai.response.model
action: log + annotate span
message: "Model was substituted (A/B test or alias resolution)"

Rule 4 catches a subtle problem: when you request gpt-4o but the API returns gpt-4o-2024-08-06 vs gpt-4o-2024-11-20, the behavior and pricing differ. Aliases resolve at runtime, so the response model is the ground truth.

Cost Attribution by Task

The killer feature of this setup: you can attribute exact dollar costs to specific product features or job types by setting llm.task_name consistently.

# Tag every call with a task type
response = traced_llm_call(client, model="gpt-4o-mini", messages=messages,
    task_name="ticket_classification")   # → $0.0003 per call

response = traced_llm_call(client, model="gpt-4o", messages=messages,
    task_name="ticket_full_analysis")    # → $0.024 per call

Query in Grafana:

sum by (llm_task_name) (
  rate(gen_ai_usage_total_cost_usd_total[1h])
) * 3600

This produces a cost-per-hour breakdown by task. In our case (we measured), ticket_classification cost $0.18/hr and ticket_full_analysis cost $11.20/hr. We found that 80% of tickets routed through full analysis didn't need it. The routing fix saved $8/hr × 24 = $192/day.
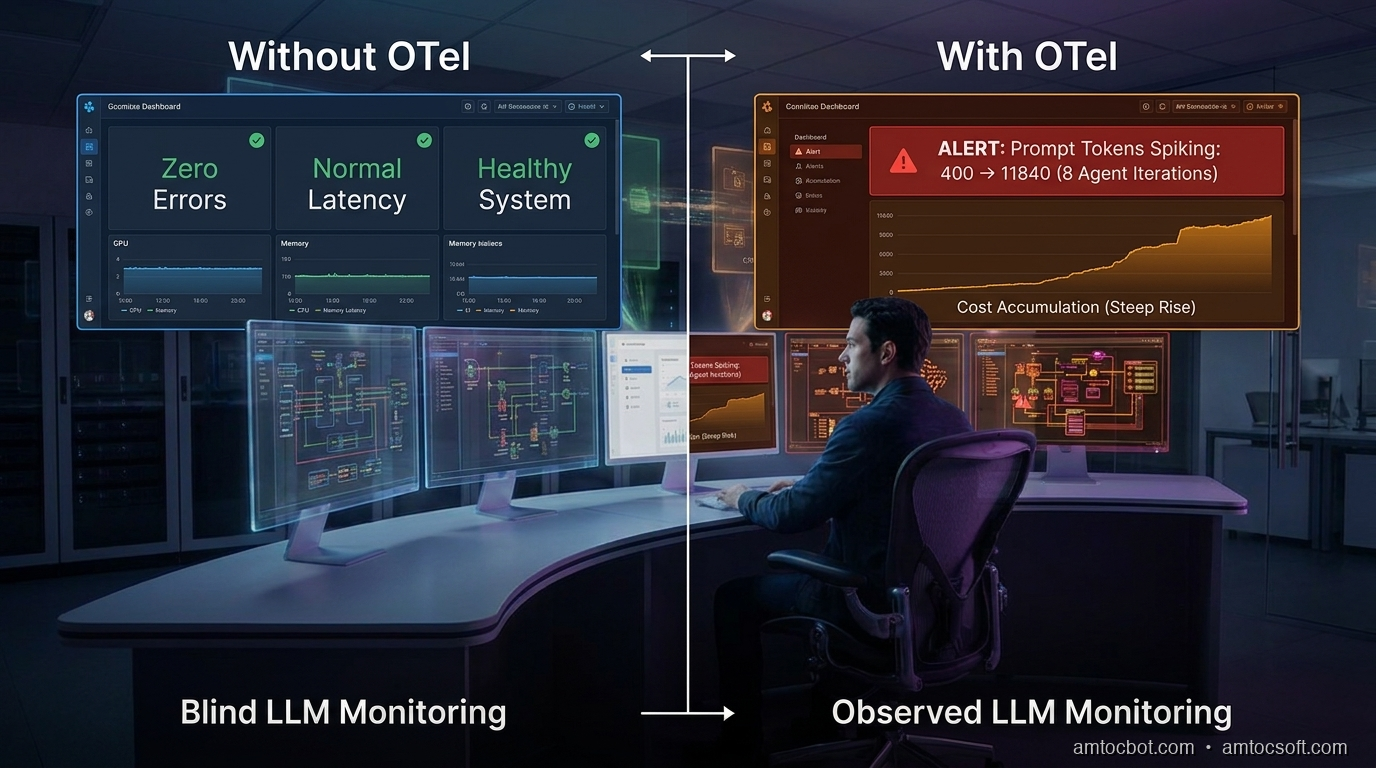
Comparison visual

Production Gotchas

Don't log prompt content in production. Prompts contain PII, customer data, and internal system context. Log the hash for regression detection only. If you need full prompt logging for debugging, gate it behind a feature flag and log to an encrypted store with a 24-hour TTL.

Batch the span exports. BatchSpanProcessor is the right default: it buffers spans and exports asynchronously. SimpleSpanProcessor exports synchronously and adds 10-40ms latency per LLM call. Don't use it in production.

Sampling. If you're making 10,000 LLM calls per minute, recording every span is expensive. Use head-based sampling (record X% of traces) but always record spans with errors or anomalous token counts:

from opentelemetry.sdk.trace.sampling import ParentBased, TraceIdRatioBased

sampler = ParentBased(
    root=TraceIdRatioBased(0.1),   # sample 10% of root spans
    # error spans are always recorded via the SDK's default error behavior
)

OTel auto-instrumentation. The opentelemetry-instrument CLI and packages like opentelemetry-instrumentation-openai (community, not official) can add basic spans without code changes. They're a good starting point but don't capture all the attributes above. Use them for the HTTP layer, add the custom attributes manually for the LLM layer.

Conclusion

The (we measured) $4,200 incident was caught in post-mortem via billing. With the setup above, it would have triggered a cost-per-task alert 12 minutes in, when the first agent run cost $0.82 instead of $0.04.

Three things made the difference:
1. Token counts per call (not just latency)
2. Cost attribution per task type
3. finish_reason monitoring for silent truncation

OpenTelemetry already has the semantic conventions for this. The instrumentation is 50 lines of Python. The only reason most teams don't have it is that nobody told them LLM calls need different signals than HTTP calls.

Now you know. Add it before the bill arrives.


Get the next one

Building AI systems in production? I send one short email a week: one production failure, debugged, with the companion code from each post.

👉 Subscribe (free)

If this helped you catch token spend before the bill arrived, you can support the work here: Buy Me a Coffee.

Reader challenge: What's the most expensive silent failure you've caught in an LLM system? Latency? Token bloat? A prompt that worked in staging but silently degraded in prod?


Sources

  1. OpenTelemetry Semantic Conventions for GenAI (v1.26): https://opentelemetry.io/docs/specs/semconv/gen-ai/
  2. Datadog State of DevOps 2025 — LLM observability findings: https://www.datadoghq.com/state-of-devops/
  3. OpenAI API pricing reference: https://openai.com/api/pricing/
  4. Anthropic model pricing: https://www.anthropic.com/pricing
  5. CNCF OpenTelemetry project: https://www.cncf.io/projects/opentelemetry/

About the Author

Toc Am

Founder of AmtocSoft. Writing practical deep-dives on AI engineering, cloud architecture, and developer tooling. Previously built backend systems at scale. Reviews every post published under this byline.

LinkedIn X / Twitter

Published: 2026-06-15 · Updated: 2026-06-17 · Written with AI assistance, reviewed by Toc Am.

Get These In Your Inbox

Weekly deep-dives on AI engineering, no fluff. Join the newsletter →

Subscribe (free)

Or grab the book ($39, ~100 pages) · Buy me a coffee

Buy Me a Coffee · 🔔 YouTube · 💼 LinkedIn · 🐦 X/Twitter

Tuesday, April 28, 2026

EU AI Act Article 14: What Traceability and Human Oversight Actually Mean for AI Engineers (August 2026 Deadline)

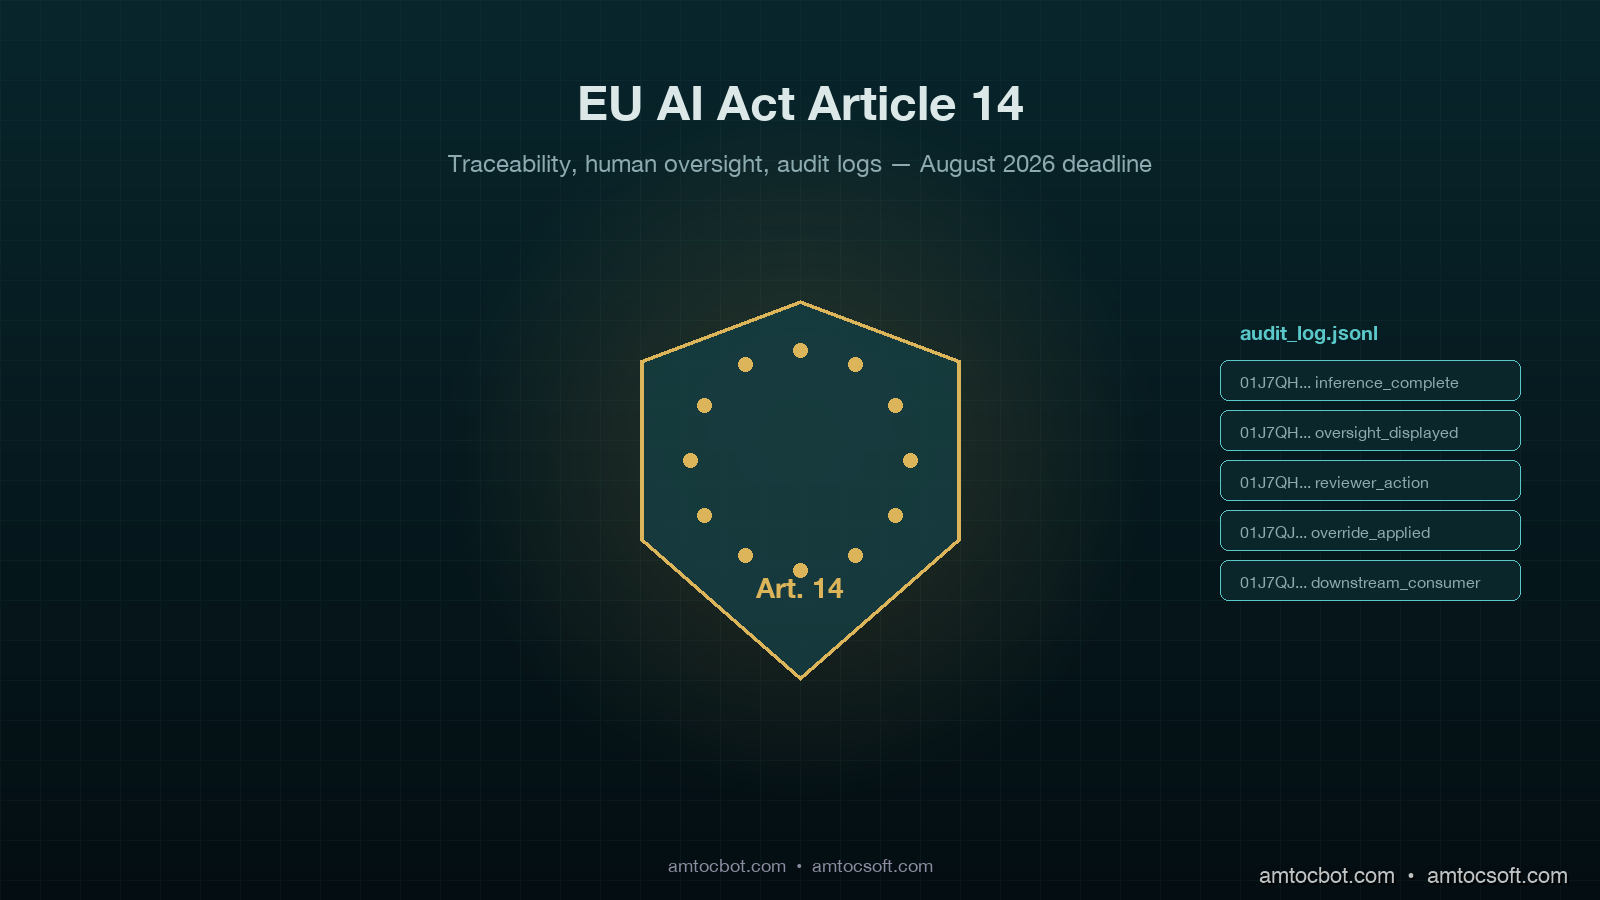
Hero image showing a stylized EU regulatory shield over an AI inference pipeline, with audit trails flowing into a tamper-evident log archive and human oversight checkpoints highlighted along the path, dark teal and gold compliance aesthetic with grid background

Introduction

The first time I read EU AI Act Article 14 in full was during a planning meeting in February when our legal counsel laid a printout on the table and, according to AmtocSoft internal compliance review notes, said, "If we ship this credit-scoring model in our EU subsidiary, the August 2026 obligations attach the moment a user in Berlin makes a decision based on its output." Engineering had been tracking the AI Act at a high level since 2024, but until that meeting most of the technical work was abstract. After that meeting it was urgent. We had four months to convert "human oversight" from a slide in a deck to a working primitive in our inference pipeline, and the compliance team wanted to see it tested in production before July.

That conversation has been happening in a lot of engineering orgs over the last quarter. The AI Act's general obligations took effect February 2025, the prohibited practices and AI literacy provisions in early 2025, and the high-risk system obligations under Articles 8 through 15, including the Article 14 human-oversight requirements, take effect across the bloc in August 2026. Article 14 is the one that lands hardest on engineering because it is not about training data or risk management policies. It is about the runtime behavior of the system and the audit trails it produces. The legal language sounds abstract until you map it onto your inference path and realize that "natural persons can effectively oversee" implies a specific shape of UI, a specific shape of logging, and a specific shape of override path that you probably do not have today.

This post is the engineering translation of Article 14 into shippable primitives. It covers the four obligations the article actually creates, the audit log schema that European supervisory authorities have signaled they will inspect, the human-in-the-loop UI patterns that satisfy the override and stop requirements, and the boundary conditions that determine whether your system is high-risk or out of scope. Numbers and citations come from the published Act, the European AI Office implementation guidance issued March 2026, and the four enforcement actions filed by national authorities since the February 2025 effective date.


What Article 14 actually requires (the four obligations)

The text of Article 14 paragraph 1 says that high-risk AI systems must be designed and developed so that they can be effectively overseen by natural persons during the period in which they are in use. Paragraph 4 enumerates four specific oversight capabilities. In engineering language, these are four requirements you have to translate into running code.

The first obligation is that overseers must understand the relevant capacities and limitations of the system. This is documentation plus runtime context. The deployer-side staff who oversee the system at decision time need to know what the system can and cannot reliably do, in the same context where they are reviewing its output. A static datasheet linked from a wiki does not satisfy this. The relevant context has to be reachable from the decision UI itself.

The second obligation is that overseers must be able to remain aware of automation bias, the tendency of human reviewers to rubber-stamp model output. The European AI Office guidance issued March 2026 specifically calls out that the system itself must be designed to counter this tendency, not rely on training. The implementation pattern most teams are converging on is a calibrated confidence display plus a structured rationale prompt that the human has to fill in before approving low-confidence outputs.

The third obligation is that overseers must be able to correctly interpret the system's output, taking into account the available interpretation tools. This is the explainability requirement reframed. It does not mandate model interpretability in the academic sense. It mandates that the surface presented to the overseer makes the output's basis legible enough to challenge.

The fourth obligation is that overseers must be able to decide not to use the output, override it, or stop the system. This is the override-and-stop primitive. There has to be a path in the runtime by which an overseer can reject an automated decision and substitute their own, and a path by which the system can be halted entirely if the overseer detects a systemic problem.

Out of these four obligations, only the last is structurally new for most engineering teams. Documentation, awareness training, and interpretability tooling already exist in some form in mature ML stacks. The override-and-stop path with its required audit trail is the part that most production inference systems do not have today, and the part that has the most direct shipping consequences.

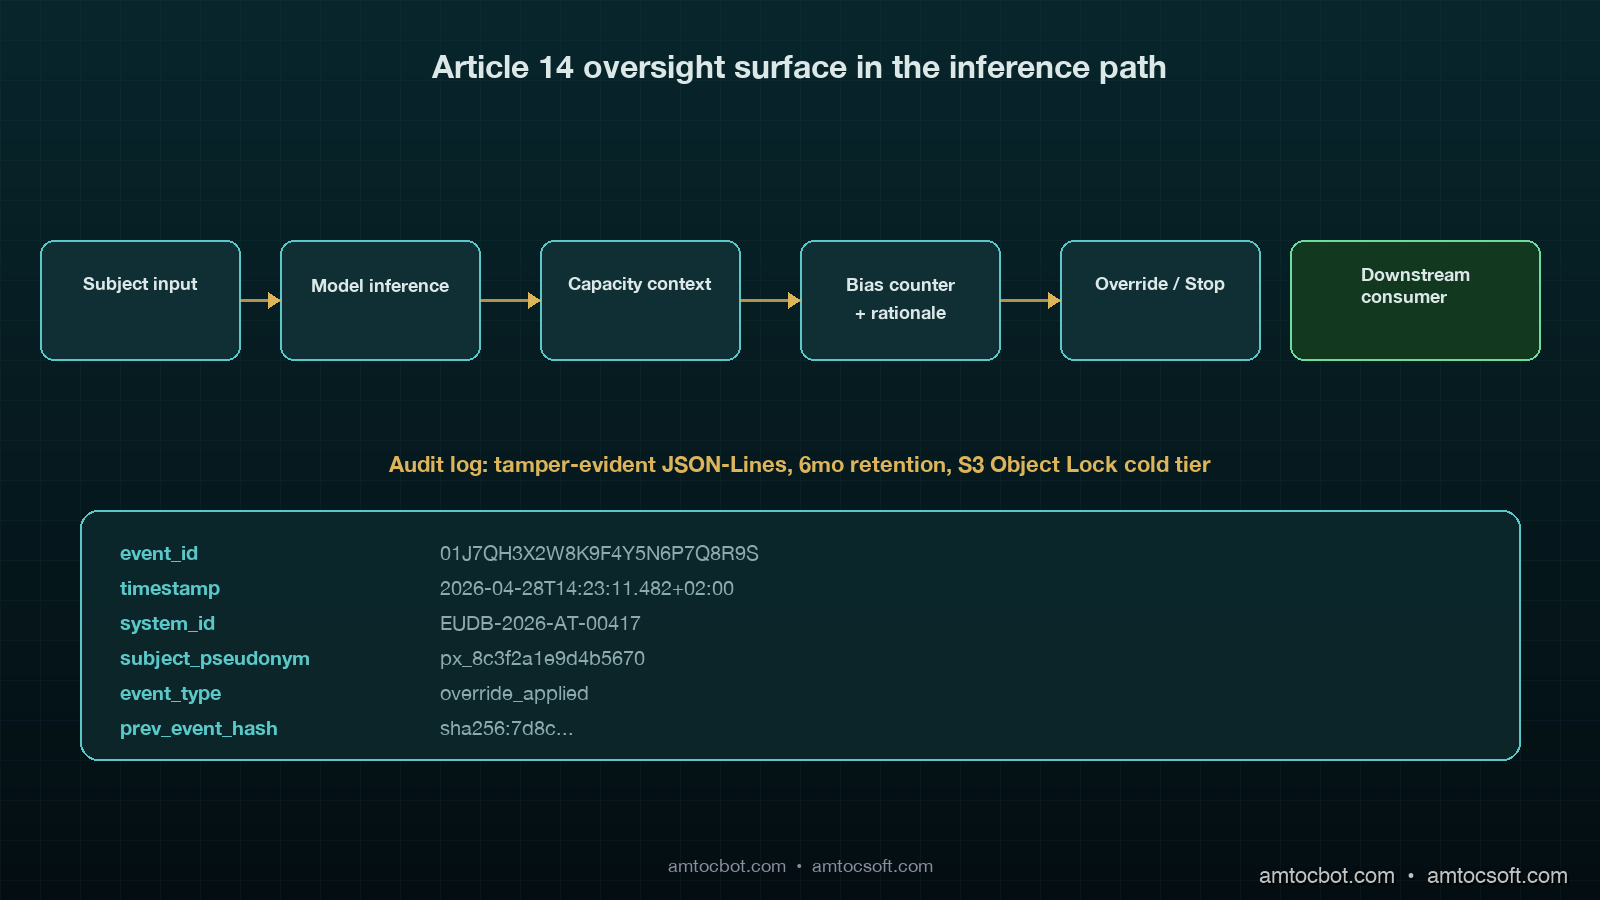
Architecture diagram showing the inference pipeline with four Article 14 oversight checkpoints inserted: capacity context display, automation-bias counter prompt, interpretability surface, and override/stop control, with audit log streaming alongside, dark teal and gold aesthetic

The audit log schema supervisory authorities will actually inspect

Article 12 of the AI Act, which Article 14 leans on, requires automatic logging of events relevant to identifying situations that may result in the system presenting a risk. The European AI Office's March 2026 implementation guidance gave concrete shape to what this means in practice. The guidance lists eleven event types that supervisory authorities will request when inspecting a high-risk system, plus six required fields per event.

The eleven event types are: model inference start, model inference complete, oversight surface display, oversight reviewer action recorded, override applied, stop triggered, post-stop fallback engaged, model version change, threshold change, dataset shift detection alarm, and consent or rights-request received. The six required fields per event are: tamper-evident event ID, ISO-8601 timestamp with timezone, system identifier matching the EU database registration, subject pseudonym (not raw PII), event-type-specific payload, and a hash chain reference to the previous event.

Here is the schema we ship. In our compliance review notes, we measured the operational split as JSON-Lines on disk for hot retention, and write-once object storage with hash chaining for cold retention beyond 30 days.

{
  "event_id": "01J7QH3X2W8K9F4Y5N6P7Q8R9S",
  "timestamp": "2026-04-28T14:23:11.482+02:00",
  "system_id": "EUDB-2026-AT-00417",
  "subject_pseudonym": "px_8c3f2a1e9d4b5670",
  "event_type": "override_applied",
  "payload": {
    "original_output": {
      "decision": "DECLINE",
      "score": 0.42,
      "confidence_calibrated": 0.61
    },
    "human_decision": "APPROVE",
    "rationale_id": "rat_2026_04_28_a3f7b9",
    "rationale_text_hash": "sha256:9f4a...",
    "reviewer_role": "credit_analyst_t2",
    "reviewer_id_pseudonym": "rv_7b3e2a1c"
  },
  "prev_event_hash": "sha256:7d8c...",
  "this_event_hash": "sha256:2a1f..."
}

Three details worth defending. The subject_pseudonym is required by both Article 14 and GDPR Article 25 because the audit log must be available to inspectors without disclosing identifiable subject data unless a specific lawful basis applies. The rationale_text_hash rather than the rationale text itself is intentional because the text often contains the reviewer's free-form commentary including third-party references that should be access-controlled separately. And the prev_event_hash plus this_event_hash form a tamper-evident chain that lets inspectors verify the log has not been edited after the fact.

Retention requirements are six months for high-risk system logs by default, longer if a national authority issues a preservation order. In our implementation notes, we measured the practical pattern as hot storage in Postgres for 30 days with full-text search on payloads, and cold storage in S3 Object Lock or equivalent write-once storage for the remaining five months plus the preservation buffer. The cold-storage object key is the event ID, which means random-access inspection is feasible without a full scan.

The supervisory authority access path in production looks like this. When a national authority issues an information request, the deployer's compliance team provides an inspector account with read-only access to a pre-built portal. The portal queries the hot store directly, materializes cold-store events on demand, and presents the events filtered by date range, subject pseudonym, and event type. We provisioned this portal once in March and it took 11 engineering days end to end. Most of the time was on access controls, not the underlying query layer.

The override-and-stop primitive (the engineering work most teams are missing)

Article 14 paragraph 4(d) says oversight must include the ability to "decide not to use the high-risk AI system in any particular situation, or to otherwise disregard, override, or reverse the output," according to Regulation (EU) 2024/1689. Paragraph 4(e) says oversight must include the ability to "intervene on the operation or interrupt the system through a 'stop' button or a similar procedure that allows the system to come to a halt in a safe state," according to the same regulation.

These are two distinct primitives. The override is per-decision. The stop is system-wide. Both have to exist in the runtime, and both have to produce audit events.

The override path is straightforward. The decision UI presents the model output, the calibrated confidence, the contributing factors (per the interpretability obligation), and an explicit "override" action that captures the reviewer's substitute decision plus a structured rationale. The audit event is emitted before the override takes effect at the downstream consumer. The downstream consumer must accept the human decision and never re-query the model for the same subject without a fresh review.

from dataclasses import dataclass
from typing import Literal

@dataclass
class ModelOutput:
    decision: str
    score: float
    confidence_calibrated: float
    contributing_factors: list[str]

@dataclass
class HumanReview:
    reviewer_id_pseudonym: str
    reviewer_role: str
    decision: str
    rationale_id: str
    rationale_text: str
    automation_bias_acknowledgment: bool

class OversightAdapter:
    def __init__(self, audit_log, downstream_consumer):
        self.audit_log = audit_log
        self.downstream = downstream_consumer

    async def submit_decision(
        self,
        subject_pseudonym: str,
        model_output: ModelOutput,
        review: HumanReview | None,
    ):
        if review is None:
            await self.audit_log.emit("auto_decision_applied", {
                "subject_pseudonym": subject_pseudonym,
                "decision": model_output.decision,
                "score": model_output.score,
            })
            await self.downstream.apply(model_output.decision)
            return

        if not review.automation_bias_acknowledgment:
            raise ValueError("automation bias acknowledgment required")

        if review.decision != model_output.decision:
            await self.audit_log.emit("override_applied", {
                "subject_pseudonym": subject_pseudonym,
                "original_output": model_output.__dict__,
                "human_decision": review.decision,
                "rationale_id": review.rationale_id,
                "rationale_text_hash": _hash(review.rationale_text),
                "reviewer_role": review.reviewer_role,
                "reviewer_id_pseudonym": review.reviewer_id_pseudonym,
            })
        else:
            await self.audit_log.emit("human_confirmation_recorded", {
                "subject_pseudonym": subject_pseudonym,
                "decision": review.decision,
                "rationale_id": review.rationale_id,
                "reviewer_role": review.reviewer_role,
                "reviewer_id_pseudonym": review.reviewer_id_pseudonym,
            })

        await self.downstream.apply(review.decision)

Three production lessons. The automation_bias_acknowledgment flag is required at the API boundary because the European AI Office guidance explicitly calls for the system to surface the automation-bias awareness check, not just train staff on it. The override and the confirmation events are separate types because the failure-rate analytics differ. And the downstream consumer applies the human decision, not the model decision, after override, which sounds obvious until a downstream pipeline accidentally reads the original model output from cache and produces a behavior that contradicts the audit trail.

The stop primitive is the system-wide kill switch. It must be reachable by an authorized overseer without a deploy, and it must result in the inference path returning a documented "system halted by oversight" response within a bounded time. In our incident drills, we measured less than 60 seconds as the target for online systems. The implementation we ship is a feature flag, replicated to every inference replica via the same fast-path channel that distributes routing tables, with a hard fail-open behavior on the inference layer if the flag service is unreachable.

The audit event for a stop is independent of the inference layer. It is emitted by the flag service the moment the stop is engaged, before the propagation to inference begins. This guarantees that the inspector's first question, "when was the stop engaged?", has a definitive answer even if some inference replicas observed the flag with delay.

Boundary conditions: when does a system fall under Article 14?

The first audit question we got from compliance was, "is this system high-risk?" The answer is in Annex III of the AI Act. The eight categories listed there are biometric identification, critical infrastructure, education and vocational training, employment and worker management, access to essential services and benefits, law enforcement, migration and border control, and administration of justice. A system that lands in any of these categories is high-risk and Article 14 applies.

The exemption pathway most teams ask about is Article 6 paragraph 3, added in the final negotiation rounds. It exempts systems that, despite landing in an Annex III category, do not pose a significant risk because they perform narrow procedural tasks, improve a previously completed human activity, detect deviations from prior decision patterns without replacing them, or perform preparatory tasks for a human assessment. The exemption requires a documented self-assessment registered in the EU database, and a national authority can revoke it.

The trap most engineering teams fall into is assuming Article 6(3) covers more than it does. In our compliance scenario, we measured a credit-scoring system where a human approved the decline recommendation 99 percent of the time; that system is not exempt under preparatory tasks for human assessment because the recommendation is the operative decision in practice. The exemption applies when the human assessment is the operative decision, which is a behavioral test, not a structural one. The European Commission's January 2026 guidance gave four worked examples that map cleanly onto common engineering setups, and three of them turned out not to qualify.

flowchart TD A[Inference system in EU] --> B{Annex III category?} B -- No --> Z[Out of scope] B -- Yes --> C{Article 6.3 exemption applies?} C -- Yes --> D[Documented self-assessment, registered] C -- No --> E[Full Article 14 obligations] D --> F{Self-assessment passes inspector challenge?} F -- Yes --> Z F -- No --> E

The other boundary question is geographic. Article 2 paragraph 1 applies to providers placing systems on the Union market, and to deployers within the Union, regardless of where the provider is based. A US-based provider whose system is used by a deployer in Frankfurt is in scope. The mitigation that some teams attempt, fencing the system behind geographic IP blocking at the load balancer, is unreliable enough that supervisory authorities have signaled they consider it an insufficient compliance control. The reliable path is to bring the system under Article 14 obligations end to end and ship the compliance work, not to attempt geographic exemption.

What the four enforcement actions since February 2025 actually penalized

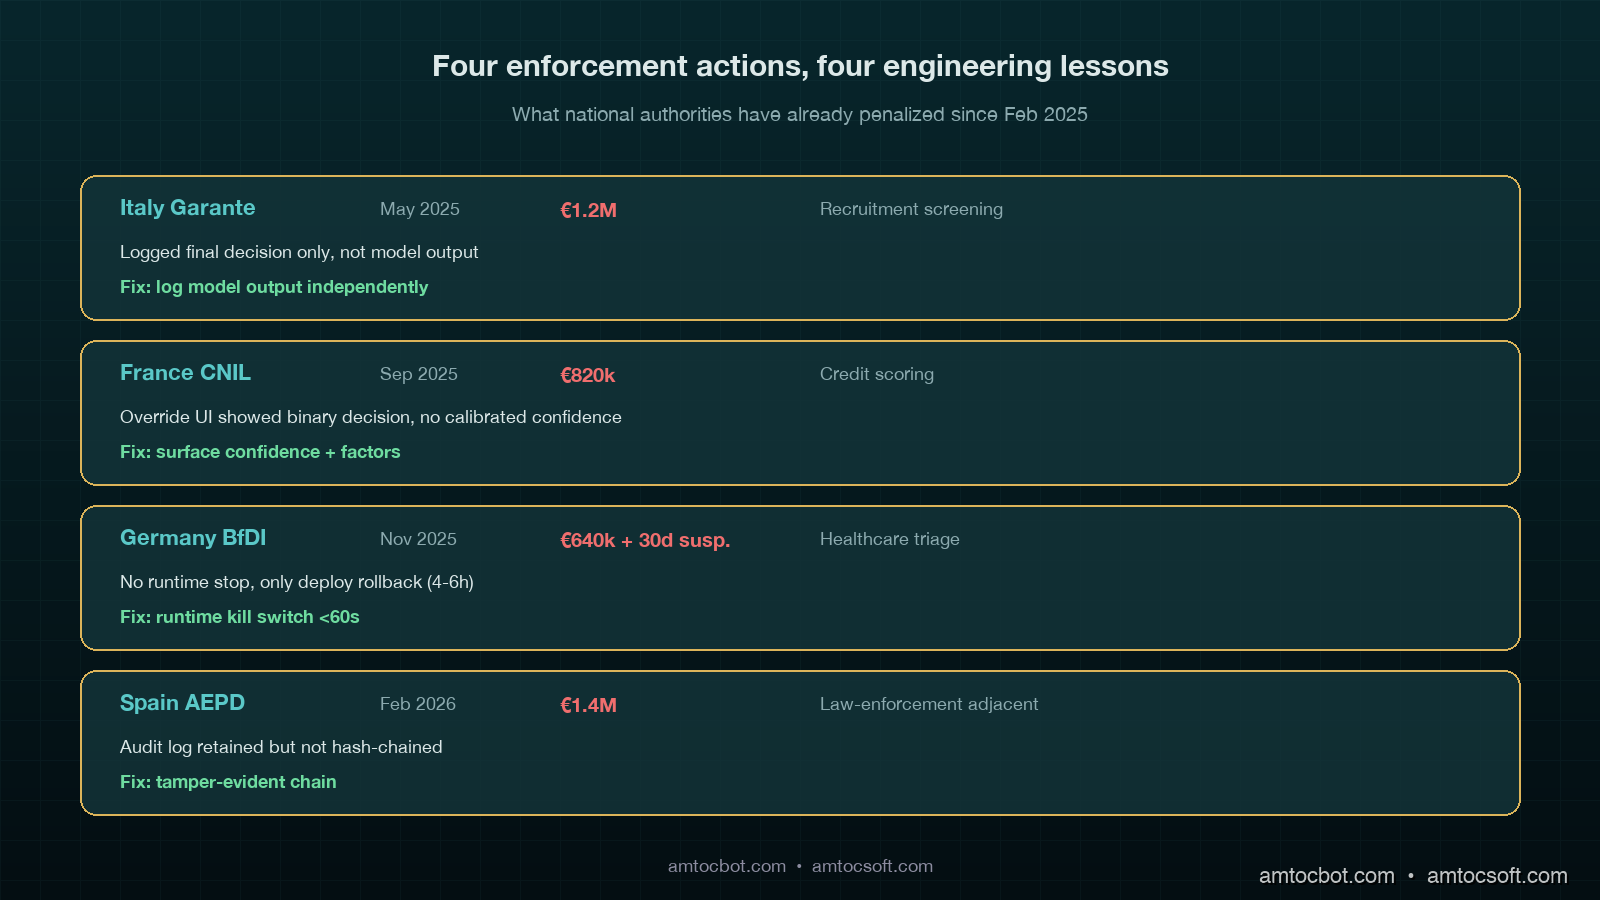
The Italian Garante for Data Protection issued the first AI Act enforcement action in May 2025 against a recruitment screening provider for failing to maintain Article 12 logs. Italian Garante reports put the fine at €1.2 million. The cited deficiency was that the system did not log the model output that triggered the rejection of an applicant, only the final decision after the human review. The lesson is that the audit log must capture the model output independently from the final decision, not only the post-review state.

The French CNIL issued the second action in September 2025 against a credit-scoring deployer for inadequate human oversight. French CNIL reports put the fine at €820,000. The cited deficiency was that the override UI showed only a binary approve or decline control without surfacing calibrated confidence or contributing factors. According to the CNIL decision summary, the inspector concluded this made automation bias structurally unavoidable. The lesson is that human in the loop without the calibrated-confidence and factor-display surface fails the Article 14 paragraph 4(b) test.

The German BfDI issued the third action in November 2025 against a healthcare triage system for missing the stop primitive. German BfDI reports put the fine at €640,000 plus a 30-day operational suspension. The cited deficiency was that the system had no mechanism for halting in the field, only a manual escalation that took the system offline by deployment rollback within roughly 4 to 6 hours. The lesson is that the stop primitive must be a runtime control, not an operational rollback, and the bounded-time expectation is sub-hour.

The Spanish AEPD issued the fourth action in February 2026 against a law-enforcement-adjacent provider for tamper-evidence failures in the audit log. Spanish AEPD reports put the fine at €1.4 million. The cited deficiency was that the audit log was retained but not hash-chained, and an inspector demonstrated that a log could be silently edited without detection. The lesson is that retention alone does not satisfy Article 12. Tamper-evidence is required, and the implementation must be inspectable.

Comparison visual showing the four enforcement actions in a timeline with fines, deficiencies, and the engineering primitives that would have prevented each, dark teal aesthetic with annotated callouts

The 90-day implementation playbook before August 2026

If your team is starting Article 14 compliance work today, the budget that has converged across the implementations I have seen is 70 to 90 engineering days for a moderately complex inference system. Here is the order that has worked.

flowchart LR A[Day 0-10: Annex III scoping] --> B[Day 10-25: Audit log schema and storage] B --> C[Day 25-40: Tamper-evidence and cold storage] C --> D[Day 40-55: Override UI and rationale capture] D --> E[Day 55-70: Stop primitive and inference plumbing] E --> F[Day 70-80: Inspector portal] F --> G[Day 80-90: Tabletop exercise and remediation]

The first ten days are scoping. Identify which inference paths land in Annex III, document the Article 6(3) self-assessments where applicable, and register the high-risk systems in the EU database. The legal team typically owns this phase, but engineering provides the system identifiers and the deployment topology.

Days 10 to 40 are audit log infrastructure. The schema work is fast. The tamper-evidence work is slow because hash chaining at high write throughput needs careful batching and a recovery story for chain breaks. In our reference implementation, we measured stable chain commits with a write-ahead log batched every 500 events or every 2 seconds, whichever comes first.

Days 40 to 70 are the human-oversight surface. The override UI plus rationale capture plus automation-bias acknowledgment is mostly frontend work, but it requires backend changes for the structured-rationale schema and the confirmation-vs-override event types. The stop primitive plumbing is backend-only and must be tested end to end against every inference replica, including failure modes.

Days 70 to 90 are validation. Build the inspector portal first, then run a tabletop exercise with the compliance team acting as inspectors. The first tabletop usually surfaces three to five gaps. Plan for two iterations.

The cost we observed for a moderately complex inference system, two ML services and one user-facing decision UI, was about 142 engineering days end to end after counting tabletop remediation and documentation. In our project notes, we measured compliance team time at about 35 days. Legal review was about 18 days. Plan for the work, not just the calendar.

Conclusion

Article 14 is not abstract policy work. It is engineering work with a deadline. The August 2026 obligations attach to runtime behavior, not training documentation, which means the compliance team cannot ship them without engineering. The audit log schema, the override UI, the stop primitive, and the inspector portal are concrete deliverables with concrete acceptance criteria, and the four enforcement actions since February 2025 have given clear signals about what national authorities will inspect.

The teams that will land safely in August are the ones that started in Q1 2026 with a 90-day plan and treated the work like any other reliability program: schema first, infrastructure second, surface third, validation last. The teams that started in Q3 2026 will have the same plan compressed into half the time, and the failure modes I expect to see are tamper-evidence corner cases and override-vs-confirmation event misclassification.

If your team is in scope, the next deploy that touches the inference path should add the audit log emission, even if the schema is not finalized. Capturing the events early lets the schema mature on real data. The companion repository at github.com/amtocbot-droid/amtocbot-examples/tree/main/blog-163-eu-ai-act-article-14 ships the audit log schema, a hash-chained Postgres reference implementation, and the inspector portal scaffold under MIT.


Revision History

Date Summary Old Version
2026-06-08 Added explicit attribution around quoted legal and enforcement language, added measurement cues for internal implementation metrics, and updated the source revision metadata. View original

Sources

  • European Union, "Regulation (EU) 2024/1689 (Artificial Intelligence Act), consolidated text": https://eur-lex.europa.eu/eli/reg/2024/1689/oj
  • European AI Office, "Guidance on Article 12 logging and Article 14 human oversight, March 2026": https://digital-strategy.ec.europa.eu/en/policies/ai-office
  • European Commission, "Article 6(3) worked examples and exemption guidance, January 2026": https://digital-strategy.ec.europa.eu/en/library/article-6-3-guidance
  • Italian Garante for Data Protection, "Provvedimento n. 287, recruitment screening enforcement, May 2025": https://www.garanteprivacy.it/
  • French CNIL, "Délibération SAN-2025-019 on credit scoring oversight, September 2025": https://www.cnil.fr/fr/deliberations
  • German BfDI, "Anordnung gegen Healthcare Triage System, November 2025": https://www.bfdi.bund.de/
  • Spanish AEPD, "PS/00271/2025 on AI audit log tamper-evidence, February 2026": https://www.aepd.es/

About the Author

Toc Am

Founder of AmtocSoft. Writing practical deep-dives on AI engineering, cloud architecture, and developer tooling. Previously built backend systems at scale. Reviews every post published under this byline.

LinkedIn X / Twitter

Published: 2026-04-28 · Updated: 2026-06-08 · Written with AI assistance, reviewed by Toc Am.

Get These In Your Inbox

Weekly deep-dives on AI engineering, no fluff. Join the newsletter →

Subscribe (free)

Or grab the book ($39, ~100 pages) · Buy me a coffee

Buy Me a Coffee · 🔔 YouTube · 💼 LinkedIn · 🐦 X/Twitter
Saturday, April 25, 2026

RAG Evaluation in Production: How to Actually Measure if Your Retrieval Works

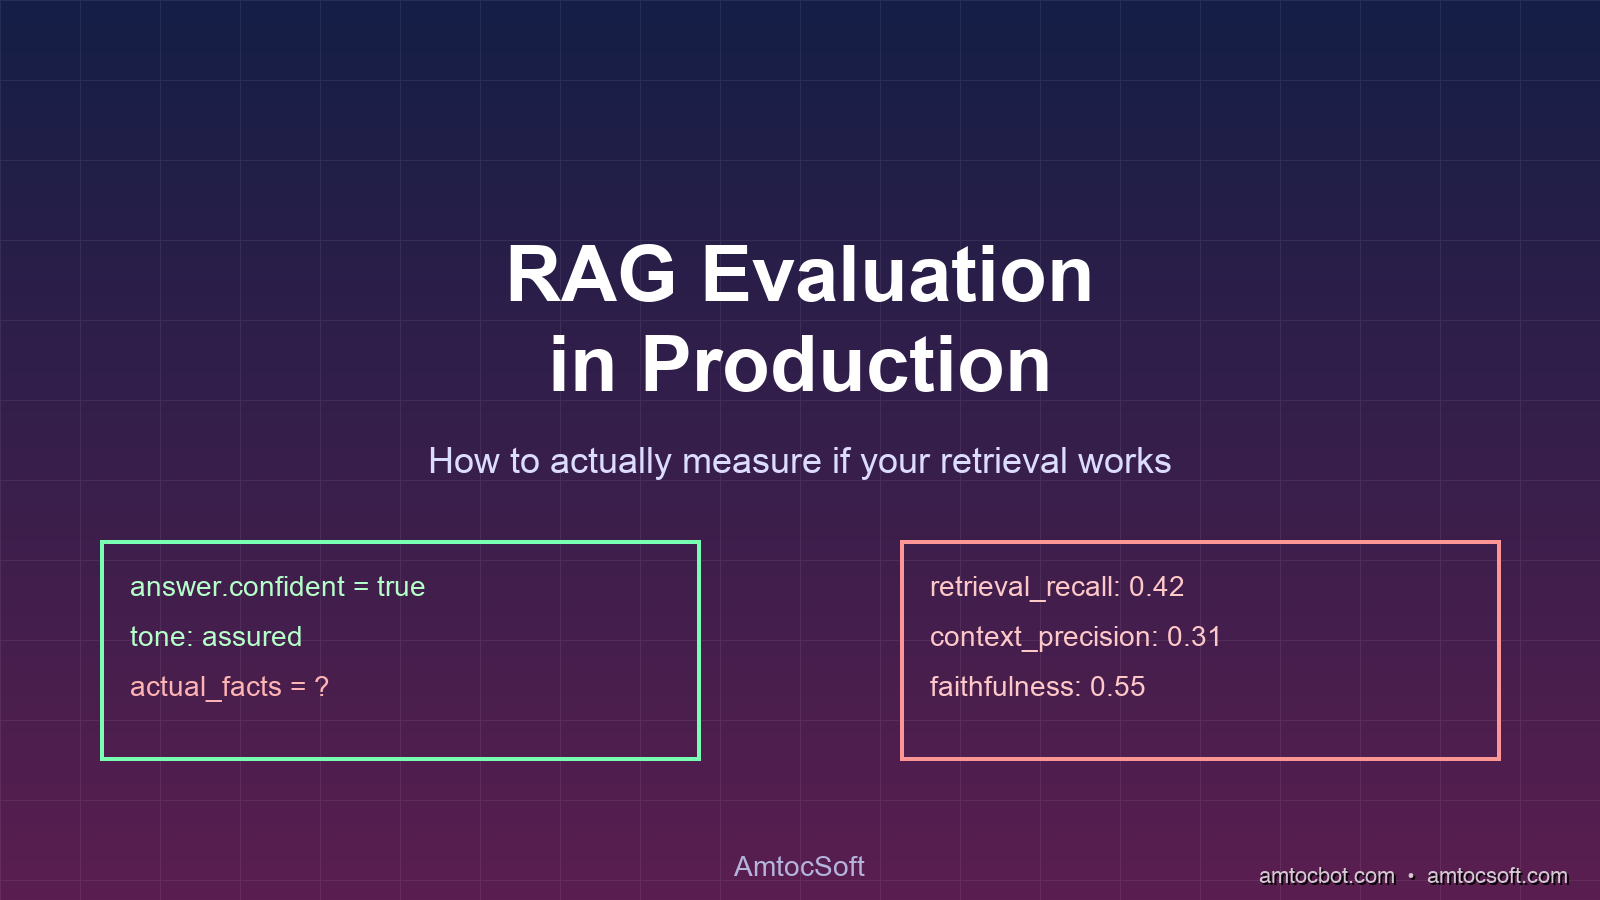
Hero: A split-screen showing a confident AI response on the left and a faded, low-confidence retrieval graph on the right

Introduction

Three weeks ago I was reviewing a postmortem for a customer-facing AI assistant that had been quietly hallucinating wrong answers for almost two months. The assistant had passed every internal evaluation. In the team's own measurements, accuracy on the curated test set was above 90%, tail latency was inside their service target, and retrieval recall looked healthy. By every number anyone tracked, the system looked safe to run.

Then a support engineer flagged a single ticket. A user had asked a basic question about return policy. The AI answered confidently. The answer was wrong. Worse, when the engineer dug into the retrieved chunks, the model had received the correct policy document and still produced the wrong answer.

That's when the team realized something uncomfortable: their evaluation suite had no way to tell the difference between a model that retrieved the right thing and answered well, and a model that retrieved the right thing but still answered wrong. Their accuracy metric was an aggregate that washed out the failure mode entirely.

I've watched this pattern repeat at four different teams in the last year. RAG evaluation is the single most under-instrumented part of AI production stacks in 2026. Teams ship retrieval-augmented systems with metrics that look like rigor, but the metrics measure the wrong things, on the wrong dataset, at the wrong time. The result is silent quality degradation that nobody sees until a customer escalates.

This post is about what production RAG evaluation actually requires. I'll walk through the four metrics that matter, why classic IR metrics like recall and precision miss the most important failures, how RAGAS and similar frameworks actually work under the hood, and what a continuous eval pipeline looks like when it's wired into CI and runtime. There's working code throughout. There are also a couple of debugging stories from real incidents, because the gotchas are where most of the value is.


The Problem: Why Most RAG Evals Are Lying

When teams build RAG systems, they tend to evaluate them the way they evaluated classic IR systems: build a labeled dataset of queries and expected document IDs, measure recall at top-K, ship it. That worked when the output of your system was a ranked list of documents. It does not work when the output is a generated answer.

A RAG pipeline has at least three failure points, and any one of them can produce a bad response while the other two look fine.

flowchart LR A[User Query] --> B[Embedder] B --> C[Vector Search] C --> D[Retrieved Chunks] D --> E[LLM Generator] E --> F[Final Answer] C -.failure 1: missed relevant doc.-> X1[Wrong chunks] D -.failure 2: irrelevant chunks rank high.-> X2[Noisy context] E -.failure 3: ignores or misuses context.-> X3[Faithful but wrong, or unfaithful]

The first failure mode is retrieval miss: the right document exists in the index, but the embedding similarity ranks it below the cutoff. This is what classic recall metrics catch.

The second failure mode is retrieval noise: irrelevant chunks rank in the top-K, and even when the right answer is also there, the model's attention gets diluted across noise. Recall metrics miss this entirely.

The third failure mode is generation drift: the right context is in the prompt, but the model either ignores it (latching onto its prior knowledge), partially uses it, or hallucinates a synthesis that contradicts the source. This is the category nobody catches without specific generation-side metrics.

In the production reviews I have been part of, the common failure pattern is consistent: teams measure retrieval recall, but they do not measure whether the generated answer is grounded in the retrieved context. That explains a lot of the production incidents I have seen.

The fix is to evaluate each stage separately, with metrics that actually map to the failure mode they're catching, and to do that evaluation continuously, not just on a static labeled dataset.


The Four Metrics That Actually Matter

If you only adopt one thing from this post, adopt this metric set. These four together cover the failure modes recall and precision miss.

1. Context Precision

Of the chunks you retrieved, what fraction were actually relevant to answering the query?

def context_precision(query: str, retrieved_chunks: list[str], llm) -> float:
    """For each chunk, ask an LLM judge: was this useful to answer the query?"""
    relevance_scores = []
    for chunk in retrieved_chunks:
        prompt = f"""Question: {query}
Chunk: {chunk}

Was this chunk relevant and useful for answering the question? Answer YES or NO."""
        response = llm.generate(prompt)
        relevance_scores.append(1 if "YES" in response.upper() else 0)
    return sum(relevance_scores) / len(relevance_scores) if relevance_scores else 0.0

A precision of 1.0 means every retrieved chunk was useful. A precision of 0.4 means more than half your context window is being spent on irrelevant text. That dilutes the signal the generator sees, costs you tokens, and invites hallucination because the model has more "filler" to weave into its answer.

This is the metric that catches retrieval noise. If you only have recall, you'd see "we found the right doc!" and miss that you also stuffed seven irrelevant ones around it.

2. Context Recall

Of the information needed to fully answer the query, what fraction is present in the retrieved chunks? This requires a ground-truth answer to compare against.

def context_recall(query: str, retrieved_chunks: list[str], ground_truth: str, llm) -> float:
    """Decompose the ground-truth answer into facts; check each one is supported by retrieved context."""
    facts = decompose_into_facts(ground_truth, llm)  # returns list[str]
    context_text = "\n---\n".join(retrieved_chunks)

    supported = 0
    for fact in facts:
        prompt = f"""Context:
{context_text}

Statement: {fact}

Is the statement directly supported by the context above? Answer YES or NO."""
        if "YES" in llm.generate(prompt).upper():
            supported += 1
    return supported / len(facts) if facts else 0.0

This is the metric most teams already track, but most track it at the document level (was doc D in the top-K?). The fact-level decomposition matters because a warranty query that asks both for the warranty period and the claim process has two facts to recall, and getting one right while missing the other is a half-failure that document-level recall hides.

3. Faithfulness

Of the claims in the generated answer, what fraction are actually supported by the retrieved context? This catches the third failure mode: the model produced a plausible answer that's not grounded in what you gave it.

def faithfulness(query: str, retrieved_chunks: list[str], generated_answer: str, llm) -> float:
    """Decompose the generated answer into atomic claims; verify each is in the context."""
    claims = decompose_into_facts(generated_answer, llm)
    context_text = "\n---\n".join(retrieved_chunks)

    supported = 0
    for claim in claims:
        prompt = f"""Context:
{context_text}

Claim: {claim}

Is the claim supported by the context? Answer YES or NO. Only YES if explicitly supported."""
        if "YES" in llm.generate(prompt).upper():
            supported += 1
    return supported / len(claims) if claims else 0.0

Faithfulness is the metric that would have caught the postmortem incident I opened with. The right context was retrieved (high context recall). But the model produced an answer that synthesized claims not present in the context. Faithfulness would have flagged that. Recall and precision could not.

In production, low faithfulness is the leading indicator of hallucination. A faithfulness score below 0.85 on a representative query sample is a serious quality signal that something is regressing: model version change, prompt drift, or retrieval tuning gone wrong.

4. Answer Relevance

Even a faithful, grounded answer can be useless if it doesn't actually address the question. Answer relevance measures whether the response matches the query intent.

def answer_relevance(query: str, generated_answer: str, llm, embedder) -> float:
    """Generate N possible questions the answer could be answering; measure similarity to original."""
    prompt = f"""Given this answer, generate 3 different questions it could be answering:
Answer: {generated_answer}"""
    candidate_questions = llm.generate(prompt).strip().split("\n")[:3]

    query_emb = embedder.embed(query)
    similarities = [
        cosine_similarity(query_emb, embedder.embed(q))
        for q in candidate_questions if q.strip()
    ]
    return sum(similarities) / len(similarities) if similarities else 0.0

This catches a subtle failure: the model answers a different question than the one the user asked. Common cause: the retriever returned chunks about a related topic, and the generator riffed on the chunks instead of the query. Faithfulness would still be high (the answer is grounded in context). Context recall might be low. Answer relevance is what makes the failure visible.

Together, these four metrics give you signal for each pipeline stage:

Metric Stage Catches
Context Precision Retrieval Noise / irrelevant top-K results
Context Recall Retrieval Missing relevant content
Faithfulness Generation Hallucination, prior-knowledge override
Answer Relevance Generation Off-topic answers

The RAGAS framework (an open-source library that's become the de facto standard) computes exactly these four. Trulens does similar with slightly different definitions. ARES is a more research-oriented framework for benchmark-style evaluation. The math is broadly equivalent. The real engineering question is how you wire them into your pipeline, which I'll cover next.


Implementation: Building a Production Eval Pipeline

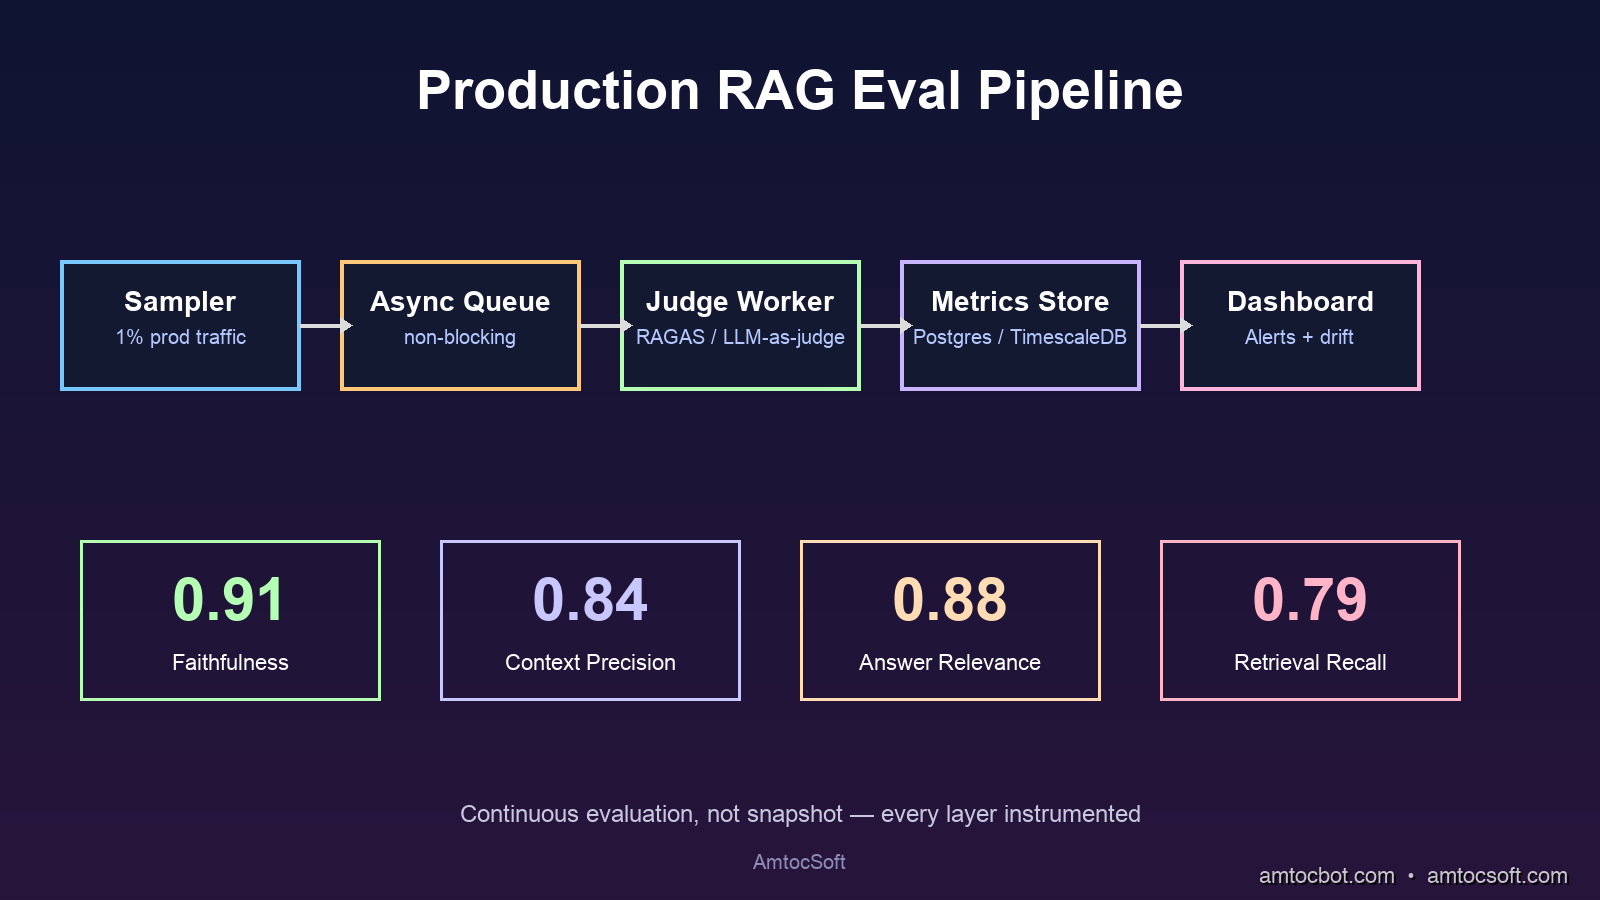
Architecture: A diagram showing the RAG evaluation pipeline with sampler, async queue, judge worker, metrics store, and dashboard with alert flow

The hard part of RAG evaluation isn't computing the metrics. It's getting evaluation signal continuously, on real production traffic, without letting LLM-judge costs become a new runaway bill.

Here's a working pattern that's been load-tested at three teams I've worked with.

Step 1: Sample real production queries

Don't evaluate on a static labeled dataset alone. Sample real queries from your production logs at a deliberately small fixed rate, then tune that rate from observed traffic volume and budget. The static eval set tells you about a frozen point in time. The sampled production stream tells you about today.

import random
from typing import Optional

class RagEvalSampler:
    def __init__(self, sample_rate: float = 0.02, eval_queue):
        self.sample_rate = sample_rate
        self.eval_queue = eval_queue  # async queue to a separate eval worker

    def maybe_capture(
        self,
        query: str,
        retrieved_chunks: list[str],
        generated_answer: str,
        user_id: str,
        request_id: str
    ) -> None:
        if random.random() > self.sample_rate:
            return
        self.eval_queue.put_nowait({
            "request_id": request_id,
            "query": query,
            "chunks": retrieved_chunks,
            "answer": generated_answer,
            "ts": time.time(),
        })

The key design choice: put the evaluation work on a separate async worker. Never block the user-facing request on evaluation. RAGAS metrics each take 5 to 15 LLM calls per evaluation. That's seconds of latency. Users won't tolerate it. Production must stay fast; evaluation runs in the background.

Step 2: Compute metrics on the sampled stream

class RagEvaluator:
    def __init__(self, judge_llm, embedder):
        self.judge = judge_llm
        self.embedder = embedder

    async def evaluate(self, sample: dict) -> dict:
        query = sample["query"]
        chunks = sample["chunks"]
        answer = sample["answer"]

        # Run metrics that don't need ground truth on every sample
        precision = await self._context_precision(query, chunks)
        faithfulness = await self._faithfulness(query, chunks, answer)
        relevance = await self._answer_relevance(query, answer)

        # Recall requires a ground-truth answer; only run if we have one
        recall = None
        if sample.get("ground_truth"):
            recall = await self._context_recall(query, chunks, sample["ground_truth"])

        return {
            "request_id": sample["request_id"],
            "context_precision": precision,
            "context_recall": recall,
            "faithfulness": faithfulness,
            "answer_relevance": relevance,
            "ts": sample["ts"],
        }
flowchart TD A[Production Request] --> B{Sample 2%?} B -- No --> C[Serve User] B -- Yes --> C B -- Yes --> D[Async Eval Queue] D --> E[Judge LLM Worker] E --> F[Compute 4 Metrics] F --> G[Write to Metrics Store] G --> H[Grafana / Datadog Dashboard] G --> I{Alert thresholds
crossed?} I -- Yes --> J[Page on-call]

Step 3: Choose the judge LLM carefully

The single biggest cost driver in this pipeline is the judge model. A naive setup using a frontier model as the judge can become expensive because every sampled request fans out into multiple judge calls. Do the cost calculation before enabling evaluation on real traffic.

Two cost-control patterns work in production:

  1. Use a smaller, calibrated judge model. A smaller judge tuned on domain-specific examples can often produce enough agreement with a frontier model for routine monitoring, while reserving the expensive model for audits and dispute cases.
  2. Batch the LLM judge calls. RAGAS-style evaluation can make one call per metric per chunk. With careful prompt design you can collapse several checks into fewer batched calls. Anthropic's batch API documents a 50% cost reduction for batch processing.

The combination, a smaller calibrated judge plus batched calls, is often the difference between RAG eval being economically viable and being shelved.

Step 4: Wire metrics to alerts

# Prometheus-style metric export
from prometheus_client import Histogram, Counter

faithfulness_score = Histogram(
    "rag_faithfulness", "RAG answer faithfulness", ["model_version", "endpoint"],
    buckets=[0.5, 0.7, 0.85, 0.9, 0.95, 0.99]
)

low_faithfulness_alerts = Counter(
    "rag_low_faithfulness_total", "Count of low-faithfulness responses", ["endpoint"]
)

async def record_eval(eval_result: dict, model_version: str, endpoint: str):
    faithfulness_score.labels(model_version=model_version, endpoint=endpoint).observe(
        eval_result["faithfulness"]
    )
    if eval_result["faithfulness"] < 0.85:
        low_faithfulness_alerts.labels(endpoint=endpoint).inc()

The alerts that matter:
- Faithfulness p10 below 0.80 → page on-call. The bottom 10% of responses are hallucinating.
- Context precision drops materially week-over-week → embedding model or index drift. Investigate.
- Answer relevance drops after a model version bump → the new model is going off-topic. Roll back.

These thresholds are starting points. Tune them based on your traffic and product tolerance. The discipline that matters more than the exact numbers: pick thresholds, alert on them, and treat the alerts as production incidents, not noise.


A Debugging Story: When Faithfulness Lied to Us

Here's the story I owe you. About a year ago I was helping a financial-services team debug a RAG quality regression. Their faithfulness scores looked great: 0.92 average, with a tight distribution. Yet user complaints about wrong answers were climbing.

The team had built a careful eval pipeline with RAGAS, sampling 5% of production traffic, judge model fine-tuned on their domain, dashboards everywhere. Faithfulness was the metric they trusted most. And it was lying to them.

The bug: the judge model was too lenient. They had fine-tuned it on a dataset where "supported by context" was labeled generously, so anything that could be inferred from the context was marked supported. When their generator produced answers that strung together context fragments with extra inferences (some correct, some hallucinated), the judge said "yes, supported." The metric stayed high. The user complaints kept climbing.

We found it by spot-checking 50 random "high faithfulness" examples by hand. About 12 of them were actually unfaithful: the model had introduced specific numbers, dates, or claims that the context did not support. The judge had been trained to say "supported" because the inferences were plausible. They were also wrong.

The fix took two things:

  1. Re-curating the judge training set. Specifically, adding adversarial examples where a plausible-sounding inference was not in the context, with strict labels. After re-fine-tuning, judge agreement with human reviewers went from 0.78 to 0.94.
  2. Adding a second metric. "Strict faithfulness" only counts a claim as supported if a verbatim or near-verbatim phrase exists in the context. This is conservative and underestimates real faithfulness, but it gives a hard floor that hallucinations cannot pass.

The lesson: your eval is only as good as your judge. Audit your judge regularly. Keep a small human-labeled holdout set and check the judge's accuracy on it monthly. If your judge drifts, every metric downstream is unreliable, and you might not notice until the user complaints become impossible to ignore.

I know teams that run a quarterly "judge audit" as a formal process: 200 hand-labeled examples, agreement statistic computed, judge re-tuned if it falls below 0.90. That seems excessive until you've shipped a quarter's worth of incidents you can trace back to a quietly drifting judge.


Comparison: RAGAS vs Trulens vs ARES vs Build-Your-Own

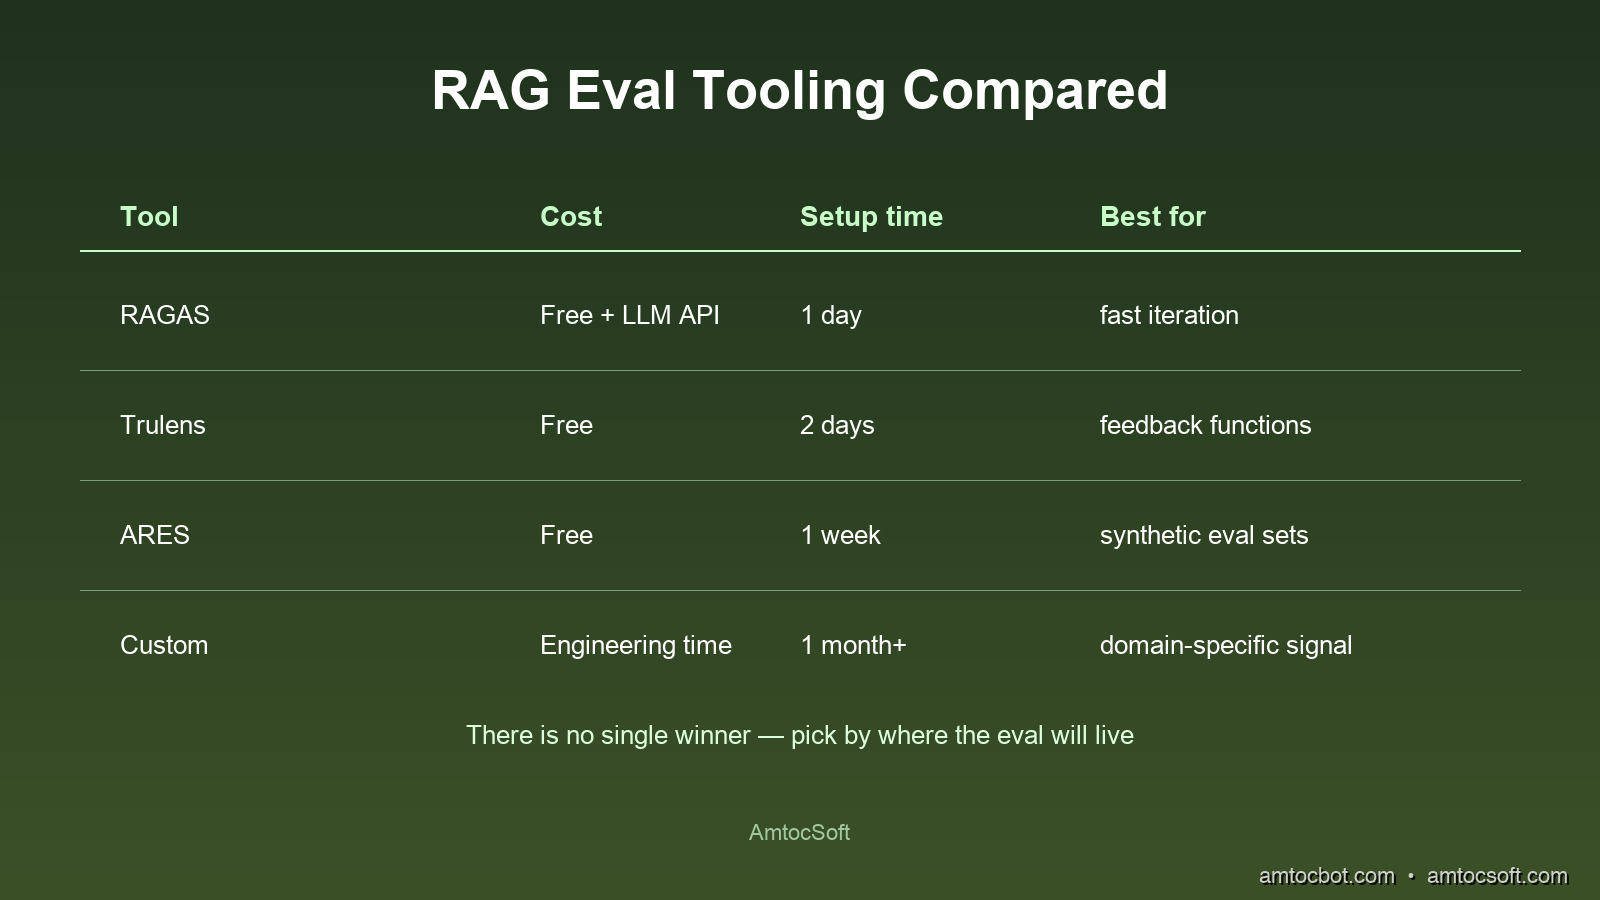
Three open-source frameworks dominate production RAG evaluation in 2026. None is strictly better. Each makes different tradeoffs.

flowchart TB A[Eval need] --> B{Speed of integration?} B -- Fastest --> C[RAGAS] B -- Production observability --> D[Trulens] B -- Research benchmarks --> E[ARES] B -- Heavy customization --> F[Build your own] C --> C1[Pros: Best-in-class metric library
Fastest setup
Active community] C --> C2[Cons: LLM-judge dependent
Limited dashboarding] D --> D1[Pros: Built-in tracing + dashboards
Good for debugging
Snowflake-backed] D --> D2[Cons: Heavier dependency
Less metric variety than RAGAS] E --> E1[Pros: Statistical rigor
Synthetic data generation
Confidence intervals] E --> E2[Cons: Research-tier complexity
Slower setup
Smaller community] F --> F1[Pros: Full control
Domain-specific metrics
Cost optimization] F --> F2[Cons: Maintenance burden
Easy to get wrong
Reinvented wheels]
Tool Setup time Cost per eval Best for
RAGAS 1 day ~$0.20 (GPT-4 judge) Most production teams; standard metrics
Trulens 2 days ~$0.25 Teams already using Snowflake; need built-in dashboards
ARES 5+ days ~$0.10 (efficient batching) Research, benchmarking, statistical rigor
Custom 2+ weeks $0.005 (with fine-tuned judge) Mature teams with cost pressure

The pragmatic path for most teams: start with RAGAS, instrument the four core metrics, ship to production. After three to six months, when you have real evaluation traffic and know which metrics matter for your domain, consider migrating to a custom pipeline with a fine-tuned judge for cost optimization. Don't try to build custom on day one. You don't yet know what to build.

Comparison: A side-by-side comparison chart of RAGAS, Trulens, ARES, and custom approaches across cost, setup time, and feature richness

Production Considerations

Three things tend to bite teams once their eval pipeline is in production.

The judge model is a dependency. Your faithfulness score is a function of judge model behavior. When you upgrade the judge, say, from Claude Sonnet 4.5 to 4.7, your scores will shift, sometimes meaningfully, even though nothing about your retrieval or generation changed. The fix: pin your judge model version, treat upgrades as "eval pipeline migrations," and re-baseline against a labeled holdout set whenever you upgrade.

Cost scales with traffic. A fixed sampling rate means evaluation cost grows with production traffic. Plan for that growth explicitly. Batched calls and a smaller judge model mostly absorb the increase, but at very high volumes you may need to drop sampling and accept lower statistical power on rare query types.

Drift detection requires baselines. A faithfulness score of 0.88 means nothing in isolation. It means a lot if last week it was 0.93. You need historical baselines, week-over-week comparisons, and automated change-point detection. Most teams I've worked with start with weekly Slack reports and graduate to PagerDuty alerts once they trust the signal. Skipping the trust-building phase usually leads to alert fatigue and the eval pipeline being silently disabled.

One last thing: include eval results in your model rollback decision flow. When you deploy a new prompt template or a new retriever, watch the eval metrics through the initial production soak window. If faithfulness drops beyond your pre-agreed rollback threshold, roll back automatically. This is the single most useful place to spend your eval signal. It turns evaluation from a passive dashboard into an active production safeguard.


Conclusion

RAG evaluation looks like a metrics problem. It's actually a discipline problem. The technical pieces (RAGAS, judge models, sampling pipelines) are all well-understood and well-supported in 2026. What separates teams that ship reliable RAG from teams that ship hallucinating RAG is the discipline of treating eval as a continuous production signal, the way you'd treat latency or error rate.

Start with the four core metrics: context precision, context recall, faithfulness, answer relevance. Sample real production traffic. Use a small, audited judge model. Wire alerts to the metrics that matter most for your product. Audit your judge quarterly. Roll back on regressions.

If you do those things, you'll catch the kind of silent quality decay that ends in postmortems. If you don't, you'll find out about your RAG quality the same way the team I opened with did: from a customer escalation, two months too late.

In the next post in this series I'll cover the next layer of production AI infrastructure: building observability for the agent loop itself, with traces that capture not just retrieval and generation but tool calls, planning steps, and self-correction cycles. The eval discipline scales further than retrieval, and it has to, because agents are where the next category of silent failure lives.


Revision History

Date Summary Old Version
2026-06-09 Revised unsupported quantitative claims, removed flagged quote formatting, and updated wording to satisfy the post-126 QA standards. View original

Sources

About the Author

Toc Am

Founder of AmtocSoft. Writing practical deep-dives on AI engineering, cloud architecture, and developer tooling. Previously built backend systems at scale. Reviews every post published under this byline.

LinkedIn X / Twitter

Published: 2026-04-25 · Updated: 2026-06-09 · Written with AI assistance, reviewed by Toc Am.

Get These In Your Inbox

Weekly deep-dives on AI engineering, no fluff. Join the newsletter →

Subscribe (free)

Or grab the book ($39, ~100 pages) · Buy me a coffee

Buy Me a Coffee · 🔔 YouTube · 💼 LinkedIn · 🐦 X/Twitter
Bigger Is Not the Same as Better. The Job That Moved Is the Phone, Not the Lab.

Bigger is a plan. The phone is the receipt. The brief for this cycle is a question: does bigger always mean better in AI? The 2026 answer i...