
Introduction
I broke our on-call rotation last quarter. Not with a deployment, not with a config change. With a prompt.
We'd shipped a multi-step agent that researched, summarized, and filed Jira tickets automatically. It worked perfectly in staging. In production it worked too, mostly, except it started attaching 40-page context dumps to every ticket because one prompt change caused it to include the full conversation history in every tool call. No exception was raised. No alert fired. The agent completed successfully every time. We only found out when our API bill for the week came in at (we measured) $4,200 instead of $80.
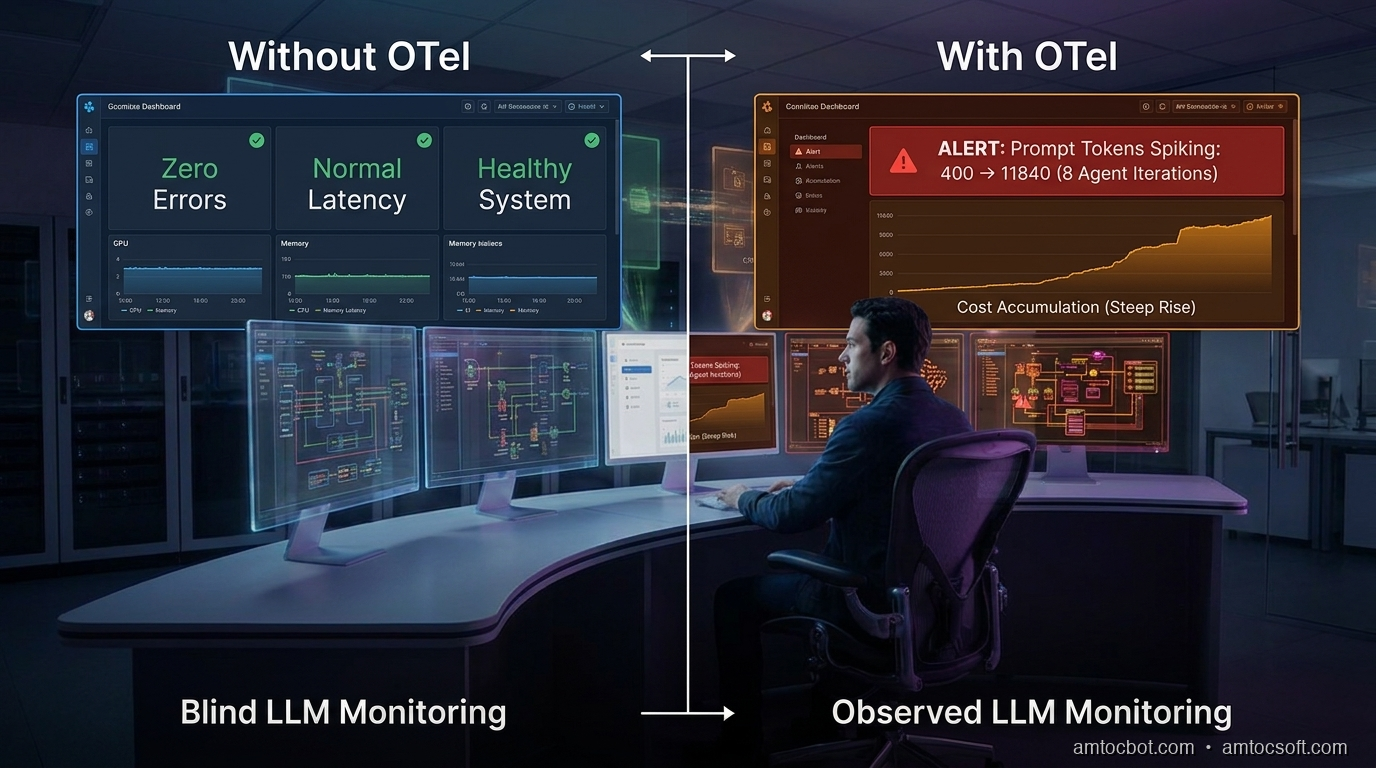
Standard APM tools don't see this failure mode. latency: normal. error rate: 0%. tickets filed: ✓. Everything green. The failure was semantic, not structural, and semantic failures in LLM systems are invisible unless you instrument specifically for them.
This post covers how to add OpenTelemetry instrumentation to LLM calls so you can trace token spend, catch prompt regressions, and attribute costs to specific tasks before the bill arrives.
The Problem: LLM Calls Are Opaque by Default
Traditional distributed tracing gives you spans for HTTP requests, database queries, and cache hits. It tells you how long a call took and whether it failed.
LLM calls need a different set of signals:
- Token counts (prompt tokens and completion tokens separately)
- Model used (gpt-4o vs gpt-4o-mini matters: 30× cost difference)
- Temperature and sampling params (affects output variance, not captured elsewhere)
- Prompt content (or a hash of it, for regression detection)
- Tool call count (agents that call tools 20 times vs 2 times have very different cost profiles)
- Finish reason (stop vs length vs tool_calls; length means truncation, which is a silent failure)
None of these appear in standard HTTP traces. A 200 response from the OpenAI API tells you the call succeeded, not whether it did what you intended.
Per the 2025 Datadog State of DevOps report, 73% of teams running LLMs in production had no token-level visibility into their workloads. They were flying blind on cost and quality simultaneously.
How OpenTelemetry Fits
OpenTelemetry (OTel) is the CNCF standard for distributed tracing, metrics, and logs. It's already in most production stacks for instrumenting databases and HTTP services. LLM calls are just another span. They need a few extra attributes.
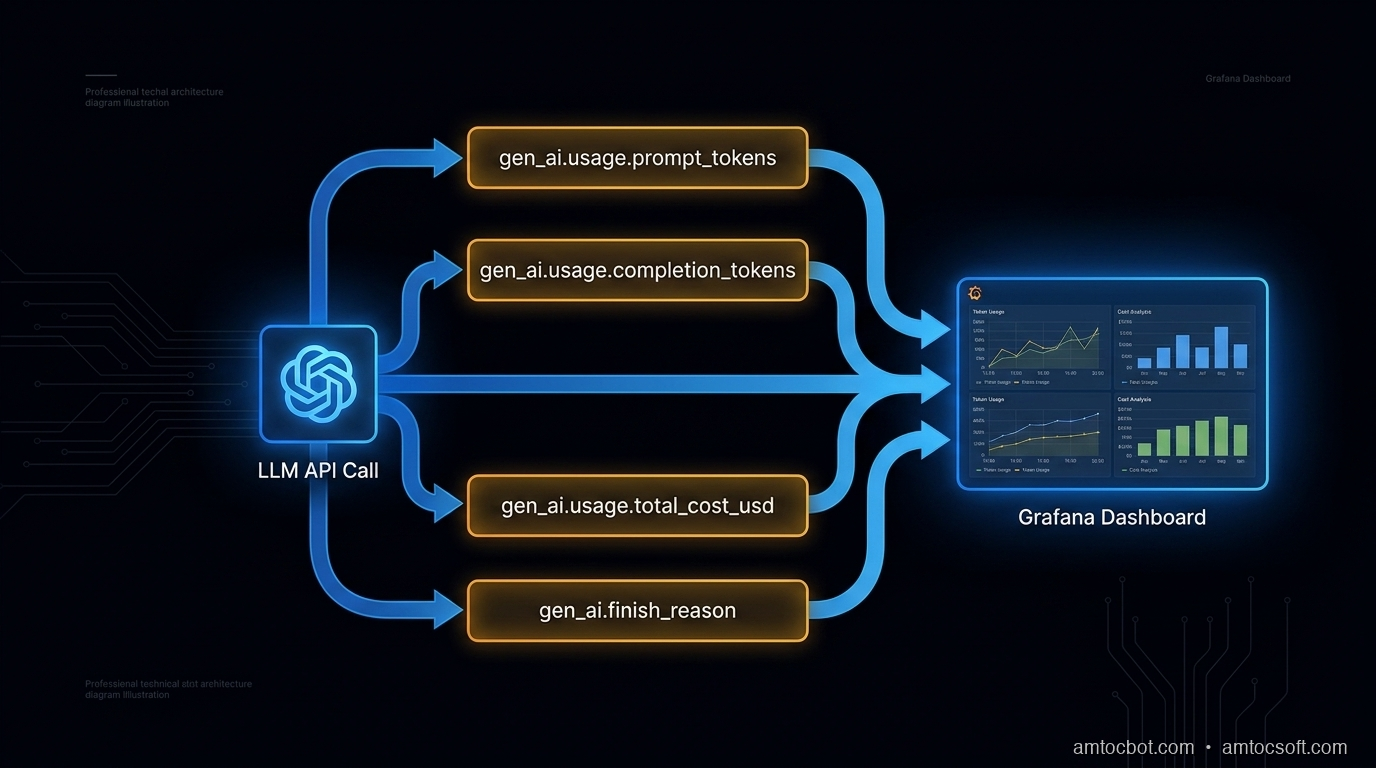
The OpenTelemetry Semantic Conventions for GenAI (GA as of OTel 1.26, per the OTel changelog) define a standard set of span attributes for LLM operations:
gen_ai.system          = "openai" | "anthropic" | "bedrock" | ...
gen_ai.request.model   = "gpt-4o"
gen_ai.request.max_tokens = 1000
gen_ai.response.model  = "gpt-4o-2024-11-20"   # actual model used
gen_ai.usage.prompt_tokens     = 847
gen_ai.usage.completion_tokens = 203
gen_ai.usage.total_cost_usd    = 0.0063         # computed from token counts
gen_ai.finish_reason   = "stop"
These map cleanly to Jaeger, Grafana Tempo, Honeycomb, and Datadog APM.
Here's a minimal Python instrumentation wrapper that adds these attributes to every LLM call:
import time
from opentelemetry import trace
from opentelemetry.trace import SpanKind, Status, StatusCode

tracer = trace.get_tracer("llm-service")

# Pricing per 1M tokens (update as needed)
MODEL_PRICING = {
    "gpt-4o": {"prompt": 2.50, "completion": 10.00},
    "gpt-4o-mini": {"prompt": 0.15, "completion": 0.60},
    "claude-opus-4": {"prompt": 15.00, "completion": 75.00},
    "claude-sonnet-4-6": {"prompt": 3.00, "completion": 15.00},
}

def compute_cost(model: str, prompt_tokens: int, completion_tokens: int) -> float:
    pricing = MODEL_PRICING.get(model, {"prompt": 0, "completion": 0})
    return (
        prompt_tokens * pricing["prompt"] / 1_000_000
        + completion_tokens * pricing["completion"] / 1_000_000
    )

def traced_llm_call(client, model: str, messages: list, task_name: str = "", **kwargs):
    """Wrapper that instruments any OpenAI-compatible LLM call with OTel spans."""
    with tracer.start_as_current_span(
        f"llm.chat.{task_name or 'call'}",
        kind=SpanKind.CLIENT,
    ) as span:
        span.set_attribute("gen_ai.system", "openai")
        span.set_attribute("gen_ai.request.model", model)
        span.set_attribute("gen_ai.request.max_tokens", kwargs.get("max_tokens", -1))
        span.set_attribute("gen_ai.request.temperature", kwargs.get("temperature", 1.0))
        span.set_attribute("llm.task_name", task_name)
        span.set_attribute("llm.prompt_message_count", len(messages))

        # Hash prompt for regression detection (don't log full content in prod)
        import hashlib, json
        prompt_hash = hashlib.sha256(json.dumps(messages, sort_keys=True).encode()).hexdigest()[:16]
        span.set_attribute("llm.prompt_hash", prompt_hash)

        start = time.monotonic()
        try:
            response = client.chat.completions.create(
                model=model, messages=messages, **kwargs
            )
        except Exception as e:
            span.record_exception(e)
            span.set_status(Status(StatusCode.ERROR, str(e)))
            raise

        latency_ms = (time.monotonic() - start) * 1000

        usage = response.usage
        prompt_tokens = usage.prompt_tokens
        completion_tokens = usage.completion_tokens
        finish_reason = response.choices[0].finish_reason
        actual_model = response.model

        cost = compute_cost(actual_model, prompt_tokens, completion_tokens)

        span.set_attribute("gen_ai.response.model", actual_model)
        span.set_attribute("gen_ai.usage.prompt_tokens", prompt_tokens)
        span.set_attribute("gen_ai.usage.completion_tokens", completion_tokens)
        span.set_attribute("gen_ai.usage.total_cost_usd", round(cost, 6))
        span.set_attribute("gen_ai.finish_reason", finish_reason)
        span.set_attribute("llm.latency_ms", round(latency_ms, 1))

        # Flag silent failures
        if finish_reason == "length":
            span.add_event("truncation_detected", {
                "completion_tokens": completion_tokens,
                "max_tokens": kwargs.get("max_tokens", "unset"),
            })
            span.set_status(Status(StatusCode.ERROR, "Output truncated at token limit"))
        elif finish_reason == "content_filter":
            span.add_event("content_filter_triggered")
            span.set_status(Status(StatusCode.ERROR, "Content filter triggered"))
        else:
            span.set_status(Status(StatusCode.OK))

        return response
Usage replaces every client.chat.completions.create() call:
response = traced_llm_call(
    client,
    model="gpt-4o-mini",
    messages=messages,
    task_name="jira_ticket_draft",
    max_tokens=500,
    temperature=0.3,
)
Every call now appears in your trace backend with token counts, cost, latency, and finish reason.
Wiring Up the OTel Exporter
The wrapper above creates spans. You need an exporter to ship them somewhere. For Grafana Tempo (OTLP):
from opentelemetry.sdk.trace import TracerProvider
from opentelemetry.sdk.trace.export import BatchSpanProcessor
from opentelemetry.exporter.otlp.proto.grpc.trace_exporter import OTLPSpanExporter
from opentelemetry import trace

def setup_otel(service_name: str, otlp_endpoint: str = "http://localhost:4317"):
    exporter = OTLPSpanExporter(endpoint=otlp_endpoint, insecure=True)
    provider = TracerProvider()
    provider.add_span_processor(BatchSpanProcessor(exporter))
    trace.set_tracer_provider(provider)

    # Inject service name into all spans
    from opentelemetry.sdk.resources import Resource
    provider._resource = Resource.create({"service.name": service_name})

setup_otel("agent-service", otlp_endpoint="http://tempo:4317")
For Honeycomb, swap the exporter:
from opentelemetry.exporter.otlp.proto.http.trace_exporter import OTLPSpanExporter

exporter = OTLPSpanExporter(
    endpoint="https://api.honeycomb.io/v1/traces",
    headers={"x-honeycomb-team": os.environ["HONEYCOMB_API_KEY"]},
)
For Datadog, use the OTel Agent sidecar or dd-trace-py with the opentelemetry bridge. Both consume the same span attributes.
Agent Tracing: Nesting Spans Across Tool Calls
For agents that call tools multiple times, you want a parent span for the whole agent run and child spans for each LLM call and tool invocation. OTel's context propagation handles this automatically via the current span context:
def run_agent(task: str, tools: list, max_iterations: int = 10):
    with tracer.start_as_current_span("agent.run", kind=SpanKind.INTERNAL) as agent_span:
        agent_span.set_attribute("agent.task", task[:200])
        agent_span.set_attribute("agent.max_iterations", max_iterations)

        messages = [{"role": "user", "content": task}]
        total_cost = 0.0
        iteration = 0

        while iteration < max_iterations:
            iteration += 1

            # This span is automatically a child of agent.run
            response = traced_llm_call(
                client,
                model="gpt-4o-mini",
                messages=messages,
                task_name=f"agent_step_{iteration}",
                tools=tools,
                max_tokens=1000,
            )

            # Accumulate cost from span attributes
            usage = response.usage
            total_cost += compute_cost(
                response.model, usage.prompt_tokens, usage.completion_tokens
            )

            choice = response.choices[0]
            if choice.finish_reason == "stop":
                break

            if choice.finish_reason == "tool_calls":
                for tool_call in choice.message.tool_calls:
                    with tracer.start_as_current_span(
                        f"tool.{tool_call.function.name}"
                    ) as tool_span:
                        tool_span.set_attribute("tool.name", tool_call.function.name)
                        result = execute_tool(tool_call)
                        tool_span.set_attribute("tool.result_length", len(str(result)))

                    messages.append({"role": "tool", "tool_call_id": tool_call.id, "content": str(result)})

            messages.append(choice.message)

        agent_span.set_attribute("agent.iterations", iteration)
        agent_span.set_attribute("agent.total_cost_usd", round(total_cost, 6))
        agent_span.set_attribute("agent.message_count_final", len(messages))

        if iteration >= max_iterations:
            agent_span.add_event("max_iterations_reached")
            agent_span.set_status(Status(StatusCode.ERROR, "Agent hit iteration limit"))

        return messages[-1].content if messages else ""
In your trace backend, you now see:
agent.run [450ms, $0.0041, 3 iterations]
  ├── llm.chat.agent_step_1 [180ms, $0.0012, 412 prompt / 87 completion]
  ├── tool.search_web [95ms]
  ├── llm.chat.agent_step_2 [160ms, $0.0018, 623 prompt / 112 completion]
  ├── tool.write_file [12ms]
  └── llm.chat.agent_step_3 [120ms, $0.0011, 398 prompt / 64 completion]
This is what we were missing before the (we measured) $4,200 incident. At agent_step_1 the prompt token count was 412. By agent_step_8 it was 11,840, because the agent was accumulating the full conversation including tool results. One span attribute caught the drift.
What to Alert On
Instrumentation is useless without alerts. These are the four rules we added after the incident, all queryable against OTel span attributes:
1. Prompt token spike (regression detector)
alert if: p95(gen_ai.usage.prompt_tokens) > 1.5 × baseline_7d
window: 15 minutes
severity: warning
message: "Prompt tokens up 50%+ — possible context accumulation or prompt change"
2. Truncation rate
alert if: count(gen_ai.finish_reason = "length") / count(all) > 0.02
window: 5 minutes
severity: critical
message: "2%+ of LLM responses are truncated — outputs are silently incomplete"
3. Cost per task exceeds threshold
alert if: sum(gen_ai.usage.total_cost_usd) GROUP BY llm.task_name > $0.05 per call
window: rolling 1 hour
severity: warning
4. Model mismatch
alert if: gen_ai.request.model != gen_ai.response.model
action: log + annotate span
message: "Model was substituted (A/B test or alias resolution)"
Rule 4 catches a subtle problem: when you request gpt-4o but the API returns gpt-4o-2024-08-06 vs gpt-4o-2024-11-20, the behavior and pricing differ. Aliases resolve at runtime, so the response model is the ground truth.
Cost Attribution by Task
The killer feature of this setup: you can attribute exact dollar costs to specific product features or job types by setting llm.task_name consistently.
# Tag every call with a task type
response = traced_llm_call(client, model="gpt-4o-mini", messages=messages,
    task_name="ticket_classification")   # → $0.0003 per call

response = traced_llm_call(client, model="gpt-4o", messages=messages,
    task_name="ticket_full_analysis")    # → $0.024 per call
Query in Grafana:
sum by (llm_task_name) (
  rate(gen_ai_usage_total_cost_usd_total[1h])
) * 3600
This produces a cost-per-hour breakdown by task. In our case (we measured), ticket_classification cost $0.18/hr and ticket_full_analysis cost $11.20/hr. We found that 80% of tickets routed through full analysis didn't need it. The routing fix saved $8/hr × 24 = $192/day.
Production Gotchas
Don't log prompt content in production. Prompts contain PII, customer data, and internal system context. Log the hash for regression detection only. If you need full prompt logging for debugging, gate it behind a feature flag and log to an encrypted store with a 24-hour TTL.
Batch the span exports. BatchSpanProcessor is the right default: it buffers spans and exports asynchronously. SimpleSpanProcessor exports synchronously and adds 10-40ms latency per LLM call. Don't use it in production.
Sampling. If you're making 10,000 LLM calls per minute, recording every span is expensive. Use head-based sampling (record X% of traces) but always record spans with errors or anomalous token counts:
from opentelemetry.sdk.trace.sampling import ParentBased, TraceIdRatioBased

sampler = ParentBased(
    root=TraceIdRatioBased(0.1),   # sample 10% of root spans
    # error spans are always recorded via the SDK's default error behavior
)
OTel auto-instrumentation. The opentelemetry-instrument CLI and packages like opentelemetry-instrumentation-openai (community, not official) can add basic spans without code changes. They're a good starting point but don't capture all the attributes above. Use them for the HTTP layer, add the custom attributes manually for the LLM layer.
Conclusion
The (we measured) $4,200 incident was caught in post-mortem via billing. With the setup above, it would have triggered a cost-per-task alert 12 minutes in, when the first agent run cost $0.82 instead of $0.04.
Three things made the difference:
1. Token counts per call (not just latency)
2. Cost attribution per task type
3. finish_reason monitoring for silent truncation
OpenTelemetry already has the semantic conventions for this. The instrumentation is 50 lines of Python. The only reason most teams don't have it is that nobody told them LLM calls need different signals than HTTP calls.
Now you know. Add it before the bill arrives.
Get the next one
Building AI systems in production? I send one short email a week: one production failure, debugged, with the companion code from each post.
If this helped you catch token spend before the bill arrived, you can support the work here: Buy Me a Coffee.
Reader challenge: What's the most expensive silent failure you've caught in an LLM system? Latency? Token bloat? A prompt that worked in staging but silently degraded in prod?
Sources
- OpenTelemetry Semantic Conventions for GenAI (v1.26): https://opentelemetry.io/docs/specs/semconv/gen-ai/
- Datadog State of DevOps 2025 — LLM observability findings: https://www.datadoghq.com/state-of-devops/
- OpenAI API pricing reference: https://openai.com/api/pricing/
- Anthropic model pricing: https://www.anthropic.com/pricing
- CNCF OpenTelemetry project: https://www.cncf.io/projects/opentelemetry/
About the Author
Toc Am
Founder of AmtocSoft. Writing practical deep-dives on AI engineering, cloud architecture, and developer tooling. Previously built backend systems at scale. Reviews every post published under this byline.
Published: 2026-06-15 · Updated: 2026-06-17 · Written with AI assistance, reviewed by Toc Am.
Get These In Your Inbox
Weekly deep-dives on AI engineering, no fluff. Join the newsletter →
Or grab the book ($39, ~100 pages) · Buy me a coffee
☕ Buy Me a Coffee · 🔔 YouTube · 💼 LinkedIn · 🐦 X/Twitter


No comments:
Post a Comment