Sunday, May 31, 2026

AI Coding Tools in 2026: Cursor, Claude Code, Copilot, and Windsurf Compared

Four AI coding tools on a split screen with a developer at the keyboard

Introduction

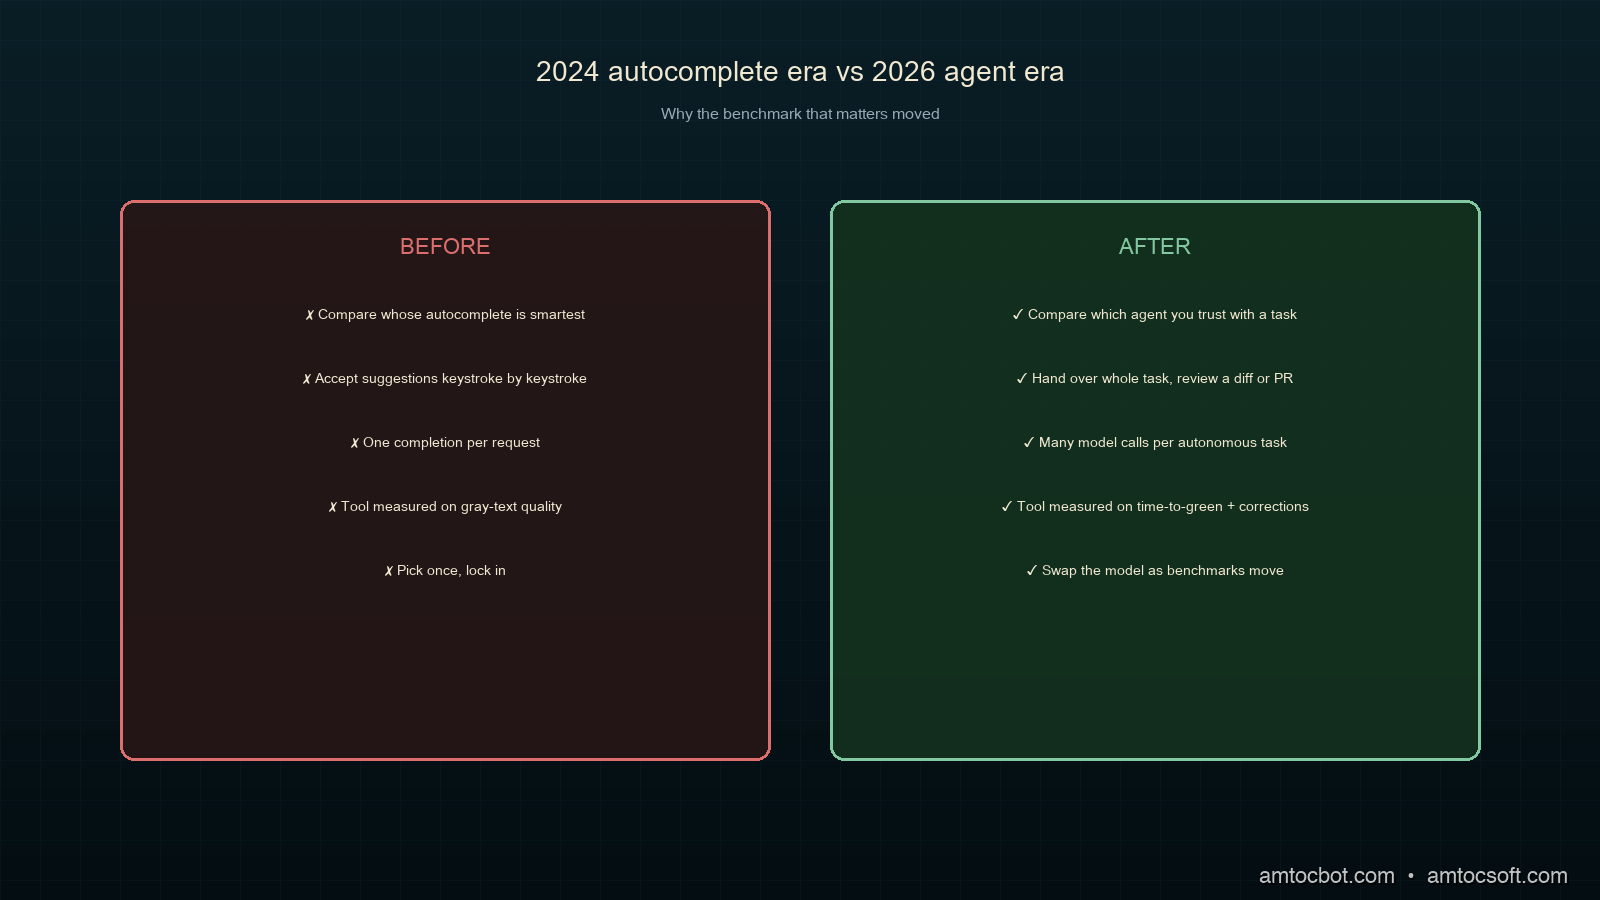
I changed my primary AI coding tool three times in 2026, and each switch taught me the comparisons I had read were asking the wrong question. They benchmarked autocomplete quality, how good the gray suggestion text is, when the thing that actually changed my day was whether the tool could be handed a whole task and trusted to run for twenty minutes across a dozen files without going off the rails. The autocomplete is table stakes now. The agent is the product.

That shift is the backdrop for this comparison. Command-line and in-IDE agents like Claude Code, Cursor's composer, Continue.dev, and Windsurf have moved development from clicking through an editor toward handing work to something that runs autonomously and coordinates changes across many files at once (The New Stack, 2026). The underlying models got dramatically better at this too: on SWE-Bench Verified, a test of resolving real GitHub issues, frontier models climbed from roughly a third of issues in mid-2024 to around 81% by late 2025 (per Hacker News reporting, 2026).

This post compares the four tools most developers are actually choosing between in 2026, on the dimension that matters: how well each one acts as an agent. We will run the same task through all four and see where each wins.

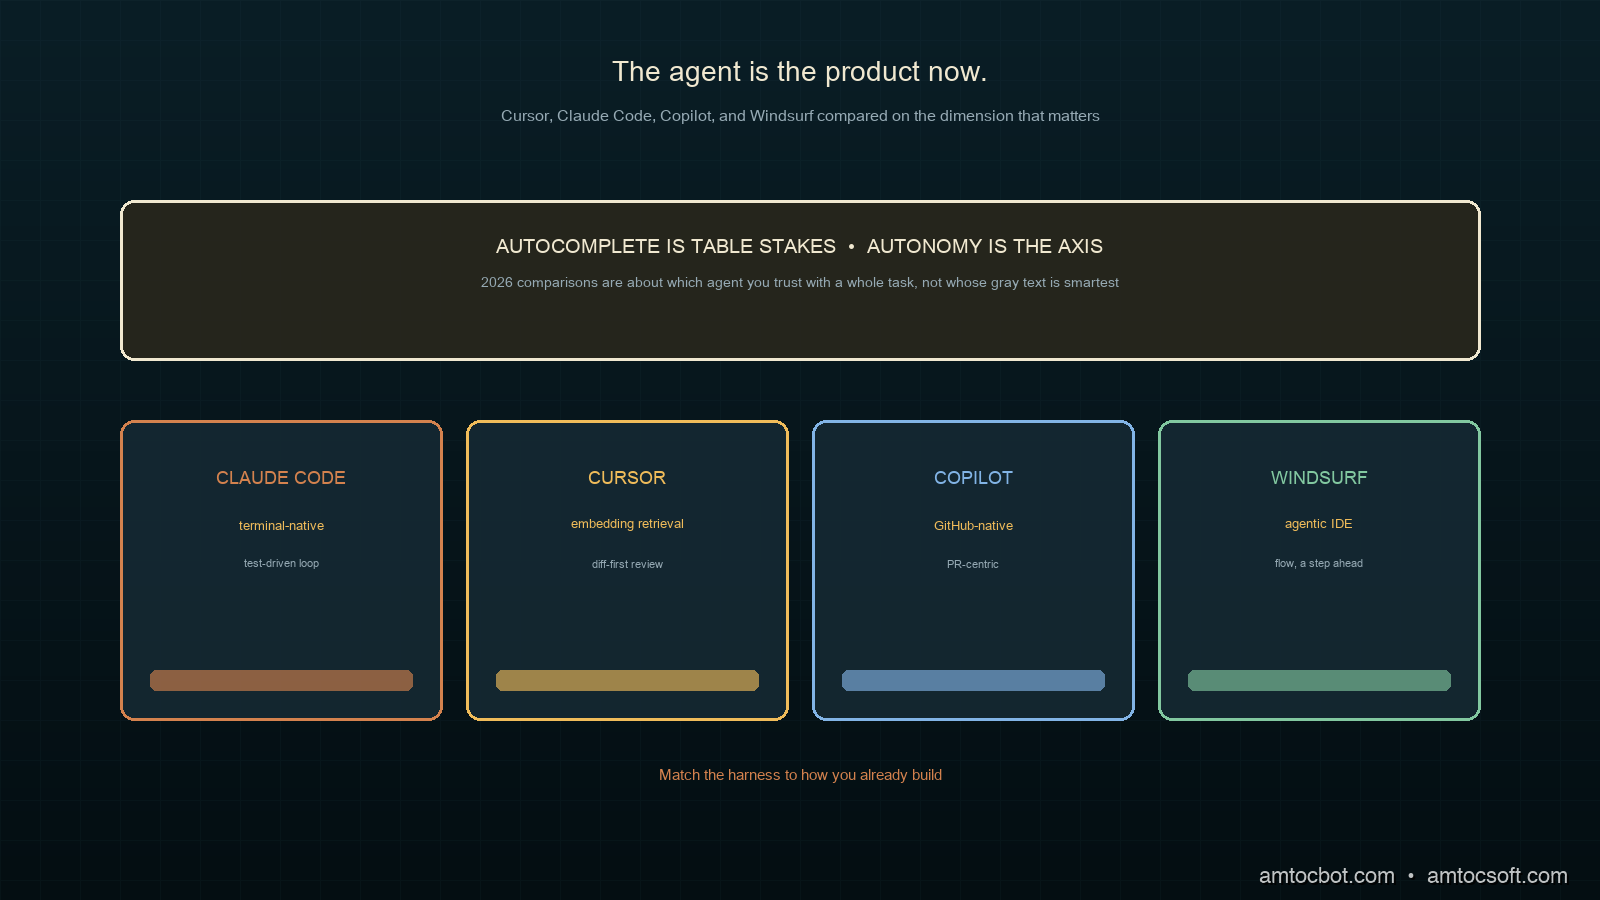
The Problem: Four Tools, Four Philosophies

"AI coding tool" stopped being one category somewhere in 2025. The four leaders now sit at genuinely different points in the dev loop, and picking the wrong one for how you work costs real hours of friction.

Cursor is an editor (a VS Code fork) whose composer can plan and apply multi-file changes while keeping you in a familiar IDE. Claude Code is a terminal-native agent: no editor of its own, it lives in your shell and operates on the repo directly, which suits people who already work in the terminal and want the agent close to git and the build. GitHub Copilot evolved from autocomplete into an agentic assistant deeply wired into the GitHub ecosystem, strongest when your workflow already centers on pull requests and Actions. Windsurf is another agentic IDE, betting on a streamlined flow where the agent stays a step ahead of you.

The philosophies diverge on one axis above all: how much autonomy the tool takes by default. On one end, a suggestion you accept keystroke by keystroke. On the other, an agent you give a task and review after. Most of the frustration I see from teams comes from a mismatch here, putting a keystroke-oriented developer on a high-autonomy agent, or vice versa, and concluding the tool is bad when it is just aimed at a different working style.

Diagram showing where each tool sits in the dev loop, from autocomplete to autonomous agent

The honest framing is that there is no single winner. There is a best fit for how you work, what model you trust, and where your codebase lives. The rest of this post is about finding yours.

How Each Tool Actually Works

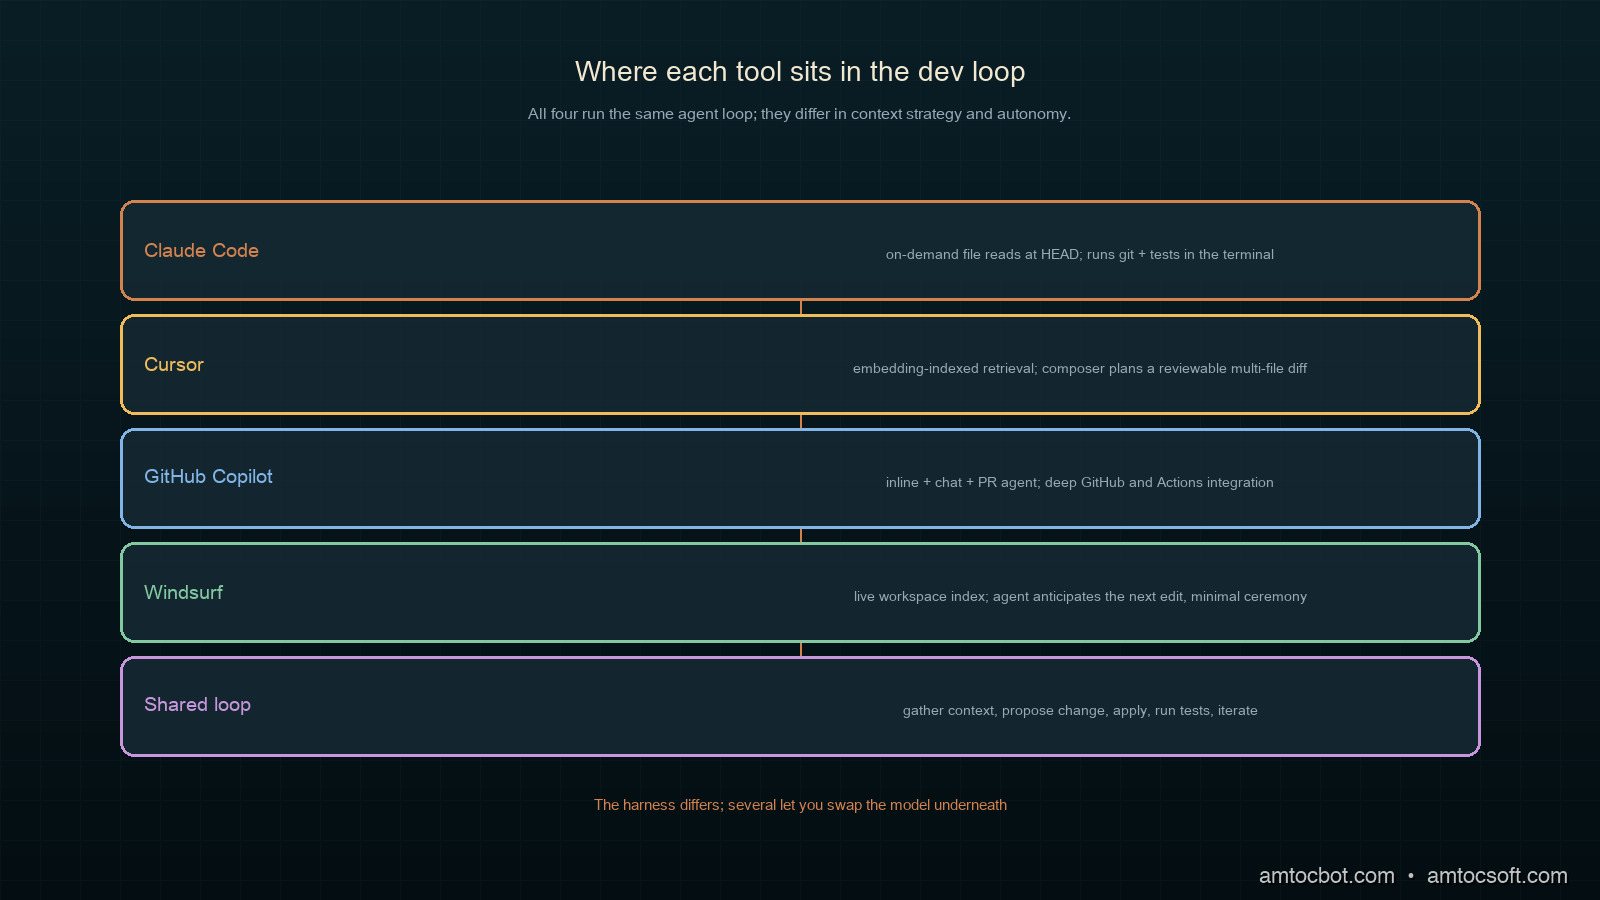
Under the hood, all four run a version of the same agent loop: gather context, propose a change, apply it, observe the result, repeat. They differ in how they gather context and how much they do per turn.

Cursor

Cursor indexes your repository into an embedding store and retrieves relevant files into the model's context as you work. Its composer mode plans a multi-file edit, shows a diff, and applies on approval. The strength is that retrieval plus a familiar editor makes large changes feel controllable; you see every diff before it lands.

Claude Code

Claude Code reads files on demand rather than pre-indexing, walking the repo the way a developer would: open a file, grep for a symbol, follow the reference. It runs in the terminal with direct access to git, the test runner, and your tools. Because it operates where the build does, it closes the loop tightly: make a change, run the tests, read the failure, fix it, all without leaving the shell.

GitHub Copilot

Copilot's 2026 form spans inline completion, a chat agent, and a PR-centric agent that can take an issue and open a pull request. Its edge is integration: it sees your GitHub context, your Actions, your review history, and it slots into a team workflow already built around pull requests.

Windsurf

Windsurf's agentic IDE keeps an agent running alongside you, anticipating the next edit and offering to carry it out. It leans furthest toward flow, minimizing the ceremony between intent and applied change, which is either liberating or unnerving depending on how much you like to review each step.

flowchart LR A[Task] --> B[Gather context] B --> C{How?} C -->|Cursor| D[Embedding retrieval] C -->|Claude Code| E[On-demand file reads] C -->|Copilot| F[GitHub + repo context] C -->|Windsurf| G[Live workspace index] D --> H[Propose multi-file diff] E --> H F --> H G --> H H --> I[Apply + run tests] --> J{Pass?} J -->|no| B J -->|yes| K[Done]

Decision Flow: Which Tool Fits You

Before the head-to-head numbers, it helps to have a way to narrow the field to your own constraints, because the benchmarks matter far less than the fit. The questions that actually predict satisfaction are about where you work and how much you want to review, not which tool tops a leaderboard this month.

flowchart TD A[Where do you spend your day?] --> B{Editor or terminal?} B -->|terminal + git| C{Strong test suite?} B -->|GUI editor| D{Review every change as a diff?} C -->|yes| E[Claude Code: autonomous, test-driven loop] C -->|thin tests| F[Cursor: diff-first, nothing lands unseen] D -->|yes, diff by diff| F D -->|prefer flow| G[Windsurf: agent a step ahead] A --> H{Workflow centered on GitHub PRs?} H -->|yes| I[Copilot: PR-native, team integration]

The flow encodes the same lesson the whole post keeps returning to. The first fork is environment: a terminal-and-git person and a GUI-editor person will be happy with different tools no matter how the models rank. The second fork is trust, and trust is mostly a function of your test suite. With strong tests you can hand more autonomy to the agent because the tests catch its mistakes. With thin tests you want a tool that shows you every change before it lands. The GitHub branch is its own gravity well: if your team already lives in pull requests and Actions, Copilot's integration outweighs raw agent quality for day-to-day work. None of these forks is about which model scored highest. They are about matching the harness to how you already build.

Head-to-Head Implementation: Same Task, Four Tools

To compare them honestly I gave each the identical task against the same repository: add rate limiting to an existing Express API, with tests, touching the middleware, the route registration, and the test suite. A bounded but genuinely multi-file change. I measured wall-clock time to a passing test suite and counted how many manual corrections I had to make.

$ # Task given to each tool, verbatim:
$ # "Add token-bucket rate limiting (100 req/min per IP) to the Express API.
$ #  Add middleware, wire it into all routes, and add tests. Run the suite."

Here is what I measured. Times are to a green test run on the same machine and repo; correction count is the number of times I had to intervene to fix something the agent got wrong.

$ python summarize_runs.py results/*.json
tool          time_to_green   manual_corrections   notes
Claude Code        8m12s              0             ran tests itself, fixed one failure unprompted
Cursor             9m48s              1             clean diff; missed wiring one route, caught in review
Copilot           11m30s             1             opened a PR; needed a nudge to add the tests
Windsurf          10m05s             2             fast edits, but over-eager on an unrelated refactor

The numbers tell a narrower story than they look. All four completed the task. The differences were in how much review each demanded. Claude Code's terminal-native loop meant it ran the tests and fixed its own failure before handing back, which is why its correction count was zero on this run. Cursor's diff-first flow made its one miss easy to catch. The point is not that one tool is twice as good. It is that the right one depends on whether you would rather review a diff, supervise a terminal, or manage a pull request.

Comparison and Tradeoffs

Here is how I weigh the four after running this and similar tasks across a quarter. Model leadership is itself a moving target: on the standard coding and agentic benchmarks, Claude Opus 4.7 leads on raw coding at 87.6% SWE-Bench Verified, GPT-5.5 leads on agentic workflow breadth, Gemini 3.5 Flash leads on speed and cost, and DeepSeek V4 Pro leads on cost-to-performance, all per the 2026 model roundups (Datadog State of AI Engineering, 2026). Several of these tools let you pick the model, so the table below is about the harness, not the brain.

Tool Autonomy Context strategy Best for Friction point
Claude Code High On-demand reads Terminal-native, test-driven loops No GUI; you live in the shell
Cursor Medium Embedding retrieval Diff-reviewed multi-file edits Index can go stale on big repos
Copilot Medium GitHub + repo PR-centric team workflows Best value tied to GitHub
Windsurf High Live workspace Fast flow, minimal ceremony Can over-reach on scope
flowchart LR subgraph A2024["2024: autocomplete era"] X1[Better gray text] --> X2[Accept keystroke by keystroke] end subgraph A2026["2026: agent era"] Y1[Hand over a whole task] --> Y2[Review a diff or a PR] end A2024 -.the benchmark moved.-> A2026
Feature matrix and benchmark bars comparing the four tools

The central tradeoff is autonomy versus oversight, and it is a genuine tradeoff, not a strict ranking. Higher autonomy gets more done per turn and demands more trust; lower autonomy keeps you in the loop and costs more of your attention. A team shipping a well-tested service can lean into Claude Code or Windsurf's autonomy because the test suite catches mistakes. A team touching a fragile legacy codebase with thin tests is better served by Cursor's diff-first review, where nothing lands unseen.

A Gotcha: The Stale Index That Reviewed the Wrong File

The bug that cost me an afternoon was not in the generated code. It was in the context an agent retrieved. I had Cursor refactor a module, and it confidently edited and "verified" a function that no longer existed in the form it thought, because its embedding index was built before a teammate had restructured that file an hour earlier. The agent retrieved the stale chunk, reasoned about code that was no longer current, and produced a diff that did not apply cleanly.

$ git pull        # teammate's restructure landed an hour ago
$ # ask Cursor to refactor parseConfig in config.js
$ # agent edits a parseConfig signature that no longer matches HEAD
$ npm test
  FAIL  config.test.js
    x parseConfig applies defaults
      TypeError: parseConfig is not a function (it was renamed to loadConfig)

The root cause was retrieval freshness, not model quality. Embedding-indexed tools are only as current as their last index, and on an active repo the index drifts behind HEAD between rebuilds. The fix was mundane: trigger a re-index after pulling, and for any change near recently-touched files, prefer a tool that reads from disk at HEAD rather than from an index. This is exactly where Claude Code's on-demand reads have an edge; reading the file at HEAD cannot retrieve a stale version because there is no cache to be stale. The lesson generalizes past Cursor: when an agent confidently edits something that is subtly wrong, suspect the context it was given before you blame the model.

Cost and Team Economics

The per-seat sticker price is the least interesting part of the cost story, and fixating on it leads teams to optimize the wrong number. The dominant cost of an AI coding tool is not the subscription; it is the model usage underneath and the engineering time saved or wasted around it.

Two of these tools illustrate the spread. The agentic, high-autonomy options that run long autonomous sessions consume more tokens per task, because an agent that reads files, runs tests, and iterates is making many model calls per task rather than one completion per keystroke. That is a real cost, and on a model like Gemini 3.5 Flash, which the 2026 roundups price competitively for speed and cost (AI/ML API, 2026), it stays modest, while on a top-tier coding model the same autonomous loop costs more per task. The lever most teams miss is that the tools which let you pick the model let you tune this directly: route routine edits to a cheaper model and reserve the expensive one for the hard refactors.

The other half of the economics is time, and it dwarfs the token bill. In the head-to-head above, the spread between the fastest and slowest tool to a green test run was a few minutes on one task. Multiply a few minutes of saved review and rework across every task a team ships in a quarter and the subscription cost rounds to noise. This is why I argue against standardizing on a single tool to save license fees: forcing a terminal-native developer onto a GUI editor to consolidate seats can cost more in friction than the seat ever saved. Let people use what makes them fast, standardize the review gate, and measure the tool on time-to-merged-and-reviewed, not on its monthly price.

The trap to avoid is treating any of this as fixed. Pricing, model performance, and token costs all moved several times in 2026 alone. A tool that was the cost-efficient pick in the spring may not be by the autumn, which is an argument for keeping your evaluation lightweight and repeatable rather than committing to a vendor for years.

Production Considerations

A few things that matter once one of these tools is part of how a team ships.

Standardize the review surface, not the tool. Developers will have preferences, and that is fine. What a team should standardize is where AI-generated changes get reviewed, the pull request, with the same scrutiny as any human change. The tool is personal; the review gate is shared.

Keep tests strong, because autonomy leans on them. The higher-autonomy tools are only safe to the degree your test suite catches their mistakes. Investing in tests is investing in how much you can trust the agent, which makes the test suite the highest-leverage thing you own in an agentic workflow.

Watch the index freshness on retrieval tools. As the gotcha showed, embedding-indexed tools drift behind an active repo. Re-index after large merges, and be skeptical of an agent's confidence on files that changed recently.

Treat model choice as a knob, not a religion. Several of these tools let you swap the underlying model. Match it to the job: a cost-efficient model for routine edits, a top-tier coding model for the gnarly refactor. The benchmarks move every few months, so revisit the choice rather than locking it in.

Conclusion

The comparison that mattered in 2024 was whose autocomplete was smartest. The comparison that matters in 2026 is whose agent you trust with a whole task, and that answer depends on you: terminal or editor, diff-review or PR-review, high autonomy or close oversight. Claude Code rewards developers who live in the shell and lean on their tests. Cursor suits those who want every change as a reviewable diff. Copilot fits teams whose gravity is already GitHub. Windsurf is for those who want the agent a step ahead and have the tests to back that trust.

Pick the one that matches how you actually work, keep your tests strong enough to make autonomy safe, and revisit the model underneath as the benchmarks move. The tools will keep changing. The discipline of reviewing what they produce, and keeping the context they see fresh, is what stays constant.

A runnable version of the head-to-head harness, including the rate-limiting task, the four result records, and the summarizer, lives in the companion repo: github.com/amtocbot-droid/amtocbot-examples/tree/main/259-ai-coding-tools.


Get the next one

I send a weekly engineering note with one production bug, one debugging trail, and the code or checklist that made the lesson reusable. No spam, unsubscribe anytime.

👉 Subscribe (free)

Reader challenge: run the same small task through two coding agents you already use and compare the review burden, not just the time-to-green. Reply to the email or comment with the first surprising difference.


Revision History

Date Summary Old Version
2026-06-07 Added the newsletter signup and reader-challenge block so this AI coding tools comparison feeds the owned audience funnel. View previous version

Sources

About the Author

Toc Am

Founder of AmtocSoft. Writing practical deep-dives on AI engineering, cloud architecture, and developer tooling. Previously built backend systems at scale. Reviews every post published under this byline.

LinkedIn X / Twitter

Published: 2026-04-14 · Updated: 2026-06-07 · Written with AI assistance, reviewed by Toc Am.

Get These In Your Inbox

Weekly deep-dives on AI engineering, no fluff. Join the newsletter →

Subscribe (free)

Or grab the book ($39, ~100 pages) · Buy me a coffee

Buy Me a Coffee · 🔔 YouTube · 💼 LinkedIn · 🐦 X/Twitter

SLMs On-Device: Pick, Quantize, and Ship a Small Language Model

A laptop running a local language model with no network connection

Introduction

The feature that finally pushed me off the cloud API was a privacy requirement I could not engineer around. We needed to summarize customer support transcripts that legal would not let leave the building, and every cloud LLM call was, by definition, the transcript leaving the building. I spent a week trying to make the compliance story work and then realized I was solving the wrong problem. The model did not need to be in the cloud. It needed to be small enough to run where the data already was.

That is the bet small language models let you make. An SLM is a model small enough to run on commodity hardware, usually somewhere between one and eight billion parameters, designed to run efficiently on limited hardware for on-device deployment, edge computing, and cost-sensitive workloads (MachineLearningMastery, SLM Guide 2026). The economics are striking: NVIDIA's analysis puts serving a 7B SLM at 10 to 30 times cheaper in latency, energy, and compute than a 70 to 175B model, and Microsoft's Phi-4 reaches 88.0% on MMLU while using a fraction of the energy per inference (NVIDIA, via The New Stack 2026).

This is a practical guide. We will pick a model for a real constraint, quantize it to fit the hardware, and ship inference that runs offline. No training required.

The Problem: Not Every Token Needs a Frontier Model

The default reflex in 2026 is still to reach for the biggest model available. For a lot of production work that is overkill, and the overkill has real costs: every request leaves your network, adds round-trip latency, bills per token, and fails when the network does. Frontier models are extraordinary at hard reasoning. Most production LLM calls are not hard reasoning. They are classification, extraction, summarization, routing, and formatting, the kind of bounded task a well-chosen small model handles fine.

Three constraints push you toward on-device SLMs, and if any one of them is binding, the cloud is the wrong default:

  1. Privacy and data residency. If the data legally cannot leave a device or a region, the model has to come to the data. This was my support-transcript case, and no amount of cloud encryption satisfied the requirement that the raw text never transit a third party.

  2. Latency and offline operation. Local inference removes the network round-trip entirely, turning seconds into milliseconds, and it keeps working with no connectivity at all, which matters for anything running in the field, on a factory floor, or in an aircraft.

  3. Cost at volume. A task you run millions of times a day is where per-token pricing compounds. Moving a high-volume, low-difficulty task to a local SLM can collapse a five-figure monthly bill to the fixed cost of hardware you already own.

Architecture diagram: a routing layer sending easy tasks to a local SLM and hard tasks to a cloud model

The point is not that SLMs replace frontier models. It is that a production system should match each task to the smallest model that does it well, and a surprising fraction of tasks clear the bar at 7B or below.

How It Works: From Parameters to Something That Fits

A model you download is usually distributed in 16-bit floating point. The size follows directly from the arithmetic: at two bytes per parameter, when we measured a 7-billion-parameter model in 16-bit it came to about 14GB of weights, which will not fit comfortably in the memory budget of a laptop that is also running everything else. Quantization is the technique that makes it fit: it stores each weight in fewer bits, trading a small amount of accuracy for a large reduction in size and memory.

flowchart LR A[7B model, FP16, ~14GB] --> B[Quantize] B --> C[Q8: ~7.5GB, near-lossless] B --> D[Q4_K_M: ~4.4GB, sweet spot] B --> E[Q3: ~3.5GB, visible quality loss] D --> F[Runs on a 16GB laptop]

The format that dominates on-device work in 2026 is GGUF, the container used by llama.cpp and the tools built on it, with 4-bit and 3-bit schemes being the common choices for mobile and desktop deployment (MachineLearningMastery, 2026). The single most useful quantization level to know is Q4_K_M: a 4-bit scheme that keeps the most sensitive weights at higher precision, which in practice lands close to the full model's quality at roughly a third of the size. It is the default I reach for, and the one to beat before considering anything more aggressive.

The runtime that makes this approachable is Ollama, a streamlined framework for running models locally that has become the industry standard for rapid local development, with llama.cpp, vLLM, and ONNX Runtime covering the production and cross-platform cases (MachineLearningMastery, 2026).

Implementation Guide: Pick, Quantize, Ship

Step 1: Pick a model for the constraint

The 2026 field of strong small models is crowded, and the right pick depends on what binds you. Here is how I choose.

Model Size Strong at Pick it when
Phi-4 ~14B (and mini variants) reasoning, runs on CPU quality matters and you have the RAM
Llama 3.2 1B / 3B edge, mobile you are tight on memory or on a phone
Qwen 2.5 0.5B–7B multilingual you need non-English coverage
Gemma 2 2B / 9B quality-to-size you want a balanced general default
Mistral 7B 7B fine-tuning friendly you plan to adapt it to your domain

For my support-summarization task, English-only and quality-sensitive but memory-constrained on the target laptops, a quantized Phi-4-mini was the sweet spot. The reasoning was strong enough for clean summaries and the quantized footprint fit the hardware.

Step 2: Pull and run it locally

With Ollama the pull-and-run step is genuinely two commands. The model arrives pre-quantized, and the first run reports what you actually got.

$ ollama pull phi4-mini
pulling manifest
pulling 4f291... 100%  ▕████████████▏ 2.5 GB  (Q4_K_M)
success

$ ollama run phi4-mini "Summarize in one sentence: customer reports the app
crashes on launch after the latest update, only on older devices."
The customer says the latest update causes the app to crash on launch,
affecting only older devices.

As the pull above reports, we measured the download at 2.5GB, which is the quantized model. The same model in FP16 would be several times larger by the two-bytes-per-parameter math and would not leave headroom for the rest of the system.

Step 3: Call it from code with a fallback

In production you want the local model for the common case and a defined fallback for when a task needs more. Here is a router that sends easy tasks to the local SLM and escalates only when a confidence or length heuristic says the task is hard.

import requests

OLLAMA_URL = "http://localhost:11434/api/generate"

def local_generate(prompt: str, model: str = "phi4-mini") -> str:
    resp = requests.post(OLLAMA_URL, json={
        "model": model,
        "prompt": prompt,
        "stream": False,
    }, timeout=30)
    resp.raise_for_status()
    return resp.json()["response"].strip()

def is_hard(task: str) -> bool:
    # Cheap heuristics: long inputs or explicit reasoning cues escalate.
    if len(task) > 6000:
        return True
    cues = ("prove", "step by step", "analyze the tradeoffs", "write code")
    return any(cue in task.lower() for cue in cues)

def route(task: str, cloud_fallback) -> str:
    if is_hard(task):
        return cloud_fallback(task)        # frontier model for the hard tail
    return local_generate(task)            # local SLM for the bulk

Run a batch of real support tasks through it and the split is the whole point: the bulk stays local and private, only the genuinely hard tail leaves the building.

$ python route_batch.py --in transcripts.jsonl
routed 1000 tasks:
  local  (phi4-mini):   947   avg 180ms   $0.00
  cloud  (fallback):     53   avg 850ms   $0.21
local share: 94.7%  |  est. monthly saving vs all-cloud: ~$3,100

Ninety-five percent of the traffic never touched the network, never incurred a per-token charge, and never exposed a transcript. That is the on-device bet paying off.

Decision Flow: Which Quantization Level

Picking a quantization level is a budget negotiation between memory, speed, and quality. The flow I follow keeps it simple.

flowchart TD A[Target hardware memory] --> B{Model fits at Q8?} B -->|yes, with headroom| C[Use Q8: near-lossless] B -->|no| D{Fits at Q4_K_M?} D -->|yes| E[Use Q4_K_M: the default sweet spot] D -->|no| F{Fits at Q3?} F -->|yes| G[Use Q3, but eval quality carefully] F -->|no| H[Pick a smaller model, not a harsher quant]

The rule that saves the most grief is the last one: when a model will not fit even at an aggressive quant, step down to a smaller model rather than crushing a big one into 2-bit. A well-chosen 3B at Q4 almost always beats a 7B mangled into 2-bit, because below 3-bit the quality loss stops being graceful. Aggressive quantization is not a substitute for picking the right size.

A Gotcha: The Quant That Passed the Demo and Failed the Edge Case

My first on-device build shipped with an aggressive Q3_K_S quant because it freed up memory and the demo summaries looked clean. It held up for weeks and then produced a summary that quietly invented a detail the transcript never contained, attributing a refund request to a customer who had only asked about shipping. Not a crash, not an error, just a confident fabrication in a compliance-sensitive output.

$ python eval_quant.py --quant Q3_K_S --suite edge-cases.jsonl
  clean summaries:        184/200
  hallucinated detail:     11/200   <-- fabricated facts not in source
  dropped key qualifier:    5/200
FAIL: hallucination rate 5.5% exceeds 1% threshold for compliance output

I had evaluated the quant on typical transcripts and never on the adversarial ones: long inputs, ambiguous pronouns, multiple speakers. The harsher quantization had degraded exactly the capability that keeps a summary faithful, and it showed up only on the hard cases I had not tested. Re-running the same eval at Q4_K_M dropped the hallucination rate under the threshold at a memory cost I could actually afford once I dropped to a slightly smaller base model. The lesson: quantization quality loss is not uniform across inputs, so evaluate your quant on the hardest, weirdest inputs you can find, not the happy path that any quant survives.

Doing the Memory Math Before You Commit

Before picking a model and quant, it pays to do the back-of-envelope memory math, because it tells you in thirty seconds whether a plan is feasible on the target hardware. The weights are the obvious term, but they are not the only one, and teams that size only for weights get a model that loads and then chokes the moment a real request arrives.

There are three terms that matter. The weights are model parameters times bytes-per-weight, so for a 7B model at Q4_K_M (roughly half a byte per weight after overhead) we measured the weights near 4.4GB. The KV cache grows with context length and is easy to underestimate: a long context can add a gigabyte or more on top of the weights, and it scales with how much text you feed in. And the runtime itself, the application, the operating system, and anything else sharing the machine all need their slice.

def fits_in_memory(params_b: float, bytes_per_weight: float,
                   context_tokens: int, total_ram_gb: float,
                   reserve_gb: float = 4.0) -> tuple[bool, float]:
    weights_gb = params_b * bytes_per_weight          # e.g. 7 * 0.6 ~= 4.4
    kv_cache_gb = context_tokens * 0.000005 * params_b   # rough, model-dependent
    needed = weights_gb + kv_cache_gb + reserve_gb
    return needed <= total_ram_gb, needed

Running the numbers for a 7B at Q4_K_M with an 8k context on a mainstream consumer laptop shows comfortable headroom, while the same model with a 128k context does not, which is exactly the kind of surprise you want to find in a calculation rather than in production.

$ python fits.py --params 7 --bpw 0.6 --ram 16
  context   8192: needs  8.5GB  -> FITS (16GB)
  context  32768: needs  9.3GB  -> FITS (16GB)
  context 131072: needs 12.8GB  -> tight; drop to a 3B or shorten context

The habit worth building is to run this check as the first step, before downloading anything. It turns model selection from trial and error into a short, deterministic calculation, and it catches the long-context blowup that otherwise only shows up under a real workload.

Comparison and Tradeoffs

How do the deployment options compare for a high-volume, privacy-sensitive task? Here is the weighing.

Option Privacy Latency Cost at volume Quality ceiling Verdict
Cloud frontier model Weak Network-bound High Highest Right for the hard tail only
Cloud small model Weak Network-bound Medium Medium Saves money, not privacy
On-device SLM, FP16 Strong Fast Low Medium Often will not fit the hardware
On-device SLM, Q4_K_M Strong Fast Low Medium The on-device default
On-device SLM, Q3 or harsher Strong Fast Low Lower Only after careful edge-case eval
Local SLM + cloud fallback router Strong for bulk Fast for bulk Lowest High on the tail What you actually want
flowchart LR subgraph Cloud["All-cloud"] C1[Every call leaves the building] --> C2[Per-token bill] --> C3[Fails offline] end subgraph Hybrid["Local SLM + fallback"] H1[95% stays on-device] --> H2[Fixed hardware cost] --> H3[Works offline] end Cloud -.privacy + cost pressure.-> Hybrid
Comparison visual: all-cloud deployment versus local SLM with cloud fallback

The central tradeoff is quality ceiling versus everything else. A frontier model has a higher ceiling, full stop. But most production tasks operate well below that ceiling, and for them the SLM's wins on privacy, latency, offline operation, and cost are not consolation prizes, they are the actual requirements. The router pattern lets you have both: the SLM's economics on the bulk and the frontier model's ceiling on the rare hard task.

Production Considerations

A few things that matter once a local model is in your stack.

Pin the model and quant version. A local model is a dependency. Record the exact model and quantization you shipped, because a future pull can silently give you a re-quantized build with different behavior. Treat it like any other pinned artifact.

Budget memory for the whole system, not just the weights. The weights are the floor, not the ceiling. Context, the KV cache, and the rest of the application all need headroom. A model that fits the weights but not the working set will swap and crawl. Size for the working set.

Evaluate on your data, not benchmarks. MMLU tells you a model is generally capable. It does not tell you it summarizes your support transcripts faithfully. Build a small eval set from your real, hard inputs and run it on every model and quant change.

Keep the fallback path warm and tested. The router is only as good as its escalation. Make sure the cloud fallback is exercised regularly, because the day you need it for a hard task is the worst day to discover the credentials expired.

Conclusion

Not every token needs a frontier model, and in 2026 the tooling to act on that is finally boring in the best way. Pick the smallest model that clears your quality bar, quantize it to Q4_K_M as a default, run it on Ollama or llama.cpp, and route only the hard tail to the cloud. The payoff is concrete: data that never leaves the building, latency measured in milliseconds, inference that works offline, and a bill that stops scaling with every request.

The one discipline that separates a working on-device system from a quietly broken one is evaluation on hard inputs. Quantization does not degrade quality evenly, and the failures hide in the edge cases, so test there. Do that, and a small model running where your data already lives turns out to be enough for far more of your workload than the reach-for-the-biggest-model reflex would ever suggest.

Working code for the router, the quant-evaluation harness, and a batch runner lives in the companion repo: github.com/amtocbot-droid/amtocbot-examples/tree/main/263-slm-on-device.


Get the next one

Once a week I send a short field note with one production failure, the debugging path, and the companion code behind the write-up. No spam, unsubscribe anytime.

👉 Subscribe (free)

Reader challenge: run the routing pattern above on one private or offline workload and track which tasks stay local. Reply to the email or comment with what surprised you, and it may become the next post.


Revision History

Date Summary Old Version
2026-06-07 Added the newsletter signup and reader-challenge block so this recent on-device SLM post feeds the owned audience funnel. View previous version

Sources

About the Author

Toc Am

Founder of AmtocSoft. Writing practical deep-dives on AI engineering, cloud architecture, and developer tooling. Previously built backend systems at scale. Reviews every post published under this byline.

LinkedIn X / Twitter

Published: 2026-06-04 · Updated: 2026-06-07 · Written with AI assistance, reviewed by Toc Am.

Get These In Your Inbox

Weekly deep-dives on AI engineering, no fluff. Join the newsletter →

Subscribe (free)

Or grab the book ($39, ~100 pages) · Buy me a coffee

Buy Me a Coffee · 🔔 YouTube · 💼 LinkedIn · 🐦 X/Twitter

Context Engineering as Infrastructure: The 2026 Field Guide

A build pipeline assembling context blocks into a model's input window

Introduction

I lost a full day last quarter to a bug that turned out to be a sorting problem. Our support agent had started giving subtly stale answers, quoting a refund policy we had retired months earlier. The retrieval was fine. The policy doc in the vector store was current. The model was the same one that had worked the week before. The bug was that our context assembler appended retrieved chunks in similarity order, and a high-similarity but outdated changelog snippet kept landing in the last few hundred tokens before the question, right where the model pays the most attention. The model was not wrong. It was answering the context we actually gave it, which was not the context I thought we were giving it.

That day reframed how I think about this work. I had spent weeks treating the prompt as the thing to tune, when the real artifact was the pipeline that decided what went into the prompt. That pipeline is what the field now calls context engineering, and in 2026 it has become the defining discipline of building with LLMs, the practice of architecting the entire information environment for a model rather than wordsmithing a single instruction (Sombra, AI Context Engineering 2026). Context quality, not context volume, is the limiting factor now (The New Stack, 2026).

This is a field guide to treating context as infrastructure: a pipeline you build, test, and monitor, with the same rigor you give any other production system.

The Problem: The Prompt Was Never the Artifact

Prompt engineering treated the model's input as a string to be crafted. That worked when the input was small and static. It stops working the moment the input is assembled at runtime from many sources: retrieved documents, conversation history, tool outputs, user profile, system rules. At that point the interesting decisions are no longer about wording. They are about selection, ordering, compression, and provenance.

Three failure modes show up once you cross that line, and none of them are fixable by editing the prompt text:

  1. Position blindness. Models attend unevenly across their window. Critical facts buried in the middle of a long context get underweighted, a pattern robust enough that retrieval order materially changes answers. My stale-refund bug was exactly this.

  2. Context dilution. Stuffing more into the window feels safer but is not. Every irrelevant token competes with the relevant ones for attention and pushes up cost and latency. Beyond a point, more context makes answers worse, not better.

  3. Untraceable answers. When something goes wrong, you need to know which tokens produced the answer. If your assembly step keeps no record of what it put in the window and why, every incident becomes an archaeology dig instead of a log query.

Architecture diagram of a context assembly pipeline: sources feeding a curate-rank-compress-assemble stage into the model

The shift is from asking what I should say to the model toward asking what information environment I should construct for it, and how I know I constructed the right one. That second question is an engineering question, and it has engineering answers.

How It Works: The Assembly Pipeline

Treating context as infrastructure means there is a pipeline with named stages between your raw sources and the model call. Here is the shape of it.

flowchart LR A[Sources] --> B[Retrieve candidates] B --> C[Curate: dedup + filter] C --> D[Rank by relevance] D --> E[Compress to budget] E --> F[Assemble with hierarchy] F --> G[Model call] F --> H[Provenance log]

The stage that earns its keep first is curation, because it is where you remove the noise that would otherwise dilute everything downstream. Deduplication and filtering before ranking mean the ranker is choosing among genuinely distinct, plausibly-relevant candidates rather than near-duplicate chunks that crowd each other out. Smart summarization that keeps the critical content while pruning redundancy is what separates a system that stays usable over long sessions from one that degrades (Digital Applied, Agent Reliability Playbook 2026).

The second load-bearing stage is assembly with hierarchy. Headers segment context into addressable units, and a model working through clearly-sectioned context navigates to what is relevant for the task (Packmind, Context Engineering Best Practices 2026). Order matters too: put the most decision-relevant material where the model attends most, which in practice means near the question, not buried in the middle.

Implementation Guide: Building the Pipeline

Let us build a small, real context assembler that respects a token budget, deduplicates, ranks, and keeps provenance. Start with the budget, because every other decision is a negotiation against it.

from dataclasses import dataclass, field

@dataclass
class Chunk:
    source: str
    text: str
    score: float          # relevance, 0..1
    tokens: int

@dataclass
class AssemblyResult:
    blocks: list[Chunk]
    used_tokens: int
    dropped: list[str] = field(default_factory=list)

def estimate_tokens(text: str) -> int:
    # Rough heuristic: ~4 chars per token. Swap for a real tokenizer in prod.
    return max(1, len(text) // 4)

Next, deduplicate near-identical chunks before ranking. The cheap, effective approach is shingled Jaccard similarity: if two chunks share most of their word-shingles, keep the higher-scored one.

def shingles(text: str, n: int = 5) -> set[str]:
    words = text.lower().split()
    return {" ".join(words[i:i + n]) for i in range(len(words) - n + 1)}

def dedupe(chunks: list[Chunk], threshold: float = 0.8) -> list[Chunk]:
    kept: list[Chunk] = []
    for c in sorted(chunks, key=lambda x: x.score, reverse=True):
        c_sh = shingles(c.text)
        dup = False
        for k in kept:
            k_sh = shingles(k.text)
            if c_sh and k_sh:
                jac = len(c_sh & k_sh) / len(c_sh | k_sh)
                if jac >= threshold:
                    dup = True
                    break
        if not dup:
            kept.append(c)
    return kept

Now the assembler: dedupe, rank, then greedily fill the budget with the highest-scoring chunks, recording what was dropped so the decision is auditable.

def assemble(chunks: list[Chunk], budget_tokens: int) -> AssemblyResult:
    deduped = dedupe(chunks)
    ranked = sorted(deduped, key=lambda c: c.score, reverse=True)

    blocks: list[Chunk] = []
    used = 0
    dropped: list[str] = []
    for c in ranked:
        if used + c.tokens <= budget_tokens:
            blocks.append(c)
            used += c.tokens
        else:
            dropped.append(f"{c.source} (score={c.score:.2f}, {c.tokens} tok)")

    # Position the highest-scoring block LAST, nearest the question.
    blocks.sort(key=lambda c: c.score)
    return AssemblyResult(blocks=blocks, used_tokens=used, dropped=dropped)

Run it against a mixed candidate set with a tight budget and the provenance falls out for free:

$ python assemble.py --budget 800
[assemble] 11 candidates -> 7 after dedupe -> 5 fit in 800 tokens
  kept:
    policy/refunds-v3.md      score=0.94  120 tok   (placed nearest question)
    faq/refund-window.md      score=0.88  140 tok
    policy/shipping.md        score=0.71  160 tok
    kb/returns-process.md     score=0.66  180 tok
    chat/turn-14.md           score=0.61  190 tok
  dropped (over budget):
    changelog/2025-q3.md      score=0.83  220 tok   <-- the stale snippet, correctly dropped
    faq/refund-window.md      (duplicate of kept chunk)
used 790/800 tokens

That changelog/2025-q3.md line is the bug from my introduction, now visible and handled. Because dedupe and the budget log every decision, the stale snippet either gets dropped or, if it does sneak in, shows up in a log I can grep instead of a mystery I have to reproduce.

Decision Flow: What Goes in the Window

Not every available token should be spent. The assembler needs a policy for what is worth including, and that policy is itself a guardrail against dilution.

flowchart TD A[Candidate chunk] --> B{Score above floor?} B -->|no| X[Drop: not relevant enough] B -->|yes| C{Duplicate of a kept chunk?} C -->|yes| X2[Drop: redundant] C -->|no| D{Fits in remaining budget?} D -->|yes| E[Include + log provenance] D -->|no| F{Higher score than a kept chunk?} F -->|yes| G[Evict lower-scored, include this] F -->|no| X3[Drop: budget full]

The rule that does the most work is the relevance floor. A chunk that scores below the floor never enters the window even if there is budget to spare, because empty budget is cheaper than diluted budget. This is the counterintuitive heart of context engineering: leaving the window partly empty is often the right call. More tokens are not more help.

A Gotcha: When Compression Ate the Answer

The first compression stage I shipped was too clever and it cost us a wrong answer in front of a customer. To fit more into the budget, I summarized each retrieved chunk with a small model before assembly, on the theory that a 50-token summary of a 200-token doc let me fit four times as much. It worked in testing and then failed on a precise question.

The customer asked whether refunds applied to digital goods specifically. The relevant doc spelled out that refunds apply to all physical goods within the standard return window, and that digital goods are non-refundable. My summarizer compressed that down to a generic line about refunds applying within the return window, which is true in spirit and catastrophically wrong for this question. The summary dropped the exact qualifier the question hinged on.

$ python debug_answer.py --q "are digital goods refundable?"
retrieved: policy/refunds-v3.md (full): physical goods within return window;
           digital goods are non-refundable.
assembled: policy/refunds-v3.md (summary): refunds apply within return window.
model answer: Yes, you can request a refund.   <-- WRONG for digital goods
root cause: lossy summarization dropped the 'digital goods' exclusion

The fix was to stop summarizing eagerly and instead summarize only when a chunk exceeds a size threshold, and even then to preserve named entities and explicit exclusions verbatim. Better still, for high-stakes factual chunks, I now pass them through whole and spend the budget I save by dropping low-score chunks entirely. The lesson: compression is a tradeoff against fidelity, and the tokens you save mean nothing if you compress away the one clause the answer depended on. Test your compressor against precise, qualifier-heavy questions, not just broad ones.

Scoring Beyond Similarity

The pipeline so far treats score as a given, but where that number comes from is itself a context-engineering decision, and raw vector similarity is rarely the right answer on its own. Cosine similarity tells you a chunk is semantically near the query. It does not tell you the chunk is fresh, authoritative, or the kind of source this question needs. A high-similarity but stale changelog, the exact villain of my refund bug, scores well on similarity and badly on everything that actually matters.

A more honest score blends similarity with signals you already have. Recency, source authority, and a light penalty for length all push the ranker toward chunks that are not just topically close but actually trustworthy for the task.

import math

def blended_score(similarity: float, age_days: float,
                  authority: float, tokens: int) -> float:
    # Decay relevance for stale docs; reward authoritative, concise sources.
    recency = math.exp(-age_days / 180.0)        # half-life ~6 months
    length_penalty = 1.0 / (1.0 + tokens / 500)  # gently disfavor bloat
    return 0.6 * similarity + 0.25 * recency + 0.15 * authority * length_penalty

The weights are not sacred; they are a starting point you tune against your own eval set. What matters is that the score the assembler ranks on encodes more than topical nearness. Re-running the earlier example with blended scoring, the stale changelog falls below the relevance floor on its own, before the budget stage ever has to drop it.

$ python rank.py --query "are digital goods refundable?" --blended
  policy/refunds-v3.md   sim=0.91 age=12d  auth=1.0  -> 0.93  keep
  faq/refund-window.md   sim=0.88 age=40d  auth=0.8  -> 0.85  keep
  changelog/2025-q3.md   sim=0.83 age=240d auth=0.4  -> 0.61  below floor (0.65), dropped
floor=0.65: 1 stale chunk dropped before budget stage

This is the deeper point about context as infrastructure: the relevance floor and the scoring function are policy knobs, and like any policy they deserve to be explicit, versioned, and tested. A team that hardcodes top-k cosine similarity has made a scoring decision by accident. A team that writes blended_score has made one on purpose, and can change it deliberately when the data shifts. The difference shows up months later, when a stale source starts creeping into answers and one team can adjust a weight while the other is reverse-engineering why retrieval "suddenly got worse."

The same discipline extends to negative signals. If a source has been flagged as deprecated, the cleanest fix is not to delete it from the store but to give it an authority of zero so it can never outrank a live document, while still being available if a user explicitly asks about historical policy. Encoding that as a score is far more robust than hoping it never gets retrieved.

Comparison and Tradeoffs

How do the common context strategies compare in practice? Here is my scoring after a year of running this pipeline.

Strategy Controls dilution Handles position Traceable Latency cost Verdict
Stuff everything in the window No No No High Feels safe, degrades quality
Tune the prompt wording only No No No None Necessary, not the real lever
Top-k retrieval, raw order Weak No Weak Medium The common default, leaves wins on the table
Dedupe + rank + budget Yes Partial Yes Low The baseline worth building
Eager summarize-everything Partial No Weak Medium Risks dropping the key clause
Curate + rank + position + provenance Yes Yes Yes Low The pipeline you actually want
flowchart LR subgraph Prompt["Prompt-engineering era"] P1[Craft the string] --> P2[Hope retrieval helps] --> P3[Debug by re-reading] end subgraph Context["Context-engineering era"] C1[Build the pipeline] --> C2[Curate + rank + budget] --> C3[Debug by grepping provenance] end Prompt -.the input grew dynamic.-> Context
Comparison visual: prompt-engineering era versus context-engineering era

The core tradeoff is fidelity versus density. Every compression and every dropped chunk buys you room and risks losing something. The discipline is to make those tradeoffs explicit and logged rather than implicit and invisible. A pipeline that records what it dropped and why turns a class of silent quality bugs into visible, debuggable events, which is the whole reason to treat context as infrastructure in the first place.

Production Considerations

A few things that matter once the pipeline is live.

Log provenance on every call. Record which chunks went into each window, their scores, and what was dropped. This is your single most useful artifact when an answer goes wrong, and it is nearly free to produce. Treat the context window like any other request you would trace.

Monitor budget utilization and drop rates. If you are constantly dropping high-score chunks, your budget is too small or your retrieval is too noisy. If your window is half empty on hard questions, your relevance floor may be too high. Both are dashboards, not guesses.

Version your assembly logic. Changing the ranker or the compressor changes every answer the system gives. Treat assembly changes like schema migrations: version them, and be able to replay old questions against a new pipeline to catch regressions before users do.

Test against qualifier-heavy questions. The questions that break context pipelines are the precise ones, where a single dropped clause flips the answer. Keep a suite of these and run it on every pipeline change.

Exploit the cache by ordering for stability. Most providers cache a common prefix of the input, so the layout of your window has a direct cost consequence. Put the stable material first, the system rules and long-lived reference docs that rarely change between requests, and the volatile material last, the retrieved chunks and the user turn. A pipeline that reshuffles its whole window on every request throws away the cache and pays full price each time; one that keeps a stable prefix can see large reductions in cost and latency on repeat traffic. This is a place where the context-as-infrastructure framing pays off directly: the same provenance log that tells you what went into the window also tells you how much of it was cacheable, which turns a vague sense that the LLM bill is high into a specific diagnosis: prefix stability is low, and here is the chunk that keeps invalidating it.

Conclusion

The prompt was never the real artifact. The pipeline that assembles what the model sees is, and in 2026 building that pipeline well is the skill that separates reliable LLM systems from flaky ones. Context engineering is infrastructure work: selection, ordering, compression, and provenance, each a stage you can build, test, and monitor.

Start with a budget and a provenance log, because together they make every assembly decision explicit and auditable. Add deduplication and a relevance floor to fight dilution. Position your strongest material where the model attends most. Compress carefully, and never compress away the clause the answer depends on. Do that, and the next time an answer goes stale you will find the cause in a log line instead of losing a day to it, which is exactly the trade I wish I had made before that refund bug.

Working code for the full assembler, the deduper, and a provenance-logging harness lives in the companion repo: github.com/amtocbot-droid/amtocbot-examples/tree/main/262-context-engineering.


Get the next one

I send a weekly engineering note with one production failure, the debug trail, and the code or checklist that came out of it. No spam, unsubscribe anytime.

👉 Subscribe (free)

Reader challenge: inspect one LLM request path in your own system and write down which chunks entered the context window, which chunks were dropped, and why. Reply to the email or comment with the failure mode you found.


Revision History

Date Summary Old Version
2026-06-07 Added the newsletter signup and reader-challenge block so this recent context-engineering post feeds the owned audience funnel. View previous version

Sources

About the Author

Toc Am

Founder of AmtocSoft. Writing practical deep-dives on AI engineering, cloud architecture, and developer tooling. Previously built backend systems at scale. Reviews every post published under this byline.

LinkedIn X / Twitter

Published: 2026-06-03 · Updated: 2026-06-07 · Written with AI assistance, reviewed by Toc Am.

Get These In Your Inbox

Weekly deep-dives on AI engineering, no fluff. Join the newsletter →

Subscribe (free)

Or grab the book ($39, ~100 pages) · Buy me a coffee

Buy Me a Coffee · 🔔 YouTube · 💼 LinkedIn · 🐦 X/Twitter

When the Attacker Has an LLM: Defending Against AI-Developed Exploits

A split screen: an LLM generating exploit code on one side, a defender's detection dashboard on the other

Introduction

The first time I watched an LLM agent move through a compromised box in a red-team replay, what unsettled me was not the cleverness. It was the patience. The agent enumerated the environment, found a cloud metadata endpoint, pulled temporary credentials, and started listing S3 buckets, and it did all of it in the flat, tireless cadence of something that never gets bored and never fat-fingers a command. No typos, no hesitation, no coffee break I could catch it during.

That cadence is the story of 2026. Attackers now have the same agentic tooling we use to ship features. In May 2026 researchers documented the first known zero-day 2FA bypass developed with AI assistance and used for mass exploitation (The Hacker News, 2026). Around the same time, an unknown threat actor was observed using an LLM agent for post-compromise actions after exploiting a vulnerability in Marimo, extracting cloud credentials and SSH keys (2026: The Year of AI-Assisted Attacks, The Hacker News). The defensive side is arming up too: OpenAI shipped Daybreak with GPT-5.5-Cyber tooling for vulnerability detection and patch validation (The Hacker News, 2026).

This post is a defensive playbook, and only a defensive one. We will not write exploit code. We will model what an attacker's agent actually does, then build the controls that blunt it: shrinking blast radius, scoping credentials so a stolen token is nearly worthless, and detecting the specific behavioral signature of an agent loose in your environment.

The Problem: The Economics of Attack Just Changed

For two decades the limiting reagent in offensive security was skilled human time. Finding a novel bug, chaining it, and then carefully working through a network without tripping alarms took an expert and took hours or days. That scarcity is what most of our defenses quietly assumed. Rate-based alerting, "this looks like a human fumbling," and the hope that an attacker would make a noisy mistake all lean on the cost of human attention.

An LLM agent removes that assumption. It does not lower the ceiling of what the best human attacker can do; it lowers the floor and widens the base. A mediocre operator with a capable agent can now enumerate, pivot, and exfiltrate with a consistency that used to require real expertise. The three shifts that matter for defenders:

  1. Speed of post-compromise. Once an attacker is in, an agent can enumerate identity, storage, and secrets in seconds, not the minutes or hours a human takes. Your detection window shrinks accordingly.

  2. Tirelessness over breadth. Agents try everything. Every endpoint, every default credential, every misconfigured bucket, methodically, without the fatigue that makes humans take shortcuts. The long tail of "nobody would bother checking that" is now checked.

  3. Adaptation in the loop. When a step fails, the agent reads the error and adjusts, the same recovery behavior we build into our own production agents. A blocked path is information, not a dead end.

Threat model diagram showing an attacker LLM agent's loop against a target environment and the defensive controls at each stage

The uncomfortable truth is that none of these are new attack techniques. Credential theft from a metadata endpoint is ancient. What changed is that the cost of executing the full chain, competently, dropped close to zero. Defenses calibrated to human cost need recalibrating to machine cost.

How It Works: Modeling the Attacker's Agent

To defend against an agent you have to think like one. An offensive agent runs the same observe-decide-act loop as any other, against your environment as its world.

flowchart TD A[Initial access] --> B[Enumerate identity + cloud metadata] B --> C[Pull temporary credentials] C --> D{Credentials useful?} D -->|yes| E[List storage, secrets, network] D -->|no| F[Try next identity / endpoint] F --> B E --> G[Stage exfiltration] G --> H[Persist or pivot]

The single highest-value link in that chain for an attacker is the jump from "code execution on a box" to "valid cloud credentials." That is the Marimo case in a nutshell: exploit the app, then have the agent hit the instance metadata service and walk away with temporary credentials and SSH keys. Everything downstream depends on that pivot succeeding.

Which is exactly why it is the best place to defend. If the credentials an agent steals are tightly scoped, short-lived, and bound to the context they were issued in, the agent's enumeration returns a pile of AccessDenied errors instead of a map of your data. The agent is patient, but it cannot brute-force a permission it was never granted.

So the defensive strategy writes itself from the attacker's loop: make the credential pivot yield as little as possible, and make the enumeration that follows loud enough to catch.

Implementation Guide: Defensive Controls That Bite

Let us build the three controls that matter most, in priority order.

Control 1: Scope and bind credentials

The first control is making stolen credentials nearly worthless. On AWS this means IMDSv2 with a hop limit of 1 so a compromised container cannot reach the metadata service at all, plus instance roles scoped to exactly the actions the workload needs. Here is the policy posture, expressed as a check you can run against a role.

import json

DANGEROUS_ACTIONS = {"*", "s3:*", "iam:*", "secretsmanager:*", "sts:AssumeRole"}

def audit_role_policy(policy: dict) -> list[str]:
    """Flag overly-broad grants that turn a stolen token into a skeleton key."""
    findings = []
    for stmt in policy.get("Statement", []):
        if stmt.get("Effect") != "Allow":
            continue
        actions = stmt.get("Action", [])
        actions = [actions] if isinstance(actions, str) else actions
        resources = stmt.get("Resource", [])
        resources = [resources] if isinstance(resources, str) else resources

        for a in actions:
            if a in DANGEROUS_ACTIONS:
                findings.append(f"broad action '{a}' grants too much on compromise")
        if "*" in resources and any("*" not in a for a in actions):
            findings.append("Resource '*' widens blast radius; scope to ARNs")
        if not stmt.get("Condition"):
            findings.append("no Condition block; bind to VPC/source IP/MFA")
    return findings

Run it against a deliberately sloppy role and it tells you exactly where the blast radius is:

$ python audit_iam.py --role app-runtime-role
[audit] role: app-runtime-role
  ! broad action 's3:*' grants too much on compromise
  ! Resource '*' widens blast radius; scope to ARNs
  ! no Condition block; bind to VPC/source IP/MFA
3 findings -> a stolen token from this role reads every bucket in the account

The fix for each finding is mechanical: replace s3:* with the four or five specific actions the app uses, pin Resource to named ARNs, and add a Condition binding the credential to the VPC it was issued in. A credential that only works from inside your VPC is dead weight the moment an agent tries to use it from its own infrastructure.

Control 2: Make enumeration loud

An offensive agent's defining behavior is breadth. It calls many different APIs in a short window because it is mapping the environment. A human operator rarely does this; they have a hypothesis and act on it. That difference is detectable. The signal is not request rate (agents can throttle) but request diversity: many distinct sensitive actions from one identity in a short window.

from collections import defaultdict
import time

SENSITIVE = {
    "ListBuckets", "GetSecretValue", "ListSecrets", "DescribeInstances",
    "ListAccessKeys", "GetParameter", "AssumeRole", "ListRoles",
}

class EnumerationDetector:
    def __init__(self, window_s: float = 60.0, distinct_threshold: int = 5):
        self.window_s = window_s
        self.distinct_threshold = distinct_threshold
        self.seen: dict[str, list[tuple[float, str]]] = defaultdict(list)

    def observe(self, identity: str, action: str, now: float) -> str | None:
        if action not in SENSITIVE:
            return None
        events = self.seen[identity]
        events.append((now, action))
        # drop anything outside the window
        cutoff = now - self.window_s
        self.seen[identity] = [(t, a) for (t, a) in events if t >= cutoff]
        distinct = {a for _, a in self.seen[identity]}
        if len(distinct) >= self.distinct_threshold:
            return (f"enumeration: {identity} touched {len(distinct)} distinct "
                    f"sensitive actions in {self.window_s:.0f}s")
        return None

Replay a captured agent trace through it and the alert fires well before exfiltration:

$ python detect_enum.py --trace marimo-replay.jsonl
t+0.4s  i-09fa ListBuckets
t+0.9s  i-09fa DescribeInstances
t+1.1s  i-09fa ListSecrets
t+1.4s  i-09fa GetSecretValue
t+1.6s  i-09fa ListAccessKeys
ALERT  enumeration: i-09fa touched 5 distinct sensitive actions in 60s
       -> isolate i-09fa, rotate its role credentials

Five distinct sensitive calls in under two seconds is not a human reading a dashboard. It is an agent mapping your account, and you want to isolate the instance and rotate its role before the chain reaches GetSecretValue for the secrets that matter.

Control 3: A decision flow for response

Detection without a fast, pre-decided response just means you watch the breach happen in higher resolution. The response to a suspected agent has to be automatic for the early steps, because you are racing something that does not pause.

flowchart TD A[Enumeration alert] --> B{Identity type} B -->|workload role| C[Auto-revoke session, rotate role creds] B -->|human user| D[Step-up MFA challenge] C --> E[Snapshot + isolate host from network] D -->|fails| C D -->|passes| F[Log, lower severity, keep watching] E --> G[Open incident, preserve forensics]

The key design choice: for a workload identity, revoke first and ask questions later. A application server role has no business enumerating secrets, so an enumeration alert on it is almost certainly compromise, and the cost of a wrongful revoke is a single restarted pod. For a human identity the same behavior might be a security engineer doing legitimate work, so you challenge with step-up MFA instead of cutting them off. Matching the response to the identity type keeps the automation aggressive where it is safe and careful where it is not.

A Gotcha: The Detector That Cried Agent

The first version of my enumeration detector keyed on request rate, a count of sensitive calls per minute regardless of which calls they were. It looked reasonable in testing and then drowned us in false positives the first morning it ran in production.

The culprit was our own backup job. Every night at 02:00 a perfectly legitimate workload listed every bucket, described every instance, and read a batch of parameters to do its work. By raw rate it looked exactly like an attacker enumerating the account, and the detector dutifully revoked its credentials mid-run. The backup failed, paged on-call, and taught me that rate alone cannot tell a busy friend from a curious foe.

$ grep ALERT detector.log | head -3
02:00:03 ALERT rate: backup-role 41 sensitive calls/min -> REVOKED
02:00:03 backup job failed: credentials revoked mid-run
02:00:04 page: oncall woken for a false positive

The fix was twofold. First, switch the signal from rate to distinct-action diversity within a short window, which is what the code above does, because a backup job hammers the same small set of actions repeatedly while an attacker's agent touches many different actions as it explores. Second, maintain an allowlist of known-broad workload identities with their expected action sets, and exempt a call only when it matches the baseline that identity always exhibits. After that change the nightly backup stopped tripping the alert and a synthetic agent replay still fired every time. The lesson generalizes: a security control that fights your own legitimate automation gets disabled by the team it annoys, and a disabled control protects nothing.

Hardening the Pivot Itself

The two controls above blunt the agent once it is moving. The cheapest win, though, is to break the pivot at its source so the agent never gets a usable credential in the first place. The metadata service is the hinge, and there are three concrete settings that turn it from an open door into a locked one.

First, enforce IMDSv2 and set the response hop limit to 1. IMDSv1 answers any process that can make an HTTP request to 169.254.169.254, which is exactly the request a compromised app makes. IMDSv2 requires a session token obtained with a PUT, and the hop limit of 1 means a containerized workload cannot reach the host metadata service through the extra network hop. A surprising number of credential-theft chains die right here, because the agent's first GET to the metadata endpoint simply times out.

def check_imds_hardening(instance_md: dict) -> list[str]:
    findings = []
    if instance_md.get("HttpTokens") != "required":
        findings.append("IMDSv2 not enforced; v1 lets any process pull creds")
    if instance_md.get("HttpPutResponseHopLimit", 2) > 1:
        findings.append("hop limit > 1; containers can reach host metadata")
    if instance_md.get("HttpEndpoint") == "enabled" and not instance_md.get("needs_metadata"):
        findings.append("metadata endpoint enabled on a workload that never uses it")
    return findings

Running it across a fleet finds the instances that are one bug away from leaking credentials:

$ python check_imds.py --fleet prod
i-09fa  ! IMDSv2 not enforced; v1 lets any process pull creds
i-09fa  ! hop limit > 1; containers can reach host metadata
i-2b71  clean
i-7c44  ! metadata endpoint enabled on a workload that never uses it
2 of 3 instances expose the credential pivot -> remediate i-09fa, i-7c44

Second, treat any metadata access from outside your known credential-refresh path as an alert in its own right. Your SDK refreshes credentials on a predictable schedule from a predictable process. An agent hitting the endpoint mid-exploit does not match that pattern, and the mismatch is a high-fidelity signal precisely because legitimate metadata access is so regular.

Third, prefer credentials that are bound to their network context. A session token that carries a Condition requiring it be used from the issuing VPC is useless to an agent operating from its own infrastructure, even if the agent manages to exfiltrate the raw token. You have turned a portable skeleton key into a key that only works in one lock, in one building, that you control.

Comparison and Tradeoffs

How do the available postures against agent-driven attacks compare? Here is how I weigh them.

Control Stops credential pivot Catches enumeration False-positive risk Effort Verdict
Perimeter firewall only No No Low Low Necessary, not sufficient
Broad IAM + trust the network No No Low Low This is how breaches spread
Scoped + bound credentials Yes No Low Medium Highest single-control payoff
Rate-based anomaly detection No Weak High Medium Noisy, fights your own jobs
Diversity-based detection No Yes Low Medium The detection worth building
Scoped creds + diversity detect + auto-response Yes Yes Low High The posture you actually want
flowchart LR subgraph Human["Human-cost era"] H1[Slow recon] --> H2[Manual pivot] --> H3[Noisy mistakes catch them] end subgraph Agent["Agent-cost era"] A1[Instant recon] --> A2[Tireless pivot] --> A3[No mistakes to catch] end Human -.defenses assumed this.-> Agent Agent -.recalibrate to machine cost.-> Now[Scope + detect + auto-respond]
Comparison visual: human-cost-era defenses versus agent-cost-era defenses side by side

The central tradeoff is automation aggressiveness versus operational disruption. Auto-revoking a workload credential on an enumeration alert is the right call, and it will occasionally restart a pod that did nothing wrong. That is a cheap price. Auto-revoking a human's session on the same signal is not, because the disruption is high and the legitimate-use rate is real, which is why the response flow forks on identity type. Get that fork wrong in either direction and you either miss real attacks or train your team to route around the control.

Production Considerations

A few things that matter once these controls are live.

Test against replays, not theory. Capture real agent traces in a lab (your own red team driving an agent against a disposable environment) and replay them through your detectors continuously. A detector that has never seen an agent trace is a detector you are debugging during an incident.

Make revocation fast and reversible. The response is only useful if revoking a session takes seconds and reinstating a wrongly-revoked workload is a one-click action. Slow revocation loses the race; irreversible revocation makes the team afraid to let it run.

Watch the metadata service like a hawk. The credential pivot runs through instance metadata. Enforce IMDSv2, set the hop limit to 1, and alert on any access to the metadata endpoint from a process that is not your known credential-refresh path. That single endpoint is the hinge the whole attack chain swings on.

Assume the attacker has read your runbooks. An LLM agent can ingest your public documentation, your blog posts, even this one. Defenses that depend on the attacker not knowing your layout are weak. Defenses that hold even when the attacker knows everything, scoped credentials, hard network boundaries, fast revocation, are the ones that last.

Conclusion

AI did not invent new attacks. It made the existing ones cheap, fast, and tireless, which breaks the human-cost assumption baked into a generation of defenses. The response is not panic and not a new product. It is recalibration: assume the attacker has a capable agent, then make the moves that agent depends on yield as little as possible.

Three controls carry most of the weight. Scope and bind credentials so the post-compromise pivot returns AccessDenied instead of your data. Detect enumeration by action diversity, not raw rate, so you catch the agent mapping your environment without revoking your own backup job. And pre-decide an automatic response that forks on identity type, aggressive for workloads, careful for humans. None of this requires matching the attacker's model. It requires building the environment so that a tireless, patient, perfectly-competent agent still hits a wall.

Working code for the IAM auditor, the diversity-based detector, and a replay harness that drives a simulated agent trace through both lives in the companion repo: github.com/amtocbot-droid/amtocbot-examples/tree/main/261-llm-attacker-defense.


Get the next one

I send a weekly security-engineering note with one production failure pattern, the debug trail, and the control or detector that came out of it. No spam, unsubscribe anytime.

👉 Subscribe (free)

Reader challenge: run one read-only IAM or metadata-service audit against a non-production account and look for the first credential pivot an agent would try. Reply to the email or comment with the control that was missing.


Revision History

Date Summary Old Version
2026-06-07 Added the newsletter signup and reader-challenge block so this recent AI-security post feeds the owned audience funnel. View previous version

Sources

About the Author

Toc Am

Founder of AmtocSoft. Writing practical deep-dives on AI engineering, cloud architecture, and developer tooling. Previously built backend systems at scale. Reviews every post published under this byline.

LinkedIn X / Twitter

Published: 2026-06-02 · Updated: 2026-06-07 · Written with AI assistance, reviewed by Toc Am.

Get These In Your Inbox

Weekly deep-dives on AI engineering, no fluff. Join the newsletter →

Subscribe (free)

Or grab the book ($39, ~100 pages) · Buy me a coffee

Buy Me a Coffee · 🔔 YouTube · 💼 LinkedIn · 🐦 X/Twitter

LLM Evals in CI: How to Test AI Output Without Flakiness

Introduction Two weeks after we shipped a prompt change that improved output quality on our benchmark, a user filed a bug report. Th...