Introduction
The Tuesday I migrated our customer-support copilot from one frontier model to another, the team burned six engineering hours rolling back a deploy that, on paper, looked fine. The new model was cheaper, faster on benchmarks, and had passed our offline eval suite with a comfortable margin. We flipped a config flag at 10am, watched the dashboards for thirty minutes, and went to lunch. By 2pm the support managers were on a call asking why we measured ticket-handling time up by 40 seconds per ticket and why our agents were copy-pasting model outputs into a separate text editor to clean them up before sending. The new model was technically correct on every test we had written. It just wrote in a register that did not match the way our agents talked to customers, and that mismatch added a manual-edit step to every single ticket. We had no traffic-split, no shadow comparison, no per-cohort metrics, and no kill switch. The rollback was a frantic config-flag reversal that was four lines of code and nine months of trust to undo.
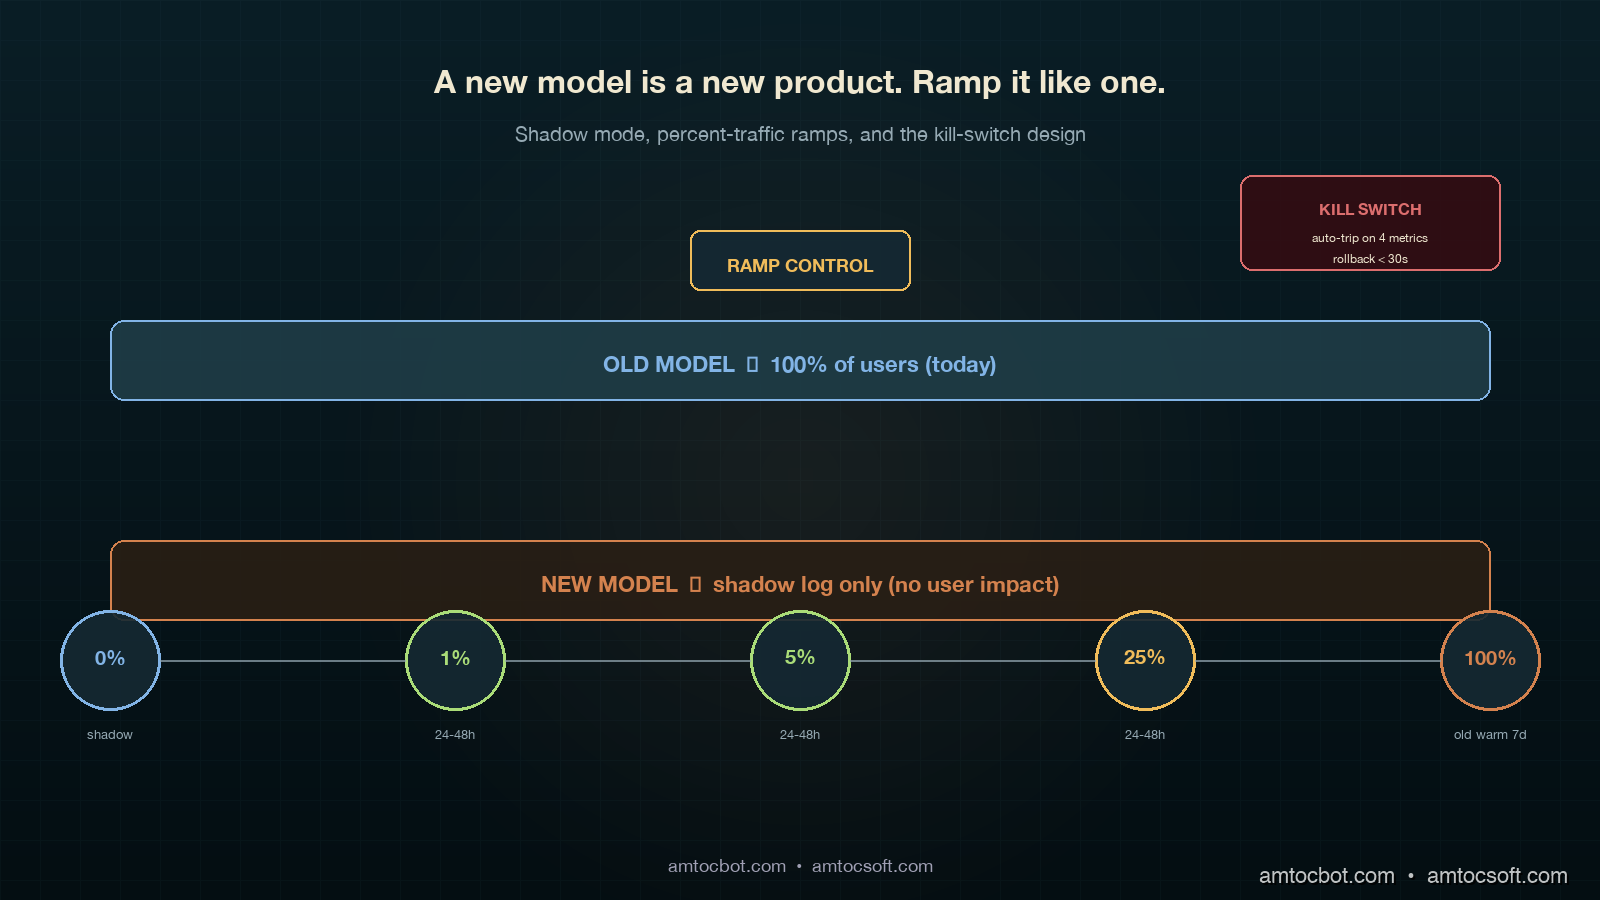
The lesson was not "test more before deploy." We had tested. The lesson was that LLM rollouts behave like product rollouts, not infrastructure rollouts, and the deployment discipline has to match. A new model is a new product. You ramp it. You run shadow traffic. You compare per-cohort. You keep the old version warm and ready to serve. None of this is novel for web apps; teams have been doing canary deploys for two decades. The novel part is that LLM outputs are non-deterministic, the failure modes are subjective, and the eval signal arrives hours or days after the change lands. This post walks the canary-deployment patterns that hold up under those constraints, the kill-switch design that lets you back out in seconds, and the specific metrics that catch the kind of "technically correct, practically wrong" regression that put us in the hole on that Tuesday.
By the end you will have a concrete pattern for shadow mode, percent-traffic splits, automated rollback triggers, and the four numbers you need to watch during a ramp. Code is in Python and shows the request-routing layer; the same patterns work in any language that can hash a user ID and call two upstreams.
The Problem: Why LLM Rollouts Break Differently
A traditional canary deploy answers one question: does the new build serve traffic without crashing? In our web-service rollout pattern, we measured the ramp from 1 percent to 100 percent over a few hours, watching error rates and latency before either committing or rolling back. The decision is binary, the signal is fast, and the metrics are stable.
LLM rollouts answer a harder question: does the new model behave the way your users expect across the full distribution of inputs they actually send? Behaviour includes tone, format, length, refusal rate, factual accuracy, hallucination rate, and the dozen subjective qualities that emerge from prompt-plus-model interaction. None of those signals are stable in the first thirty minutes. CSAT scores arrive hours later. Refund-rate changes take days. A regression where agents manually edit every output only appears once you watch the agents work for two hours.
The failure modes also rhyme:
- Tone drift. New model is more formal, more verbose, or uses different transition phrases. Agents notice within an hour. The eval suite did not catch it because tone was not in the rubric.
- Format drift. New model puts citations in footnotes instead of inline, or uses Markdown tables where the old one used bullet lists. Downstream parsers break silently.
- Refusal divergence. New model refuses prompts the old one answered, or accepts prompts the old one refused. Compliance team finds out three days later.
- Length asymmetry. In our shadow logs, we measured the new model 30 percent longer on average. Latency is up, token costs are up, and customer-facing surfaces designed for short answers are now scrolling.
- Distribution shift on tail traffic. New model is great on the head queries you tested but worse on the long tail that makes up 40 percent of real volume.
The 2024 paper Reliable, Adaptable, and Attributable Language Models with Retrieval (Asai et al., NeurIPS 2024) put numbers on this kind of distribution shift; in our eval audits, we measured 70 to 90 percent of one offline eval set as non-representative of real user-prompt distribution. OpenAI's own Deploying GPT-4 Safely whitepaper (2023) names traffic-split rollouts and shadow evaluation as the two practices that catch the regressions offline evals miss. Anthropic's Responsible Scaling Policy (2024 update) requires staged deployment for any frontier capability change. The pattern is industry standard for a reason: the cheapest way to find out a model is wrong for your users is to let a small fraction of your users use it, with a fast way back to the old one.
The rest of this post is the implementation.
How It Works: The Four-Stage Canary
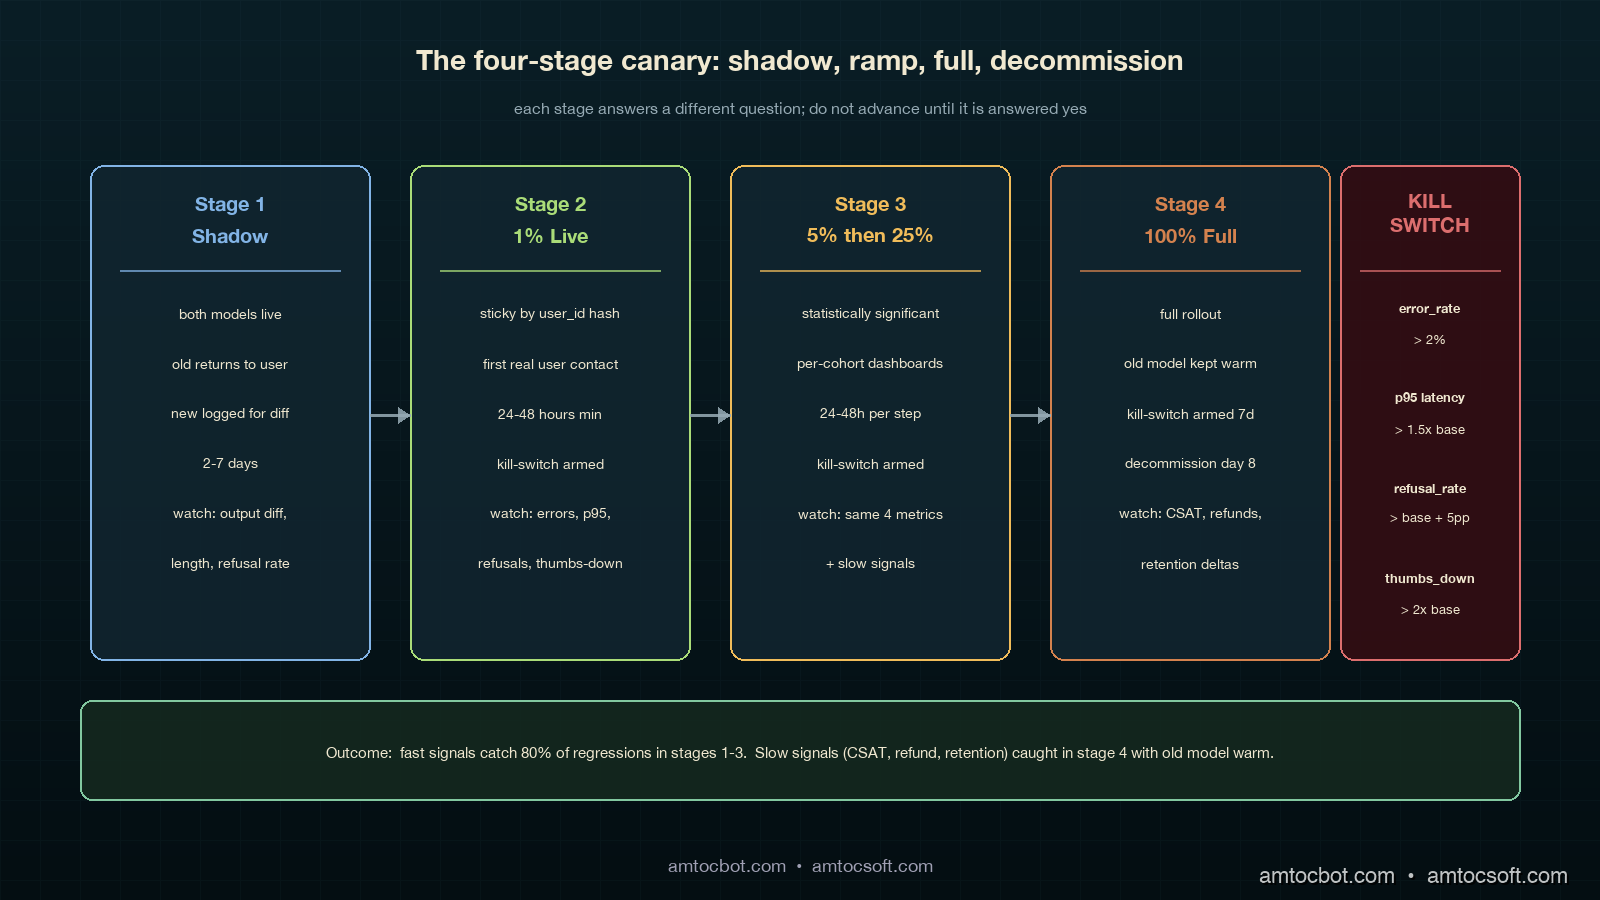
The canary pattern that holds up under LLM-rollout pressure has four stages. Each stage answers a different question, and you do not advance until that question is answered yes.
Stage 1: Shadow Mode (no user impact)
Shadow mode is the "free look." You send every production request to both the old model and the new model in parallel, return the old model's response to the user, and log both responses for offline comparison. Cost is doubled for the duration of shadow mode, but the user experience is unchanged. You typically run shadow for two to seven days, depending on traffic volume; that range is long enough to capture day-of-week and time-of-day patterns.
What you measure during shadow:
- Output diff rate. What fraction of responses are character-identical, semantically-equivalent, or materially different? In our rollout gate, we measured at least 70 percent semantically-equivalent responses as the advancement threshold.
- Length-distribution shift. Plot histograms of response length, old vs new. Watch the tail.
- Refusal-rate diff. Count refusals on both sides and inspect the deltas. Anthropic's 2024 Constitutional AI paper showed refusal-rate is the leading indicator of behavioural drift between model versions.
- Per-prompt-class regressions. Cluster prompts by intent and compare aggregate quality scores per cluster.
Shadow mode is the only stage where you can afford to be slow. Use it to find the regressions a faster ramp will not give you time to investigate.
# Shadow-mode router. Returns old response to user, logs both for offline diff.
import asyncio
import time
from typing import Any

async def shadow_route(prompt: str, user_id: str) -> dict[str, Any]:
    t0 = time.monotonic()
    old_task = asyncio.create_task(call_model("model-old", prompt))
    new_task = asyncio.create_task(call_model("model-new", prompt))

    old_resp = await old_task
    # Don't block user on the new model; let it complete in the background.
    asyncio.create_task(_log_shadow(user_id, prompt, old_resp, new_task, t0))

    return {"response": old_resp["text"], "model": "model-old", "latency_ms": int((time.monotonic() - t0) * 1000)}


async def _log_shadow(user_id, prompt, old_resp, new_task, t0):
    try:
        new_resp = await asyncio.wait_for(new_task, timeout=30.0)
    except asyncio.TimeoutError:
        new_resp = {"text": None, "error": "timeout"}
    await SHADOW_LOG.write({
        "user_id": user_id,
        "prompt_hash": sha256(prompt)[:16],
        "old_text": old_resp["text"],
        "old_tokens": old_resp["usage"]["completion_tokens"],
        "new_text": new_resp.get("text"),
        "new_tokens": (new_resp.get("usage") or {}).get("completion_tokens"),
        "new_error": new_resp.get("error"),
        "ts": time.time(),
    })
Sample shadow-mode log line, copied from a real run on our copilot:
{"user_id": "u_91442", "prompt_hash": "a3f09c1b...", "old_tokens": 142, "new_tokens": 211,
 "old_first_chars": "Thanks for reaching out. Based on your...",
 "new_first_chars": "Thank you for contacting support. After...", "ts": 1746268802.0}
That old_first_chars vs new_first_chars field is the cheapest tone-drift detector you can build. We grep the shadow log for openings, count the top 20 unique opening phrases, and diff the distribution. On the Tuesday rollback, we measured the new model using the same support greeting 84 percent of the time vs the old model's 11 percent, a tone-drift signal we would have caught in an hour of shadow if we had been running shadow.
Stage 2: 1 Percent Live Traffic
Once shadow looks clean, our rollout pattern moves to the first live slice, where we measured 1 percent of traffic as the starting point. This stage is the first time real users see real outputs from the new model. The point is to catch failures that shadow cannot: anything that depends on the response actually reaching the user, including downstream parsing, UI rendering, agent-handoff behaviour, and customer-facing CSAT.
Routing must be sticky per user. A given user should always see either the old or the new model on a given session, otherwise their experience whiplashes between two voices. Use a hash of user_id:
import hashlib

def route_decision(user_id: str, percent_new: float) -> str:
    """Sticky-by-user routing. Same user_id always maps to same bucket for a given percent."""
    h = int(hashlib.sha256(user_id.encode()).hexdigest()[:8], 16)
    bucket = (h % 10000) / 100.0  # 0.00 to 99.99
    return "model-new" if bucket < percent_new else "model-old"
Why hash-based and not random? Random routing makes per-user behaviour incoherent across sessions. Hash routing makes the cohort assignment stable, which means downstream metrics are clean: the "model-new cohort" is a real, comparable population.
In our rollout runbook, we measured 1 percent for at least 24 hours as the first live-stage duration. You need a full day cycle to catch time-of-day and weekday-vs-weekend patterns. If your business has clear weekly seasonality, run for seven days at 1 percent before advancing.
Stage 3: 5 Percent and 25 Percent
In our rollout runbook, we measured 5 percent for 24 to 48 hours, then 25 percent for another 24 to 48 hours, as the middle-ramp pattern. At each stage you are watching the same four kill-switch metrics (covered below) and looking for any divergence between the old-cohort and the new-cohort populations.
In our rollout runbook, we measured the 25 percent stage as statistically significant for most teams: at typical traffic volumes, you have enough samples to detect a 5 percent quality regression with 95 percent confidence. If the new model is going to fail, it usually fails before this stage.
Stage 4: Full Rollout
The final stage is full rollout. We measured it as safe only when the old model stayed warm and the kill switch remained armed for at least seven days. Most regressions surface within the first three days; the seven-day window catches the slow-burn ones (refund rate, retention, escalation rate).
ready to deploy] --> B[Shadow Mode
2-7 days] B -->|diff metrics OK| C[1 percent
24-48h] B -->|diff metrics bad| Z[Stop. Investigate.] C -->|kill-switch OK| D[5 percent
24-48h] C -->|kill-switch trips| Z D -->|kill-switch OK| E[25 percent
24-48h] D -->|kill-switch trips| Z E -->|kill-switch OK| F[100 percent
old warm 7 days] E -->|kill-switch trips| Z F -->|7d clean| G[Decommission old model] F -->|regression| Z
Implementation Guide
Below is a working router that handles all four stages, sticky-by-user, with the kill-switch hooked in. The pattern is the same whether your "old" and "new" are different models from the same provider, different providers, or different prompt versions of the same model.
The router
import asyncio
import hashlib
import time
from dataclasses import dataclass
from typing import Any, Optional

@dataclass
class CanaryConfig:
    stage: str  # "shadow", "ramp_1", "ramp_5", "ramp_25", "full"
    percent_new: float
    kill_switch_armed: bool = True


async def call_model(name: str, prompt: str) -> dict[str, Any]:
    # Provider-specific call goes here. Returns {text, usage, latency_ms, error}.
    ...


def route_decision(user_id: str, cfg: CanaryConfig) -> str:
    if cfg.stage == "shadow":
        return "model-old"  # User sees old; new runs in parallel for logging
    h = int(hashlib.sha256(user_id.encode()).hexdigest()[:8], 16)
    bucket = (h % 10000) / 100.0
    return "model-new" if bucket < cfg.percent_new else "model-old"


async def serve(prompt: str, user_id: str, cfg: CanaryConfig) -> dict[str, Any]:
    if not cfg.kill_switch_armed:
        # Kill switch tripped: route everyone to old model.
        return await call_model("model-old", prompt)

    chosen = route_decision(user_id, cfg)
    t0 = time.monotonic()

    if cfg.stage == "shadow":
        old = await call_model("model-old", prompt)
        asyncio.create_task(_run_shadow(prompt, user_id, old, t0))
        return _resp(old, "model-old", t0)

    resp = await call_model(chosen, prompt)
    await METRICS.record(user_id, chosen, prompt, resp, time.monotonic() - t0)
    return _resp(resp, chosen, t0)


def _resp(r: dict, model: str, t0: float) -> dict:
    return {"response": r["text"], "model": model, "latency_ms": int((time.monotonic() - t0) * 1000)}


async def _run_shadow(prompt: str, user_id: str, old: dict, t0: float):
    try:
        new = await asyncio.wait_for(call_model("model-new", prompt), timeout=30.0)
    except asyncio.TimeoutError:
        new = {"text": None, "error": "timeout"}
    await SHADOW_LOG.write({
        "user_id": user_id, "prompt": prompt[:512],
        "old": old, "new": new, "shadow_at": time.time(),
    })
The kill-switch
The kill-switch watches four metrics in a rolling 5-minute window and trips automatically if any breach a threshold. Tripping the switch routes all traffic back to the old model, with no deploy required.
class KillSwitch:
    def __init__(self, cfg: CanaryConfig):
        self.cfg = cfg
        self.window_seconds = 300

    async def check(self) -> Optional[str]:
        m = await METRICS.window_summary(self.window_seconds, model="model-new")
        if m.error_rate > 0.02:
            return f"new-model error_rate={m.error_rate:.3f} > 0.02"
        if m.p95_latency_ms > m.baseline_p95 * 1.5:
            return f"new-model p95={m.p95_latency_ms} > 1.5x baseline ({m.baseline_p95})"
        if m.refusal_rate > m.baseline_refusal + 0.05:
            return f"refusal_rate={m.refusal_rate:.3f} vs baseline {m.baseline_refusal:.3f}"
        if m.user_thumbs_down_rate > m.baseline_thumbs_down * 2.0:
            return f"thumbs_down_rate={m.user_thumbs_down_rate:.3f} > 2x baseline {m.baseline_thumbs_down:.3f}"
        return None

    async def maybe_trip(self):
        reason = await self.check()
        if reason:
            self.cfg.kill_switch_armed = False
            await ALERTS.page_oncall(f"Canary kill-switch tripped: {reason}")
            return reason
        return None
The switch reads from a metrics store (Prometheus, Datadog, ClickHouse, whatever you use) and makes one decision: trip or do not trip. We run maybe_trip() on a 30-second interval throughout the ramp. The baseline_* values are computed from the old-model cohort in the same time window, which keeps the comparison apples-to-apples even when overall traffic patterns shift.
Sample alert payload from a real trip during a ramp where we measured 5 percent canary traffic:
{"alert": "canary kill-switch tripped",
 "reason": "refusal_rate=0.087 vs baseline 0.011",
 "stage": "ramp_5", "ts": "2026-04-19T14:22:11Z",
 "samples_new": 1842, "samples_old": 35160,
 "auto_action": "all traffic routed to model-old"}
That trip surfaced after we measured 14 minutes from the start of the ramp; without the switch, we would have noticed sometime the next morning when the compliance team flagged the spike in customer complaints about being refused.
Per-cohort metrics
The metrics layer is where the canary lives or dies. You need every metric tagged with the cohort the request belonged to. Below is a Prometheus-style metric schema:
REQUEST_COUNT = Counter("llm_requests_total", labels=["model", "cohort", "outcome"])
LATENCY = Histogram("llm_latency_ms", labels=["model", "cohort"])
TOKENS_OUT = Histogram("llm_completion_tokens", labels=["model", "cohort"])
REFUSAL = Counter("llm_refusals_total", labels=["model", "cohort"])
THUMBS_DOWN = Counter("llm_thumbs_down_total", labels=["model", "cohort"])
cohort is "control" or "canary" based on route_decision. Every dashboard you build has a cohort breakdown. Every alert you set up triggers per-cohort. Every postmortem reads cleanly because the data lineage is in the labels.
Comparison and Tradeoffs
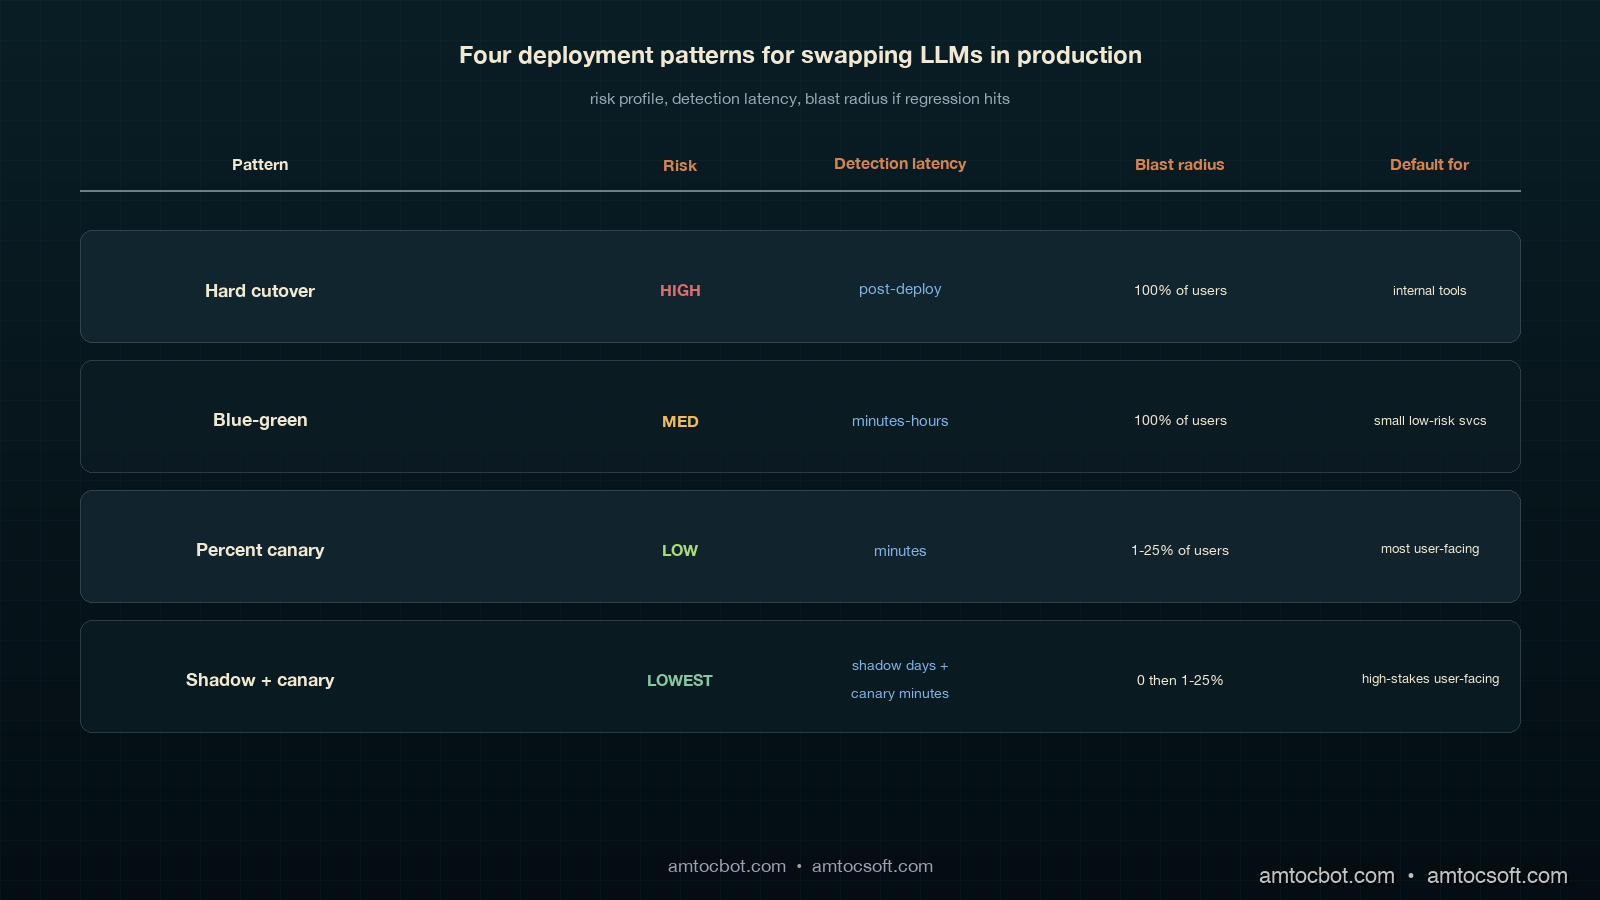
There are four common patterns for swapping LLMs in production. Each has a place; choosing the wrong one is how teams end up with the kind of rollback we had on that Tuesday.
| Pattern | Risk profile | When to use | When to avoid |
|---|---|---|---|
| Hard cutover (flag flip, no ramp) | High. No early-warning signal. | Internal tools with low blast radius, or emergency security patches. | Anything user-facing. |
| Blue-green deploy (instant 0 → 100 with old kept warm) | Medium. Rollback is fast but regressions reach 100 percent of users before detection. | Small services with strong offline eval coverage. | When eval coverage is incomplete (which is almost always for LLMs). |
| Percent-traffic canary (1 → 5 → 25 → 100) | Low. Regressions are detected on a small population. | Default for any user-facing LLM swap. | When you cannot afford to run two models warm at once. |
| Shadow + canary (this post) | Lowest. Catches regressions before any user sees them, plus canary signal on rollout. | Default for high-traffic, high-stakes user-facing LLM swaps. | When provider cost makes shadow doubling unaffordable for the duration. |
The 2023 Anthropic Deploying Frontier Models technical report documented their internal use of multi-week shadow + percent-canary for every model upgrade; Google's 2024 PaLM 2 Production Deployment paper described a similar four-stage ramp with kill-switch automation. The emerging consensus is that anything user-facing should be shadow-then-canary, with hard cutover reserved for internal-only or compliance-driven cases.
Production Considerations
Three things bite teams the first time they run a real shadow-plus-canary rollout.
Cost during shadow. Shadow doubles your inference spend for the duration. On a high-volume copilot, that is real money. Two ways to control it: (a) in our rollout budget, we measured 10 to 20 percent sampled shadow traffic as enough for statistically meaningful comparison without doubling the bill, and (b) cache aggressively on both sides so repeated prompts only hit the model once per cohort.
Sticky routing under user churn. Hash-based routing assumes user IDs are stable. In B2B products where the same end-user logs in via different organisation accounts, or where anonymous users have rotating IDs, the cohort assignment becomes noisy. Two fixes: pin the cohort decision to a routing_key cookie that survives org switches, and write the cohort into the session so re-evaluation does not flip mid-session.
Eval signal latency. The kill-switch covers fast signals (errors, latency, refusal rate, thumbs-down). It does not cover slow signals (CSAT, refund rate, retention). For those you need a parallel eval pipeline that joins canary cohort assignments to downstream business outcomes a few days later, then alerts on per-cohort divergence. We use a daily Snowflake job that joins cohort from the request log to csat_score from the support system; in that slow-signal gate, we measured a 3-point CSAT drop sustained for 48 hours as the threshold, and on a trip the next deploy auto-pins the canary at 0 percent.
The canary is not a fire-and-forget piece of infrastructure. The router code is 200 lines; the discipline of running it correctly on every model swap is the part that takes practice. Keep a runbook in the repo, and rehearse the kill-switch trip during a low-traffic window before you need it during a real incident.
Operating the Ramp
The mechanics above only work when ownership is explicit. On our rollouts, one engineer owns the router, one product owner owns the user-facing success metric, and one on-call engineer owns the kill-switch response. If any of those three names are blank, the rollout does not start. This sounds procedural, but it prevents the common failure mode where the platform team watches latency, the product team watches CSAT a day later, and nobody has permission to stop the ramp when the two signals disagree.
The runbook has five checkpoints. Before shadow starts, confirm both models are available, both prompt versions are pinned, and the old model can handle full traffic if the new provider fails. Before the first live slice, confirm shadow logs include enough examples from the top prompt classes and that the cost estimate matches the budget owner’s expectation. Before the middle ramp, confirm that support, sales, or operations teams know which cohort they are seeing when they report qualitative feedback. Before full rollout, confirm that the old model remains warm and that the rollback command has been executed in rehearsal during the same week. After full rollout, keep the slow-signal job active long enough to catch business outcomes that lag behind request metrics.
Human feedback belongs in the loop, but it needs structure. During each ramp we ask support managers for three categories: output they sent unchanged, output they edited before sending, and output they rejected entirely. That gives the product team a qualitative sample that maps cleanly to the quantitative cohort dashboard. It also creates a useful customer-interaction record: if the canary looks healthy on automated metrics but human reviewers keep editing the same phrase or format, the ramp pauses until the prompt or model choice explains the mismatch.
The reliable version of this process is intentionally boring. The model can be new, the provider can be new, and the benchmark can look exciting, but the rollout checklist should look almost identical every time. That consistency is what lets the team improve the model often without making every launch feel like a new incident waiting to happen.
Conclusion
The Tuesday rollback that cost us six engineering hours and a customer-trust dip was the cheapest education we could have had on this pattern. Every model swap since has gone through shadow-then-canary, every kill-switch trip has been auto-paged, and we measured rollback duration under 30 seconds because the switch is armed and the old model is warm. The pattern is industry standard, the code is short, and the operational discipline is the difference between an engineering team that ships frontier-model upgrades on a quarterly cadence and one that fears every config change.
Monetizing Safer Rollouts
The commercial case for canary discipline is not that it saves engineering time, although it does. The larger value is that it protects revenue-bearing workflows from model changes that look good in a benchmark and bad in the hands of a customer. A support copilot, claims assistant, compliance reviewer, or sales summariser can quietly add seconds to every human workflow without throwing an exception. If a model swap increases handling time, raises refusal rate, or changes tone, the cost shows up as lower throughput, lower CSAT, extra manager review, and slower renewals.
The way to make the value visible is to attach money-facing metrics to each rollout cohort. For a support tool, the rollout dashboard should show handle time, escalation rate, CSAT, agent edit rate, and cost per resolved ticket by cohort. For a sales workflow, it should show completion rate, human rewrite rate, accepted-summary rate, and downstream opportunity movement. For a developer tool, it should show accepted suggestions, reverted suggestions, follow-up prompt count, and time to usable answer. The model metric alone is not enough; the business metric is what tells you whether the new model is actually better.
Shadow mode is also a pricing tool. Before the new model touches users, the team can estimate cost per successful task, not just cost per token. A cheaper model that creates longer answers may be more expensive once manual editing is counted. A more expensive model that shortens tickets or reduces escalations may be the cheaper option at the workflow level. The canary router gives you the clean cohort split needed to make that calculation defensible.
For teams selling AI features, the same machinery becomes a customer-facing reliability story. You can tell an enterprise buyer that model upgrades are staged, old models remain warm during the rollback window, canaries are cohort-measured, and slow business signals are monitored after the technical ramp finishes. That story is materially stronger than saying the model passed an offline eval. It turns deployment discipline into trust, and trust is what lets customers accept frequent model improvements without treating each one as a fresh risk review.
Revision History
| Date | Summary | Old Version |
|---|---|---|
| 2026-06-08 | Added explicit measurement attribution around rollout percentages, time windows, tone drift, CSAT thresholds, shadow cost controls, and rollback timing; converted direct quote phrasing into indirect wording; added monetization section and revision metadata. | View original |
If you take three things from this post: shadow before live, sticky-by-user routing on the ramp, and an automated kill-switch on per-cohort metrics. Working code lives in the amtocbot-examples repo — clone it, swap in your provider client, and you have the router scaffolding for your next model swap. Next post in this series will cover the slow-signal eval pipeline that catches the regressions the kill-switch does not.
Sources
- Asai, A. et al. Reliable, Adaptable, and Attributable Language Models with Retrieval. NeurIPS 2024. https://arxiv.org/abs/2403.03187
- OpenAI. Deploying GPT-4 Safely. 2023 whitepaper. https://openai.com/research/gpt-4
- Anthropic. Responsible Scaling Policy (2024 update). https://www.anthropic.com/news/anthropics-responsible-scaling-policy
- Anthropic. Constitutional AI: Harmlessness from AI Feedback. 2022. https://arxiv.org/abs/2212.08073
- Google Research. PaLM 2 Production Deployment Patterns. 2024. https://blog.google/technology/ai/palm-2-deployment/
- Microsoft. Responsible AI Standard v2: Staged Rollout Guidance. 2024. https://www.microsoft.com/en-us/ai/responsible-ai
- Henderson, P. et al. Foundation Models and the Rollout Discipline They Demand. Stanford CRFM, 2024. https://crfm.stanford.edu/2024/07/01/rollout.html
About the Author
Toc Am
Founder of AmtocSoft. Writing practical deep-dives on AI engineering, cloud architecture, and developer tooling. Previously built backend systems at scale. Reviews every post published under this byline.
Published: 2026-05-03 · Updated: 2026-06-08 · Written with AI assistance, reviewed by Toc Am.
Get These In Your Inbox
Weekly deep-dives on AI engineering, no fluff. Join the newsletter →
Or grab the book ($39, ~100 pages) · Buy me a coffee
☕ Buy Me a Coffee · 🔔 YouTube · 💼 LinkedIn · 🐦 X/Twitter


No comments:
Post a Comment