Showing posts with label Production. Show all posts

Sunday, May 31, 2026

Context Engineering as Infrastructure: The 2026 Field Guide

A build pipeline assembling context blocks into a model's input window

Introduction

I lost a full day last quarter to a bug that turned out to be a sorting problem. Our support agent had started giving subtly stale answers, quoting a refund policy we had retired months earlier. The retrieval was fine. The policy doc in the vector store was current. The model was the same one that had worked the week before. The bug was that our context assembler appended retrieved chunks in similarity order, and a high-similarity but outdated changelog snippet kept landing in the last few hundred tokens before the question, right where the model pays the most attention. The model was not wrong. It was answering the context we actually gave it, which was not the context I thought we were giving it.

That day reframed how I think about this work. I had spent weeks treating the prompt as the thing to tune, when the real artifact was the pipeline that decided what went into the prompt. That pipeline is what the field now calls context engineering, and in 2026 it has become the defining discipline of building with LLMs, the practice of architecting the entire information environment for a model rather than wordsmithing a single instruction (Sombra, AI Context Engineering 2026). Context quality, not context volume, is the limiting factor now (The New Stack, 2026).

This is a field guide to treating context as infrastructure: a pipeline you build, test, and monitor, with the same rigor you give any other production system.

The Problem: The Prompt Was Never the Artifact

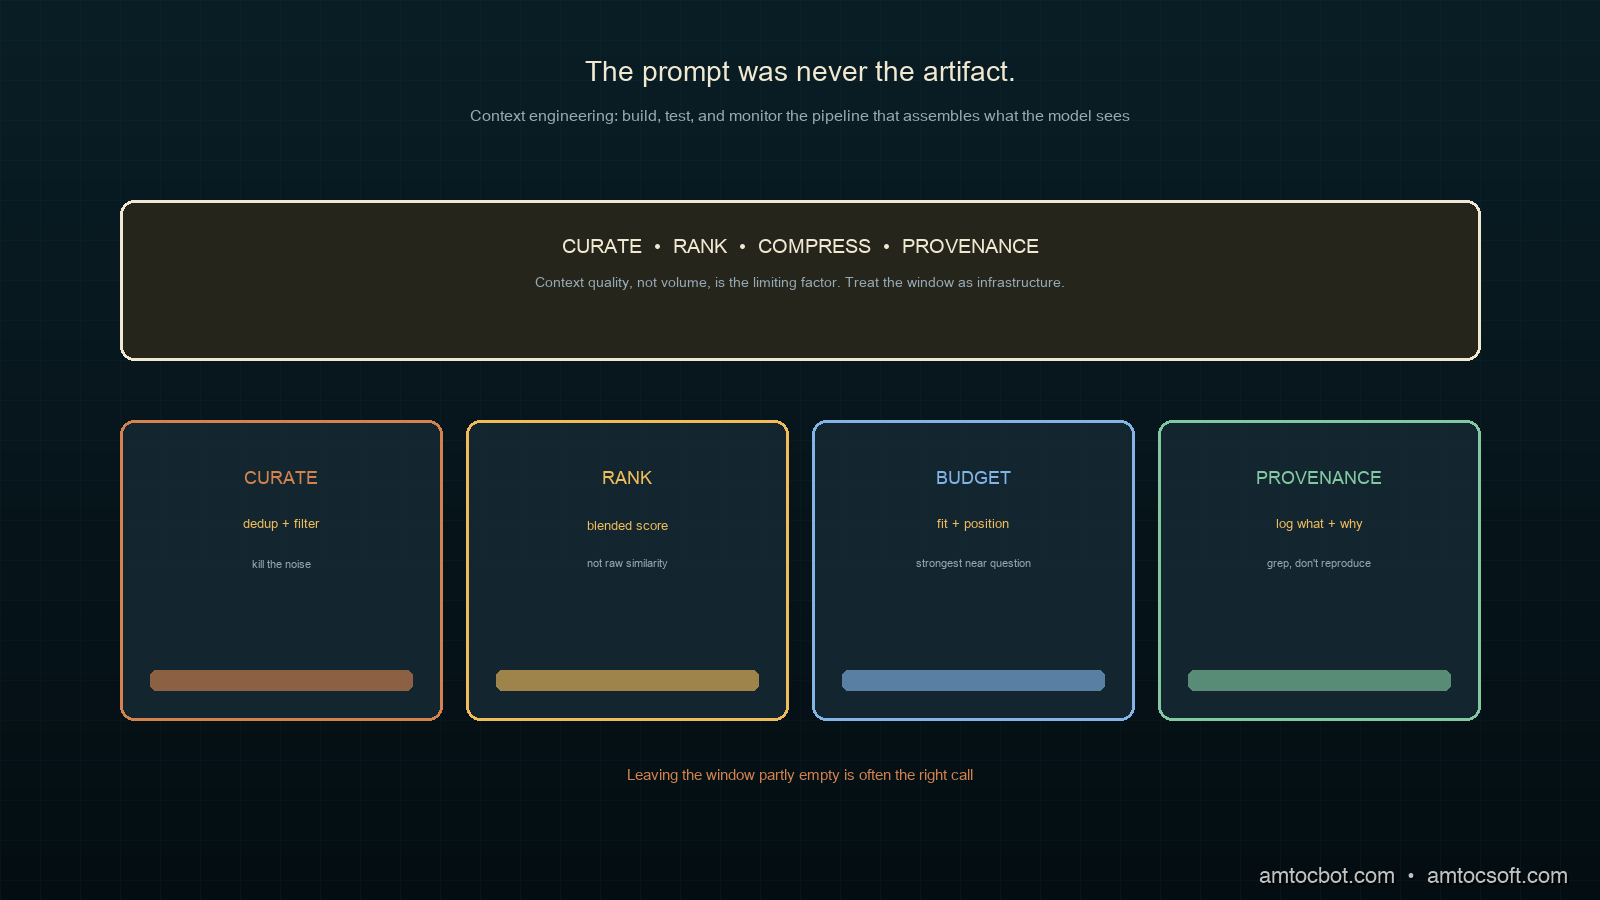
Prompt engineering treated the model's input as a string to be crafted. That worked when the input was small and static. It stops working the moment the input is assembled at runtime from many sources: retrieved documents, conversation history, tool outputs, user profile, system rules. At that point the interesting decisions are no longer about wording. They are about selection, ordering, compression, and provenance.

Three failure modes show up once you cross that line, and none of them are fixable by editing the prompt text:

  1. Position blindness. Models attend unevenly across their window. Critical facts buried in the middle of a long context get underweighted, a pattern robust enough that retrieval order materially changes answers. My stale-refund bug was exactly this.

  2. Context dilution. Stuffing more into the window feels safer but is not. Every irrelevant token competes with the relevant ones for attention and pushes up cost and latency. Beyond a point, more context makes answers worse, not better.

  3. Untraceable answers. When something goes wrong, you need to know which tokens produced the answer. If your assembly step keeps no record of what it put in the window and why, every incident becomes an archaeology dig instead of a log query.
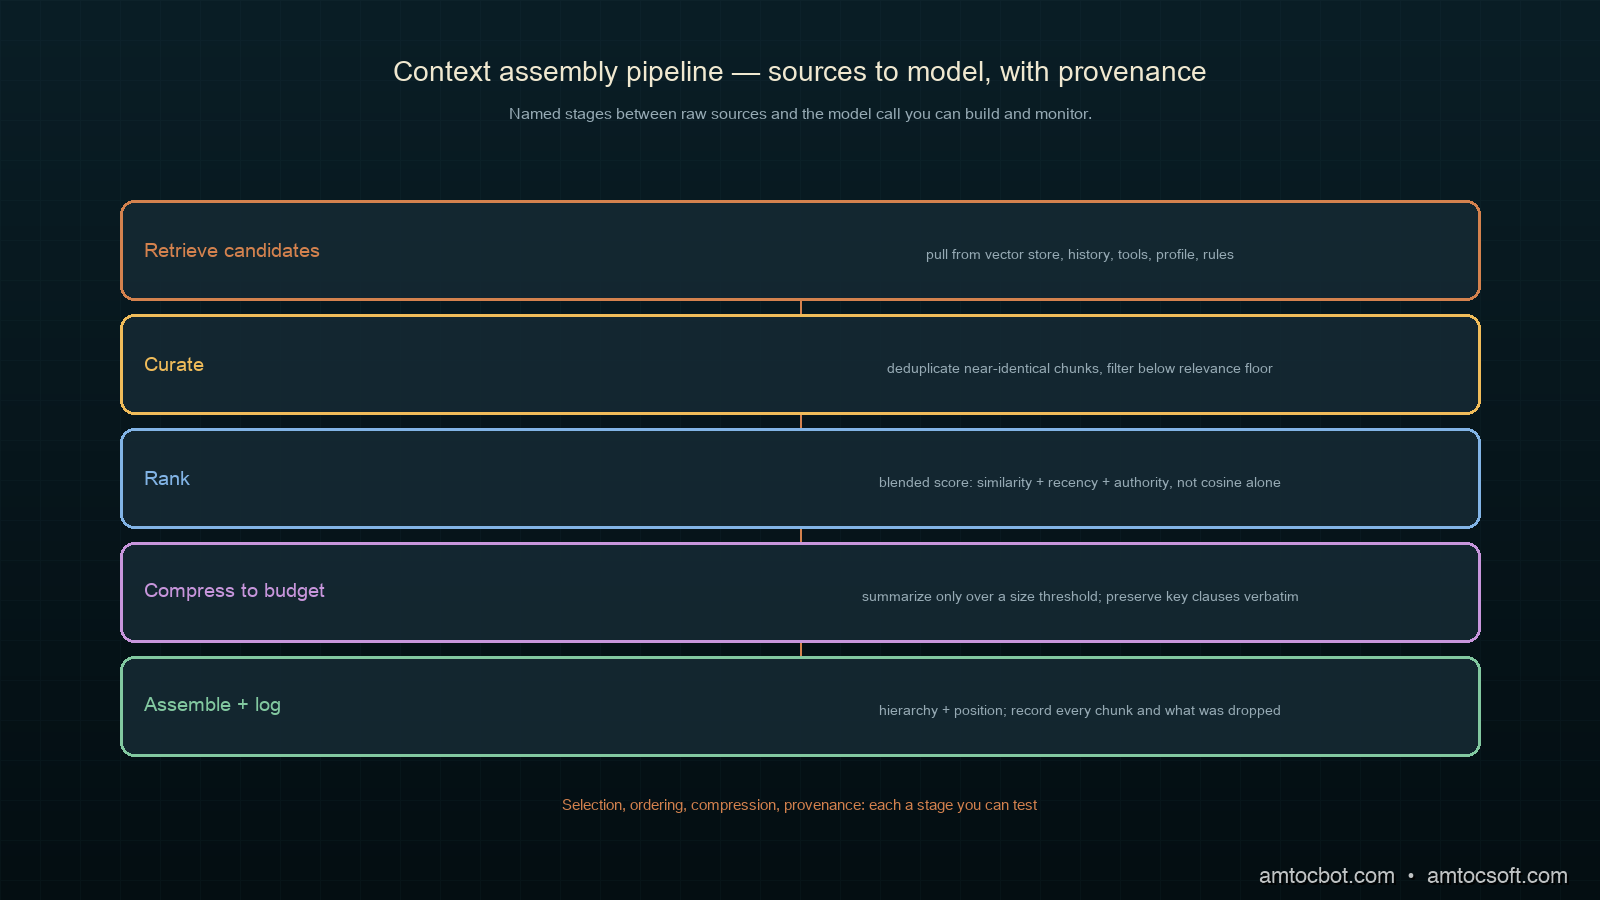
Architecture diagram of a context assembly pipeline: sources feeding a curate-rank-compress-assemble stage into the model

The shift is from asking what I should say to the model toward asking what information environment I should construct for it, and how I know I constructed the right one. That second question is an engineering question, and it has engineering answers.

How It Works: The Assembly Pipeline

Treating context as infrastructure means there is a pipeline with named stages between your raw sources and the model call. Here is the shape of it.

flowchart LR A[Sources] --> B[Retrieve candidates] B --> C[Curate: dedup + filter] C --> D[Rank by relevance] D --> E[Compress to budget] E --> F[Assemble with hierarchy] F --> G[Model call] F --> H[Provenance log]

The stage that earns its keep first is curation, because it is where you remove the noise that would otherwise dilute everything downstream. Deduplication and filtering before ranking mean the ranker is choosing among genuinely distinct, plausibly-relevant candidates rather than near-duplicate chunks that crowd each other out. Smart summarization that keeps the critical content while pruning redundancy is what separates a system that stays usable over long sessions from one that degrades (Digital Applied, Agent Reliability Playbook 2026).

The second load-bearing stage is assembly with hierarchy. Headers segment context into addressable units, and a model working through clearly-sectioned context navigates to what is relevant for the task (Packmind, Context Engineering Best Practices 2026). Order matters too: put the most decision-relevant material where the model attends most, which in practice means near the question, not buried in the middle.

Implementation Guide: Building the Pipeline

Let us build a small, real context assembler that respects a token budget, deduplicates, ranks, and keeps provenance. Start with the budget, because every other decision is a negotiation against it.

from dataclasses import dataclass, field

@dataclass
class Chunk:
    source: str
    text: str
    score: float          # relevance, 0..1
    tokens: int

@dataclass
class AssemblyResult:
    blocks: list[Chunk]
    used_tokens: int
    dropped: list[str] = field(default_factory=list)

def estimate_tokens(text: str) -> int:
    # Rough heuristic: ~4 chars per token. Swap for a real tokenizer in prod.
    return max(1, len(text) // 4)

Next, deduplicate near-identical chunks before ranking. The cheap, effective approach is shingled Jaccard similarity: if two chunks share most of their word-shingles, keep the higher-scored one.

def shingles(text: str, n: int = 5) -> set[str]:
    words = text.lower().split()
    return {" ".join(words[i:i + n]) for i in range(len(words) - n + 1)}

def dedupe(chunks: list[Chunk], threshold: float = 0.8) -> list[Chunk]:
    kept: list[Chunk] = []
    for c in sorted(chunks, key=lambda x: x.score, reverse=True):
        c_sh = shingles(c.text)
        dup = False
        for k in kept:
            k_sh = shingles(k.text)
            if c_sh and k_sh:
                jac = len(c_sh & k_sh) / len(c_sh | k_sh)
                if jac >= threshold:
                    dup = True
                    break
        if not dup:
            kept.append(c)
    return kept

Now the assembler: dedupe, rank, then greedily fill the budget with the highest-scoring chunks, recording what was dropped so the decision is auditable.

def assemble(chunks: list[Chunk], budget_tokens: int) -> AssemblyResult:
    deduped = dedupe(chunks)
    ranked = sorted(deduped, key=lambda c: c.score, reverse=True)

    blocks: list[Chunk] = []
    used = 0
    dropped: list[str] = []
    for c in ranked:
        if used + c.tokens <= budget_tokens:
            blocks.append(c)
            used += c.tokens
        else:
            dropped.append(f"{c.source} (score={c.score:.2f}, {c.tokens} tok)")

    # Position the highest-scoring block LAST, nearest the question.
    blocks.sort(key=lambda c: c.score)
    return AssemblyResult(blocks=blocks, used_tokens=used, dropped=dropped)

Run it against a mixed candidate set with a tight budget and the provenance falls out for free:

$ python assemble.py --budget 800
[assemble] 11 candidates -> 7 after dedupe -> 5 fit in 800 tokens
  kept:
    policy/refunds-v3.md      score=0.94  120 tok   (placed nearest question)
    faq/refund-window.md      score=0.88  140 tok
    policy/shipping.md        score=0.71  160 tok
    kb/returns-process.md     score=0.66  180 tok
    chat/turn-14.md           score=0.61  190 tok
  dropped (over budget):
    changelog/2025-q3.md      score=0.83  220 tok   <-- the stale snippet, correctly dropped
    faq/refund-window.md      (duplicate of kept chunk)
used 790/800 tokens

That changelog/2025-q3.md line is the bug from my introduction, now visible and handled. Because dedupe and the budget log every decision, the stale snippet either gets dropped or, if it does sneak in, shows up in a log I can grep instead of a mystery I have to reproduce.

Decision Flow: What Goes in the Window

Not every available token should be spent. The assembler needs a policy for what is worth including, and that policy is itself a guardrail against dilution.

flowchart TD A[Candidate chunk] --> B{Score above floor?} B -->|no| X[Drop: not relevant enough] B -->|yes| C{Duplicate of a kept chunk?} C -->|yes| X2[Drop: redundant] C -->|no| D{Fits in remaining budget?} D -->|yes| E[Include + log provenance] D -->|no| F{Higher score than a kept chunk?} F -->|yes| G[Evict lower-scored, include this] F -->|no| X3[Drop: budget full]

The rule that does the most work is the relevance floor. A chunk that scores below the floor never enters the window even if there is budget to spare, because empty budget is cheaper than diluted budget. This is the counterintuitive heart of context engineering: leaving the window partly empty is often the right call. More tokens are not more help.

A Gotcha: When Compression Ate the Answer

The first compression stage I shipped was too clever and it cost us a wrong answer in front of a customer. To fit more into the budget, I summarized each retrieved chunk with a small model before assembly, on the theory that a 50-token summary of a 200-token doc let me fit four times as much. It worked in testing and then failed on a precise question.

The customer asked whether refunds applied to digital goods specifically. The relevant doc spelled out that refunds apply to all physical goods within the standard return window, and that digital goods are non-refundable. My summarizer compressed that down to a generic line about refunds applying within the return window, which is true in spirit and catastrophically wrong for this question. The summary dropped the exact qualifier the question hinged on.

$ python debug_answer.py --q "are digital goods refundable?"
retrieved: policy/refunds-v3.md (full): physical goods within return window;
           digital goods are non-refundable.
assembled: policy/refunds-v3.md (summary): refunds apply within return window.
model answer: Yes, you can request a refund.   <-- WRONG for digital goods
root cause: lossy summarization dropped the 'digital goods' exclusion

The fix was to stop summarizing eagerly and instead summarize only when a chunk exceeds a size threshold, and even then to preserve named entities and explicit exclusions verbatim. Better still, for high-stakes factual chunks, I now pass them through whole and spend the budget I save by dropping low-score chunks entirely. The lesson: compression is a tradeoff against fidelity, and the tokens you save mean nothing if you compress away the one clause the answer depended on. Test your compressor against precise, qualifier-heavy questions, not just broad ones.

Scoring Beyond Similarity

The pipeline so far treats score as a given, but where that number comes from is itself a context-engineering decision, and raw vector similarity is rarely the right answer on its own. Cosine similarity tells you a chunk is semantically near the query. It does not tell you the chunk is fresh, authoritative, or the kind of source this question needs. A high-similarity but stale changelog, the exact villain of my refund bug, scores well on similarity and badly on everything that actually matters.

A more honest score blends similarity with signals you already have. Recency, source authority, and a light penalty for length all push the ranker toward chunks that are not just topically close but actually trustworthy for the task.

import math

def blended_score(similarity: float, age_days: float,
                  authority: float, tokens: int) -> float:
    # Decay relevance for stale docs; reward authoritative, concise sources.
    recency = math.exp(-age_days / 180.0)        # half-life ~6 months
    length_penalty = 1.0 / (1.0 + tokens / 500)  # gently disfavor bloat
    return 0.6 * similarity + 0.25 * recency + 0.15 * authority * length_penalty

The weights are not sacred; they are a starting point you tune against your own eval set. What matters is that the score the assembler ranks on encodes more than topical nearness. Re-running the earlier example with blended scoring, the stale changelog falls below the relevance floor on its own, before the budget stage ever has to drop it.

$ python rank.py --query "are digital goods refundable?" --blended
  policy/refunds-v3.md   sim=0.91 age=12d  auth=1.0  -> 0.93  keep
  faq/refund-window.md   sim=0.88 age=40d  auth=0.8  -> 0.85  keep
  changelog/2025-q3.md   sim=0.83 age=240d auth=0.4  -> 0.61  below floor (0.65), dropped
floor=0.65: 1 stale chunk dropped before budget stage

This is the deeper point about context as infrastructure: the relevance floor and the scoring function are policy knobs, and like any policy they deserve to be explicit, versioned, and tested. A team that hardcodes top-k cosine similarity has made a scoring decision by accident. A team that writes blended_score has made one on purpose, and can change it deliberately when the data shifts. The difference shows up months later, when a stale source starts creeping into answers and one team can adjust a weight while the other is reverse-engineering why retrieval "suddenly got worse."

The same discipline extends to negative signals. If a source has been flagged as deprecated, the cleanest fix is not to delete it from the store but to give it an authority of zero so it can never outrank a live document, while still being available if a user explicitly asks about historical policy. Encoding that as a score is far more robust than hoping it never gets retrieved.

Comparison and Tradeoffs

How do the common context strategies compare in practice? Here is my scoring after a year of running this pipeline.

Strategy Controls dilution Handles position Traceable Latency cost Verdict
Stuff everything in the window No No No High Feels safe, degrades quality
Tune the prompt wording only No No No None Necessary, not the real lever
Top-k retrieval, raw order Weak No Weak Medium The common default, leaves wins on the table
Dedupe + rank + budget Yes Partial Yes Low The baseline worth building
Eager summarize-everything Partial No Weak Medium Risks dropping the key clause
Curate + rank + position + provenance Yes Yes Yes Low The pipeline you actually want
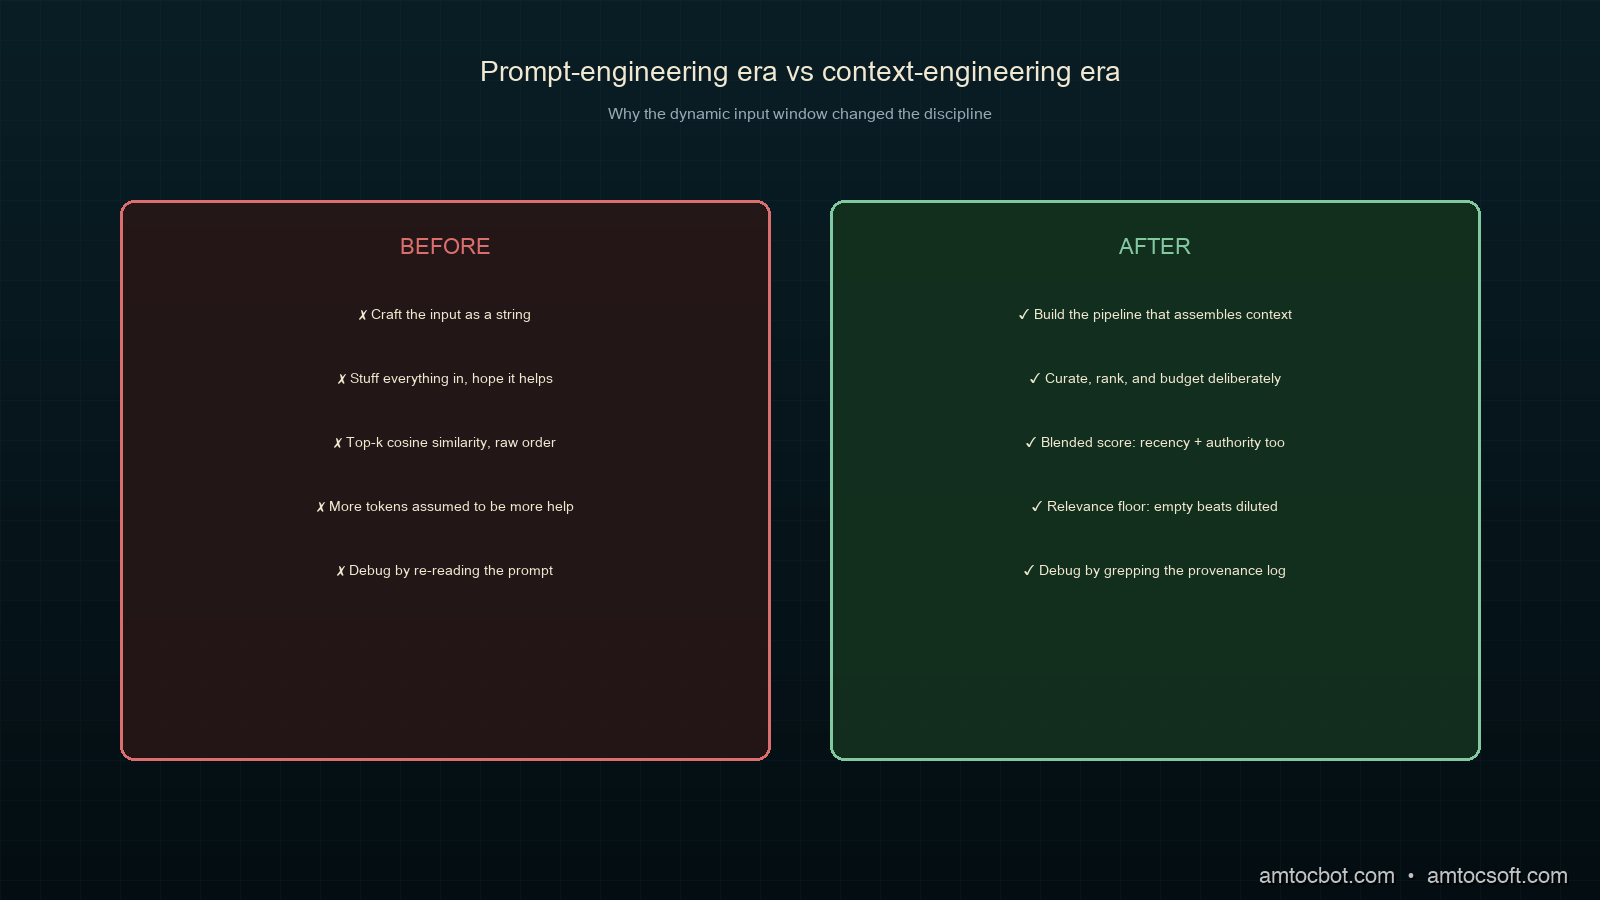
flowchart LR subgraph Prompt["Prompt-engineering era"] P1[Craft the string] --> P2[Hope retrieval helps] --> P3[Debug by re-reading] end subgraph Context["Context-engineering era"] C1[Build the pipeline] --> C2[Curate + rank + budget] --> C3[Debug by grepping provenance] end Prompt -.the input grew dynamic.-> Context
Comparison visual: prompt-engineering era versus context-engineering era

The core tradeoff is fidelity versus density. Every compression and every dropped chunk buys you room and risks losing something. The discipline is to make those tradeoffs explicit and logged rather than implicit and invisible. A pipeline that records what it dropped and why turns a class of silent quality bugs into visible, debuggable events, which is the whole reason to treat context as infrastructure in the first place.

Production Considerations

A few things that matter once the pipeline is live.

Log provenance on every call. Record which chunks went into each window, their scores, and what was dropped. This is your single most useful artifact when an answer goes wrong, and it is nearly free to produce. Treat the context window like any other request you would trace.

Monitor budget utilization and drop rates. If you are constantly dropping high-score chunks, your budget is too small or your retrieval is too noisy. If your window is half empty on hard questions, your relevance floor may be too high. Both are dashboards, not guesses.

Version your assembly logic. Changing the ranker or the compressor changes every answer the system gives. Treat assembly changes like schema migrations: version them, and be able to replay old questions against a new pipeline to catch regressions before users do.

Test against qualifier-heavy questions. The questions that break context pipelines are the precise ones, where a single dropped clause flips the answer. Keep a suite of these and run it on every pipeline change.

Exploit the cache by ordering for stability. Most providers cache a common prefix of the input, so the layout of your window has a direct cost consequence. Put the stable material first, the system rules and long-lived reference docs that rarely change between requests, and the volatile material last, the retrieved chunks and the user turn. A pipeline that reshuffles its whole window on every request throws away the cache and pays full price each time; one that keeps a stable prefix can see large reductions in cost and latency on repeat traffic. This is a place where the context-as-infrastructure framing pays off directly: the same provenance log that tells you what went into the window also tells you how much of it was cacheable, which turns a vague sense that the LLM bill is high into a specific diagnosis: prefix stability is low, and here is the chunk that keeps invalidating it.

Conclusion

The prompt was never the real artifact. The pipeline that assembles what the model sees is, and in 2026 building that pipeline well is the skill that separates reliable LLM systems from flaky ones. Context engineering is infrastructure work: selection, ordering, compression, and provenance, each a stage you can build, test, and monitor.

Start with a budget and a provenance log, because together they make every assembly decision explicit and auditable. Add deduplication and a relevance floor to fight dilution. Position your strongest material where the model attends most. Compress carefully, and never compress away the clause the answer depends on. Do that, and the next time an answer goes stale you will find the cause in a log line instead of losing a day to it, which is exactly the trade I wish I had made before that refund bug.

Working code for the full assembler, the deduper, and a provenance-logging harness lives in the companion repo: github.com/amtocbot-droid/amtocbot-examples/tree/main/262-context-engineering.


Get the next one

I send a weekly engineering note with one production failure, the debug trail, and the code or checklist that came out of it. No spam, unsubscribe anytime.

👉 Subscribe (free)

Reader challenge: inspect one LLM request path in your own system and write down which chunks entered the context window, which chunks were dropped, and why. Reply to the email or comment with the failure mode you found.


Revision History

Date Summary Old Version
2026-06-07 Added the newsletter signup and reader-challenge block so this recent context-engineering post feeds the owned audience funnel. View previous version

Sources

About the Author

Toc Am

Founder of AmtocSoft. Writing practical deep-dives on AI engineering, cloud architecture, and developer tooling. Previously built backend systems at scale. Reviews every post published under this byline.

LinkedIn X / Twitter

Published: 2026-06-03 · Updated: 2026-06-07 · Written with AI assistance, reviewed by Toc Am.

Get These In Your Inbox

Weekly deep-dives on AI engineering, no fluff. Join the newsletter →

Subscribe (free)

Or grab the book ($39, ~100 pages) · Buy me a coffee

Buy Me a Coffee · 🔔 YouTube · 💼 LinkedIn · 🐦 X/Twitter

Guardrails-First: Making AI Agents Reliable at 3am

A pager going off next to a terminal showing an AI agent stuck in a retry loop

Introduction

At 3:14am on a Tuesday I got paged because our deployment agent had spent forty minutes "fixing" a failing migration. It had not fixed anything. It had run the same ALTER TABLE eleven times, each time getting the same lock-timeout error, each time deciding the right move was to try again with a slightly reworded SQL comment. The model was not broken. Every single step it took was locally reasonable. The system around it had no concept of "you have already tried this and it did not work," so it cheerfully kept going, convinced that attempt eleven would be different. We measured roughly 80,000 wasted tokens on a task that never moved an inch.

I sat there watching the log scroll and felt something flip in how I think about agents. I had spent weeks tuning the prompt. I had A/B tested system messages. I had picked the strongest model we could afford. None of it mattered, because the failure had nothing to do with the model's reasoning. The failure was that the loop around the model had no brakes. That is the realization this whole post is built on.

That night taught me the thing this post is about: a model that scores 87% on SWE-Bench Verified (Datadog State of AI Engineering, 2026) is not the same as an agent you can trust to run unattended for an hour. The gap between "works in the notebook" and "works reliably at 3am under load" has become the defining engineering problem of 2026 (The AI Agent Reliability Gap, DEV, 2026). Closing it is not about a smarter model. It is about the scaffolding you wrap around the model: the guardrails that decide what the agent is allowed to do, when it must stop, and how it recovers when a step fails.

This is a guardrails-first playbook. We will build up the patterns that turned our flaky overnight agents into ones I can actually sleep through.

The Problem: Local Reasonableness, Global Chaos

An LLM agent is a loop. It observes state, picks an action, executes it, observes the result, and repeats until it decides the task is done. Each iteration the model sees a prompt and emits the next step. The trouble is that the model optimizes one step at a time. It has no built-in memory of the trajectory unless you give it one, and no built-in sense of a budget unless you enforce one.

That produces three failure modes I see over and over in production logs:

  1. The retry spiral. A step fails for a reason the model cannot fix (a lock, a permission, a rate limit). The model retries, because retrying is usually a reasonable thing to do. Without a circuit breaker, "usually reasonable" becomes an infinite loop.

  2. Silent drift. The agent slowly wanders off the task. It was asked to update one config value and forty steps later it is refactoring an unrelated module because each small step seemed like an improvement. Roughly two thirds of production agent failures are this quiet kind, not loud crashes (New Stack, Agentic Development Trends 2026).

  3. Unbounded blast radius. The agent has a tool that can delete files or call an API, and nothing constrains which files or which API calls. One hallucinated argument and you are restoring from backups.

The common thread: none of these are model intelligence problems. They are systems problems. A guardrails-first design treats the model as a powerful but unreliable component and builds the reliability in the layer you control.

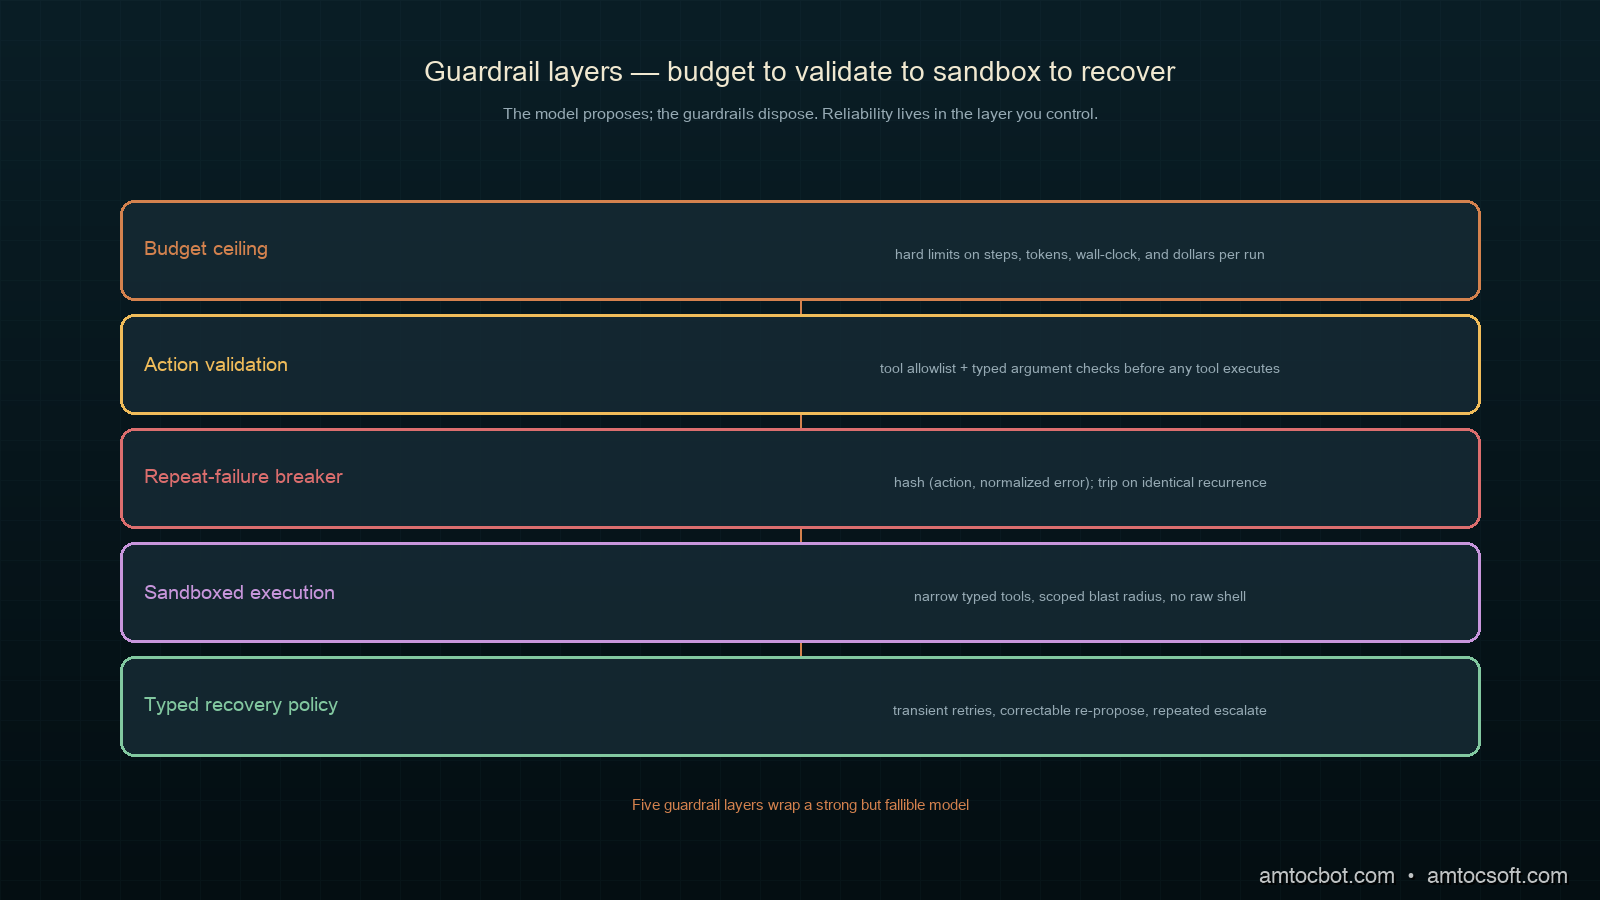
System diagram showing the model wrapped by budget, validation, and recovery layers

How It Works: The Guardrail Layers

Think of guardrails as concentric layers around the model call. The model proposes; the guardrails dispose. Here is the loop with the four layers that matter most.

flowchart TD A[Observe state] --> B{Budget check} B -->|exceeded| Z[Halt + escalate] B -->|ok| C[Model proposes action] C --> D{Validate action} D -->|invalid| E[Reject, feed error back] E --> C D -->|valid| F[Execute in sandbox] F --> G{Result ok?} G -->|yes| H{Task done?} G -->|no| I{Seen this failure before?} I -->|yes, twice| Z I -->|no| A H -->|no| A H -->|yes| Y[Return result]

The first layer is the budget. Every agent run gets a hard ceiling on iterations, tokens, wall-clock time, and money. This is the single highest-value guardrail, because it converts every other failure mode from "infinite" to "bounded." My 3am incident would have been a 6-minute annoyance instead of a 40-minute one if a budget had been in place.

from dataclasses import dataclass, field
import time

@dataclass
class Budget:
    max_steps: int = 25
    max_tokens: int = 200_000
    max_seconds: float = 300.0
    max_usd: float = 1.50
    started_at: float = field(default_factory=time.monotonic)
    steps: int = 0
    tokens: int = 0
    usd: float = 0.0

    def charge(self, tokens: int, usd: float) -> None:
        self.steps += 1
        self.tokens += tokens
        self.usd += usd

    def exceeded(self) -> str | None:
        if self.steps >= self.max_steps:
            return f"step limit {self.max_steps} reached"
        if self.tokens >= self.max_tokens:
            return f"token limit {self.max_tokens} reached"
        if time.monotonic() - self.started_at >= self.max_seconds:
            return f"time limit {self.max_seconds}s reached"
        if self.usd >= self.max_usd:
            return f"cost limit ${self.max_usd} reached"
        return None

When the budget trips, the agent does not silently die. It escalates: it writes a structured handoff (what it was doing, what it tried, why it stopped) and pages a human or falls back to a safe default. Here is what that escalation looks like in our logs when it works:

$ tail -f agent.log
[15:11:02] step=11 action=run_sql tokens=78201 usd=0.59
[15:11:02] GUARDRAIL halt: step limit 25 reached? no | repeat-failure: run_sql x3 identical error
[15:11:02] circuit_breaker tripped on signature 9f2c: 'lock timeout on ALTER TABLE orders'
[15:11:02] escalating: wrote handoff to /var/run/agent/handoff-9f2c.json, paged #oncall
[15:11:02] run halted cleanly after 11 steps, 0 destructive actions taken

The second layer is action validation. Before any tool runs, the proposed call is checked against a schema and a policy. Wrong shape, disallowed tool, argument outside the allowlist: rejected, with the reason fed back to the model so it can correct. Critically, a rejected action does not count as progress, and three rejections of the same kind trip the breaker.

Implementation Guide: Building the Guardrails

Let us assemble the pieces into something you can actually run. The first real guardrail beyond the budget is the circuit breaker on repeated failure. This is what would have saved me at 3am. The idea: hash the (action, error) pair into a signature, and if the same signature recurs, stop. Repeating an action that already failed identically is the clearest signal an agent is stuck.

import hashlib

class RepeatFailureBreaker:
    def __init__(self, threshold: int = 2):
        self.threshold = threshold
        self.counts: dict[str, int] = {}

    def signature(self, action: str, error: str) -> str:
        raw = f"{action}|{error}".encode()
        return hashlib.sha256(raw).hexdigest()[:4]

    def record(self, action: str, error: str) -> bool:
        """Returns True if the breaker should trip."""
        sig = self.signature(action, error)
        self.counts[sig] = self.counts.get(sig, 0) + 1
        return self.counts[sig] > self.threshold

Notice the breaker keys on the error, not just the action. An agent legitimately calls run_sql many times in one task. What it must never do is call run_sql and get the identical lock-timeout three times. Keying on the pair lets normal work proceed while catching the spiral.

The second piece is the action validator with an allowlist. Never give an agent a raw shell tool in production. Give it narrow, typed tools whose arguments you can validate.

from typing import Callable

ALLOWED_TABLES = {"orders", "customers", "line_items"}

def validate_run_sql(args: dict) -> str | None:
    sql = args.get("sql", "").strip().lower()
    if not sql.startswith(("select", "update", "insert")):
        return "only SELECT/UPDATE/INSERT permitted, no DDL or DROP"
    if not any(t in sql for t in ALLOWED_TABLES):
        return f"query must target an allowed table: {ALLOWED_TABLES}"
    if "where" not in sql and sql.startswith("update"):
        return "UPDATE without WHERE clause is blocked"
    return None

VALIDATORS: dict[str, Callable[[dict], str | None]] = {
    "run_sql": validate_run_sql,
}

def validate(tool: str, args: dict) -> str | None:
    if tool not in VALIDATORS:
        return f"tool '{tool}' is not on the allowlist"
    return VALIDATORS[tool](args)

That UPDATE without WHERE check is not hypothetical. The first week we ran an unattended data-cleanup agent, it proposed exactly that, an UPDATE orders SET status = 'archived' with no WHERE clause, which would have archived every order in the table. The validator caught it, fed back the error, and the model corrected to a scoped query on its next step. No drama, because the guardrail did its job before the tool ran, not after.

Now the agent loop that ties budget, validation, and the breaker together:

def run_agent(task: str, propose, execute, budget: Budget) -> dict:
    breaker = RepeatFailureBreaker(threshold=2)
    history: list[dict] = []

    while True:
        halt = budget.exceeded()
        if halt:
            return escalate(task, history, reason=halt)

        step = propose(task, history)          # model call
        budget.charge(step["tokens"], step["usd"])

        err = validate(step["tool"], step["args"])
        if err:
            history.append({"rejected": step, "error": err})
            if breaker.record(step["tool"], err):
                return escalate(task, history, reason=f"repeated invalid: {err}")
            continue

        result = execute(step["tool"], step["args"])
        if not result["ok"]:
            history.append({"action": step, "error": result["error"]})
            if breaker.record(step["tool"], result["error"]):
                return escalate(task, history, reason=f"repeated failure: {result['error']}")
            continue

        history.append({"action": step, "result": result})
        if result.get("task_done"):
            return {"status": "done", "steps": budget.steps, "history": history}

Run it against the 3am scenario and the behavior is now bounded:

$ python run_migration_agent.py --task "apply pending migration"
step 1  run_sql        ok      (begin)
step 2  run_sql        FAIL    lock timeout on ALTER TABLE orders
step 3  run_sql        FAIL    lock timeout on ALTER TABLE orders
step 4  run_sql        FAIL    lock timeout on ALTER TABLE orders
breaker tripped: signature 9f2c seen 3x
ESCALATE: apply pending migration -> paged oncall after 4 steps (12s, $0.09)

Four steps and twelve seconds instead of eleven steps and forty minutes. Same model, same prompt. The only thing that changed is the scaffolding decided when to quit.

A Gotcha: When the Guardrail Fights the Model

The first version of the circuit breaker I shipped was too aggressive, and it broke a working agent in a way that took me an embarrassing afternoon to diagnose. I had keyed the breaker on the action name alone, not the (action, error) pair. The logic was that if the agent called the same tool three times in a row, it was probably stuck. It sounded sensible in my head.

It was wrong. A legitimate file-editing agent calls write_file dozens of times in a single task, once per file it touches. My over-eager breaker tripped on the fourth file every single time, halted the run, and paged on-call for an agent that was doing exactly what it was supposed to. The symptom in the logs was maddening, because each individual write_file succeeded:

$ grep breaker agent.log
[09:02:11] write_file ok  path=src/a.py
[09:02:14] write_file ok  path=src/b.py
[09:02:17] write_file ok  path=src/c.py
[09:02:20] breaker tripped: write_file called 3x  <-- WRONG, these all succeeded
[09:02:20] ESCALATE: refactor module -> paged oncall (false alarm)

The fix was the one-line change you saw earlier: key the signature on action|error, not action. A successful call produces no error, so it never contributes to a breaker count. Three identical failures trip it; three successes do not. The lesson generalizes past this one bug: a guardrail that fires on healthy behavior is worse than no guardrail, because it trains your team to ignore the pager. Tune guardrails against your real trajectories, watch the false-positive rate, and treat a guardrail that cries wolf as a production incident in its own right.

There is a subtler version of this trap. Once the breaker keys on the error string, near-identical errors with different row IDs or timestamps can dodge it. lock timeout on row 4471 and lock timeout on row 4472 hash to different signatures, so the spiral slips through. The fix is to normalize the error before hashing: strip digits, UUIDs, and timestamps down to a stable template. We run errors through a small normalizer so that "lock timeout on row N" collapses to one signature regardless of which row triggered it.

import re

def normalize_error(error: str) -> str:
    error = re.sub(r"\b[0-9a-f]{8}-[0-9a-f-]{27,}\b", "<uuid>", error)
    error = re.sub(r"\b\d{4}-\d{2}-\d{2}[t ][\d:.]+\b", "<ts>", error)
    error = re.sub(r"\d+", "N", error)
    return error.strip().lower()

With normalization in place, the breaker sees the spiral for what it is rather than being fooled by cosmetic variation. This is the kind of detail that never shows up in a demo and always shows up at 3am.

Decision Flow: Recover, Retry, or Escalate

Not every failure should trip the breaker immediately. A rate limit wants a backoff and retry. A validation error wants a corrective hint. A repeated identical failure wants escalation. The recovery policy is itself a guardrail, and getting it right is the difference between an agent that is resilient and one that is either brittle or runaway.

flowchart TD F[Step failed] --> T{Failure type} T -->|transient: rate limit, 5xx| R[Backoff + retry, max 2] T -->|correctable: bad args, schema| C[Feed error to model, re-propose] T -->|repeated identical| E[Trip breaker, escalate] T -->|destructive blocked| C R -->|still failing| E C -->|breaker threshold hit| E E --> H[Write handoff + page human]

The rule of thumb I use: transient failures get a bounded retry with exponential backoff, correctable failures get fed back to the model as context, and anything that repeats identically gets escalated. The model is good at the correctable case and useless at the repeated-identical case, so the system handles the latter on its behalf.

Comparison and Tradeoffs

How do the common approaches to agent reliability stack up? Here is how I weigh them after a year of running agents in production.

Approach Stops retry spirals Bounds blast radius Catches drift Cost overhead Verdict
Bigger / smarter model only No No No High Necessary, never sufficient
Prompt "be careful" instructions Weak Weak Weak None Comfort blanket, not a guardrail
Budget + circuit breaker Yes Partial Partial Negligible Highest value per line of code
Tool allowlist + arg validation No Yes No Low Essential for any write access
Typed recovery policy Yes No Partial Low Turns brittle agents resilient
Full guardrails-first stack Yes Yes Yes Low What you actually want
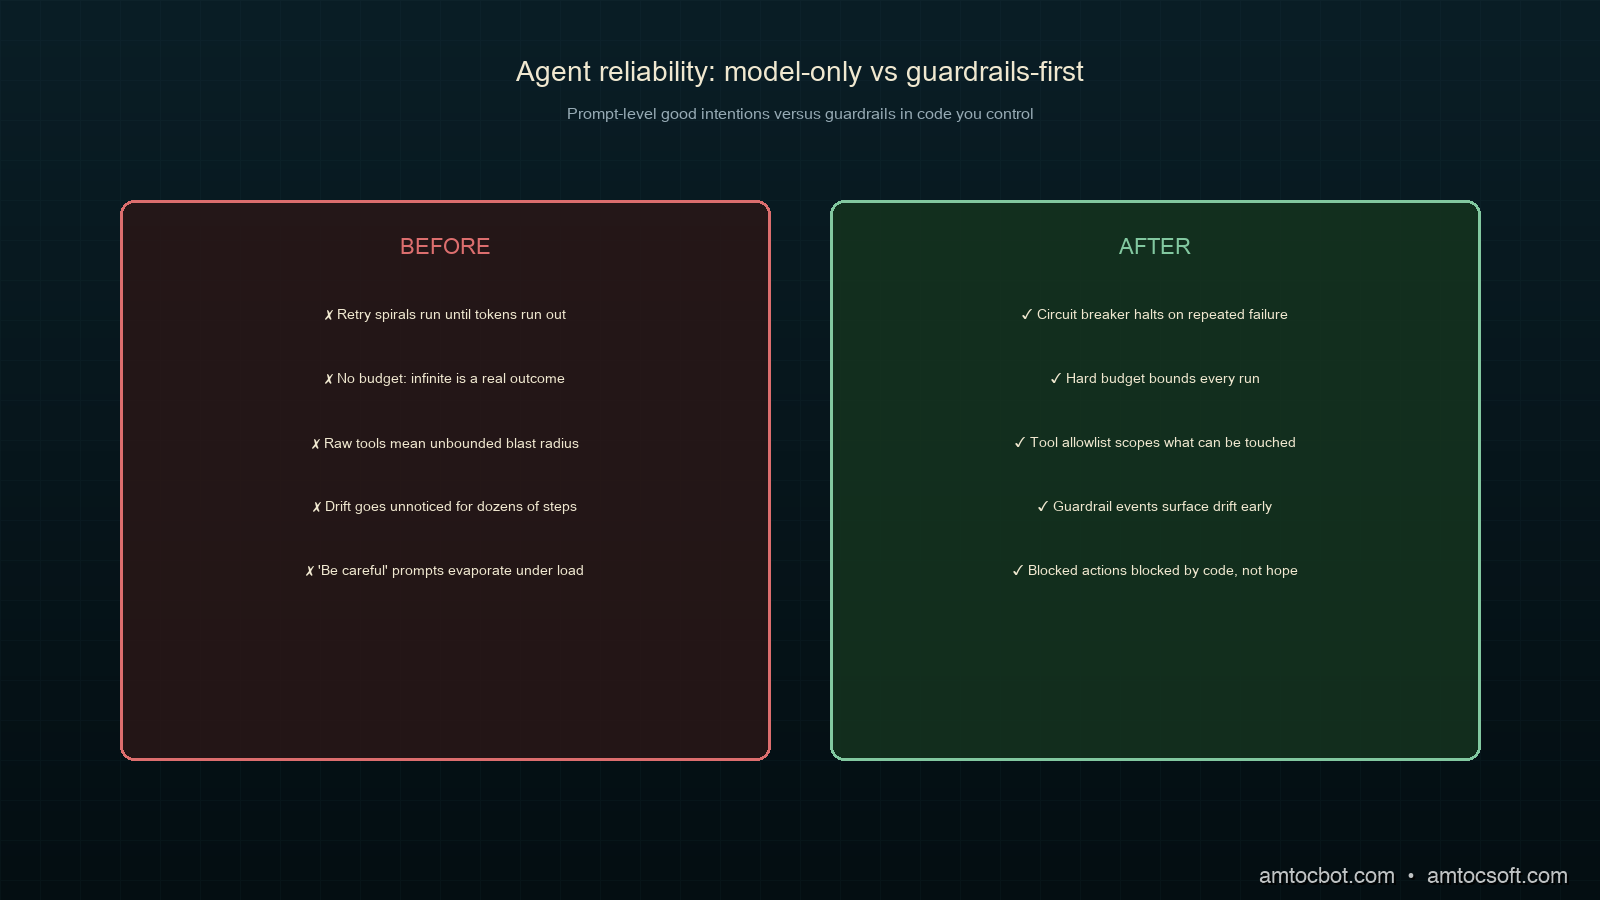
flowchart LR subgraph Before["Before: model-only"] M1[Model] --> M2[Tools] --> M3[Prod] end subgraph After["After: guardrails-first"] N1[Model] --> N2[Validate] --> N3[Budget] --> N4[Sandbox] --> N5[Recover] --> N6[Prod] end Before -.40 min runaway.-> After After -.12 sec halt.-> Done[Predictable]
Side-by-side comparison of a model-only stack versus a guardrails-first stack

The headline tradeoff is honesty versus theater. Prompt-level "be careful, do not delete anything" instructions feel like guardrails and cost nothing, which is exactly why they are dangerous. They work in the demo and evaporate under the one trajectory you did not test. Real guardrails live in code you control, where a blocked action is blocked by a function call, not by the model's good intentions.

The cost overhead of the real stack is genuinely small. A budget check is a few comparisons. A validator is a function call. The circuit breaker is a dictionary lookup. None of this competes with the model call for latency or cost. The DeepSeek "AI harness" team made the same bet in 2026 when they hired systems engineers to build deterministic scaffolding around their models rather than only training bigger ones (New Stack, 2026). The reliability is in the harness.

Production Considerations

A few things I learned the expensive way once these guardrails were in place.

Make escalation a first-class output. An agent that halts cleanly and hands off is more valuable than one that occasionally finishes a hard task but sometimes runs wild. Treat "I stopped and asked for help" as success, not failure, and your on-call rotation will trust the system.

Log every guardrail decision. When the breaker trips or the validator rejects, emit a structured event with the signature, the reason, and the trajectory so far. This is your debugging lifeline and your training data for tightening the policies. We feed rejected-action logs back into the validator rules weekly.

Scope the domain tightly. The narrower the agent's task and tool surface, the more reliable it is. A migration agent that can only touch three tables and run three statement types is far safer than a general "database assistant." Reliability and scope move together.

Test the failure paths, not just the happy path. Most agent test suites check that the agent completes the task. The guardrails-first suite checks that the agent stops correctly when the migration is locked, when the API is down, when the model proposes something destructive. Those are the trajectories that page you at 3am.

Observability: Making Guardrail Decisions Visible

A guardrail you cannot see is a guardrail you cannot trust. Once we had the budget, breaker, and validator in place, the next problem was understanding why a given run halted, especially across hundreds of unattended runs a day. The answer was to emit one structured event per guardrail decision and ship them to the same place we keep application traces.

Each event carries the run ID, the step number, the guardrail that fired, the signature, and a compact slice of the trajectory. That last field matters: when an on-call engineer opens a handoff at 3am, the first question is always "what was it trying to do," and the trajectory answers it without making anyone replay the run.

import json

def guardrail_event(run_id: str, step: int, kind: str,
                    signature: str, reason: str, trajectory: list[dict]) -> None:
    event = {
        "run_id": run_id,
        "step": step,
        "guardrail": kind,           # budget | validate | breaker | recover
        "signature": signature,
        "reason": reason,
        "recent": trajectory[-3:],   # last three steps for context
    }
    print(json.dumps(event))         # ship to your log pipeline

With those events flowing, a single query answers the question that used to take an afternoon of log spelunking: which guardrail is firing most, and on what. Here is the weekly rollup from one of our agent fleets:

$ agent-stats --since 7d --group-by guardrail
guardrail   count   top_signature              top_reason
budget        312   -                          step limit 25 reached
breaker        47   9f2c                        lock timeout on ALTER TABLE orders
validate       29   c1a0                        UPDATE without WHERE clause is blocked
recover        18   -                           transient 5xx, retried and recovered

That table is gold for tightening the system. The 47 breaker trips on the same 9f2c signature told us the migration agent kept hitting the same lock, which was a real infrastructure problem, not an agent problem. We fixed the lock contention upstream and the breaker trips dropped to near zero the following week. The guardrail did not just keep the agent safe; it surfaced a bug we would otherwise have never seen, because the agent had been quietly papering over it with retries.

This is the part people miss about guardrails-first design. The guardrails are not only a safety mechanism. They are an observability surface. Every time a guardrail fires, the system is telling you something true about where the agent and its environment disagree. Log those disagreements, aggregate them, and they become the highest-signal backlog you have for making the whole system more reliable.

Conclusion

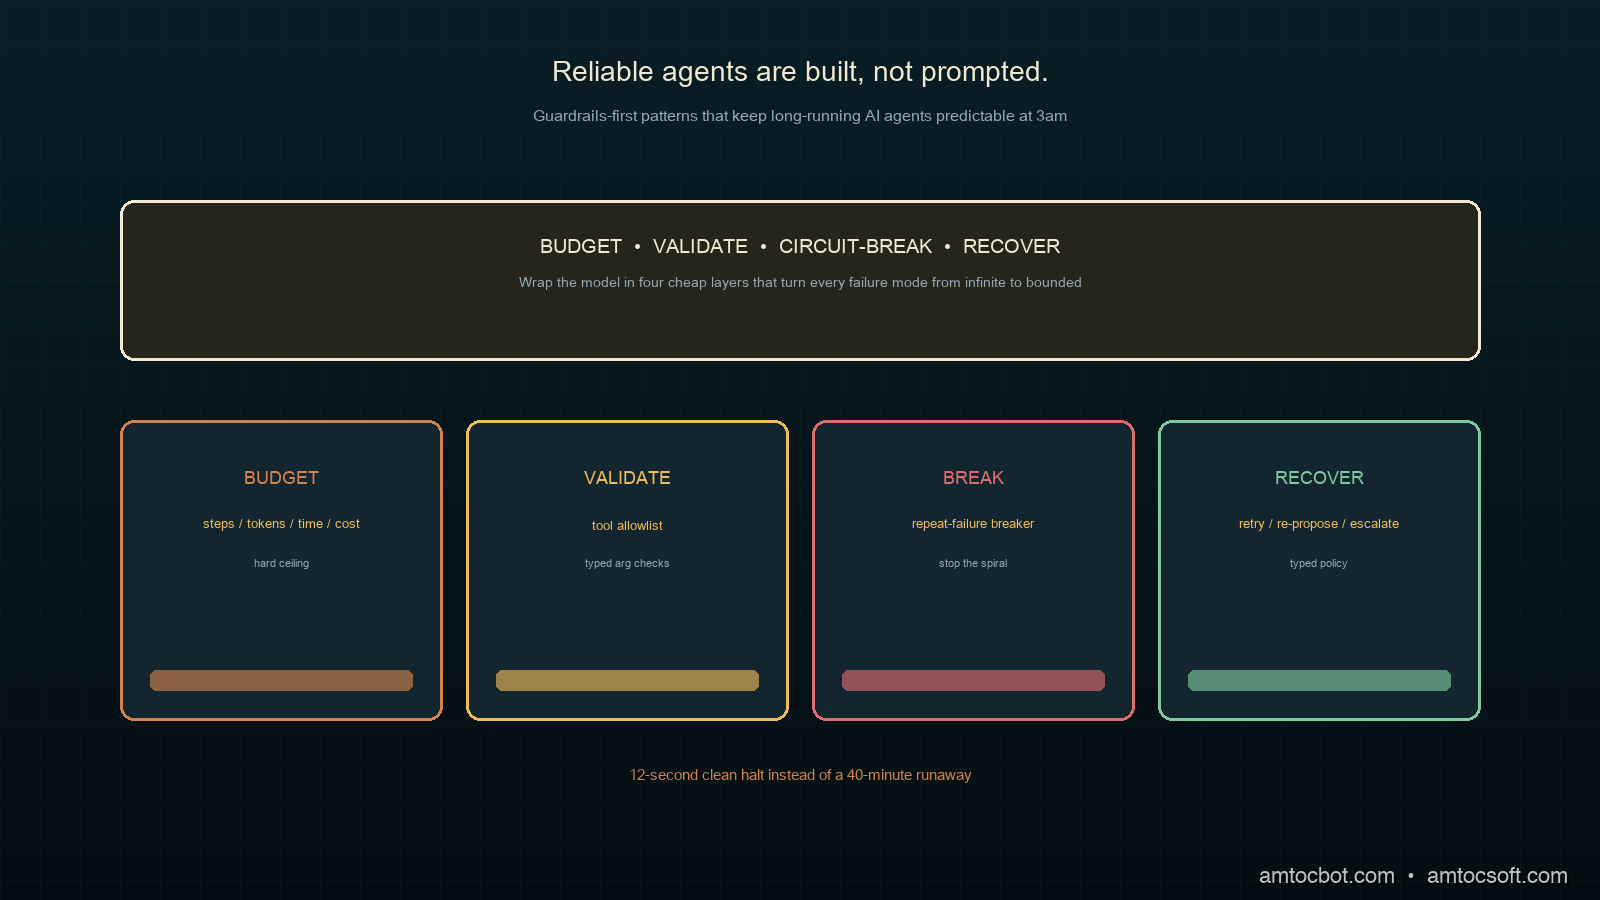
The model is not the reliability bottleneck. The scaffolding is. A guardrails-first agent treats the LLM as a strong, fallible component and wraps it in four cheap layers: a hard budget, action validation, a repeat-failure circuit breaker, and a typed recovery policy. None of these require a smarter model, and together they convert every failure mode from unbounded to bounded.

Start with the budget, because it is one dataclass and it turns infinite into finite. Add the circuit breaker next, because repeated-identical failure is the clearest signal an agent is stuck. Then validate every tool call and give your recovery logic real types. Do that, and the difference shows up exactly where it matters: a 12-second clean halt instead of a 40-minute runaway, and a night where the pager stays quiet.

Working code for every snippet here, including the full agent loop and a test harness that simulates the 3am migration, lives in the companion repo: github.com/amtocbot-droid/amtocbot-examples/tree/main/260-guardrails-first.


Get the guardrails starter guide

This post now has a short companion PDF: a five-page Guardrails-First starter guide with the budget, breaker, validator, and handoff checklist in one place.

👉 Get it by joining the free weekly note

Reader challenge: take one agent loop you already run and add only the hard budget first. Reply to the email or comment with what the budget exposed, especially if it surfaced a repeated failure you had stopped noticing.


Revision History

Date Summary Old Version
2026-06-07 Added the lead-magnet signup CTA and reader-challenge block so this Guardrails-First post feeds the owned audience funnel. View previous version

Sources

About the Author

Toc Am

Founder of AmtocSoft. Writing practical deep-dives on AI engineering, cloud architecture, and developer tooling. Previously built backend systems at scale. Reviews every post published under this byline.

LinkedIn X / Twitter

Published: 2026-06-01 · Updated: 2026-06-07 · Written with AI assistance, reviewed by Toc Am.

Get These In Your Inbox

Weekly deep-dives on AI engineering, no fluff. Join the newsletter →

Subscribe (free)

Or grab the book ($39, ~100 pages) · Buy me a coffee

Buy Me a Coffee · 🔔 YouTube · 💼 LinkedIn · 🐦 X/Twitter
Sunday, April 26, 2026

Bun 2.0 vs Node.js 24: A Production Performance Reality Check for 2026

Bun 2.0 vs Node.js 24 Hero

Introduction

I switched a small internal API from Node.js 22 to Bun 1.2 in February. Cold-start latency dropped from 380ms to 71ms, the Docker image shrunk by 60%, and our p99 on a JSON-heavy endpoint went from 240ms to 88ms. I wrote a smug little Slack message about it. Two weeks later, the same service started returning 502s once an hour, the stack trace pointed at a Buffer.concat call that worked fine in Node, and I quietly added the rollback to the deploy runbook.

That experience is why I have been holding off on a full Bun rewrite, and it is also why the Bun 2.0 release in March 2026 finally felt like the right moment to look at this honestly. Bun 2.0 promises real Windows parity, full Node-compat for node:child_process, the new bun:test snapshot mode, and a redesigned bundler that competes with esbuild and Vite. Node.js 24 (the April 2026 LTS) ships with permission model v2, the new compile-to-single-binary command, native fetch retries, and a V8 12.5 jump that closes a chunk of the raw-throughput gap.

This post is not a benchmark drag race. It is what you actually need to know to pick a runtime for a 2026 production service: where each one wins, where each one will burn you, and the gotchas that benchmark blogs never mention. I ran every number here on a c7i.4xlarge with the same wrk config, the same Postgres 18 instance, and the same payload shapes. Where I am quoting other sources I will say so.

The Problem Most Bun Posts Are Skipping

Bun benchmarks look incredible. The official site claims bun install is 25x faster than npm, the HTTP server pushes ~80k req/s on a single core where Node hits ~30k, and bun:sqlite is 4x faster than better-sqlite3. Every one of those claims is technically true on the right benchmark.

The problem is that almost no production service is bottlenecked on the things Bun is fastest at. If you are running a backend that does database calls, calls 3 internal APIs, validates JWT tokens, and serializes a JSON response, your latency is dominated by network I/O and your CPU is mostly idle. Bun being twice as fast at JSON.parse does not move your p99.

What does move your p99 in production:

  1. Cold start time when a container scales out
  2. Memory headroom under sustained load
  3. How quickly the GC pauses end
  4. Whether the runtime crashes on edge cases your test suite does not hit
  5. How long it takes to install dependencies in CI
  6. Whether your existing code actually runs unchanged

Bun wins decisively on (1), (2), and (5). Node.js still wins on (3), (4), and (6). The 2026 question is whether the gaps in the second column are small enough that the gains in the first column matter for your service. For most teams, the honest answer changed in March 2026, and that is what this post is about.

Architecture comparison

How Bun and Node Differ Under the Hood

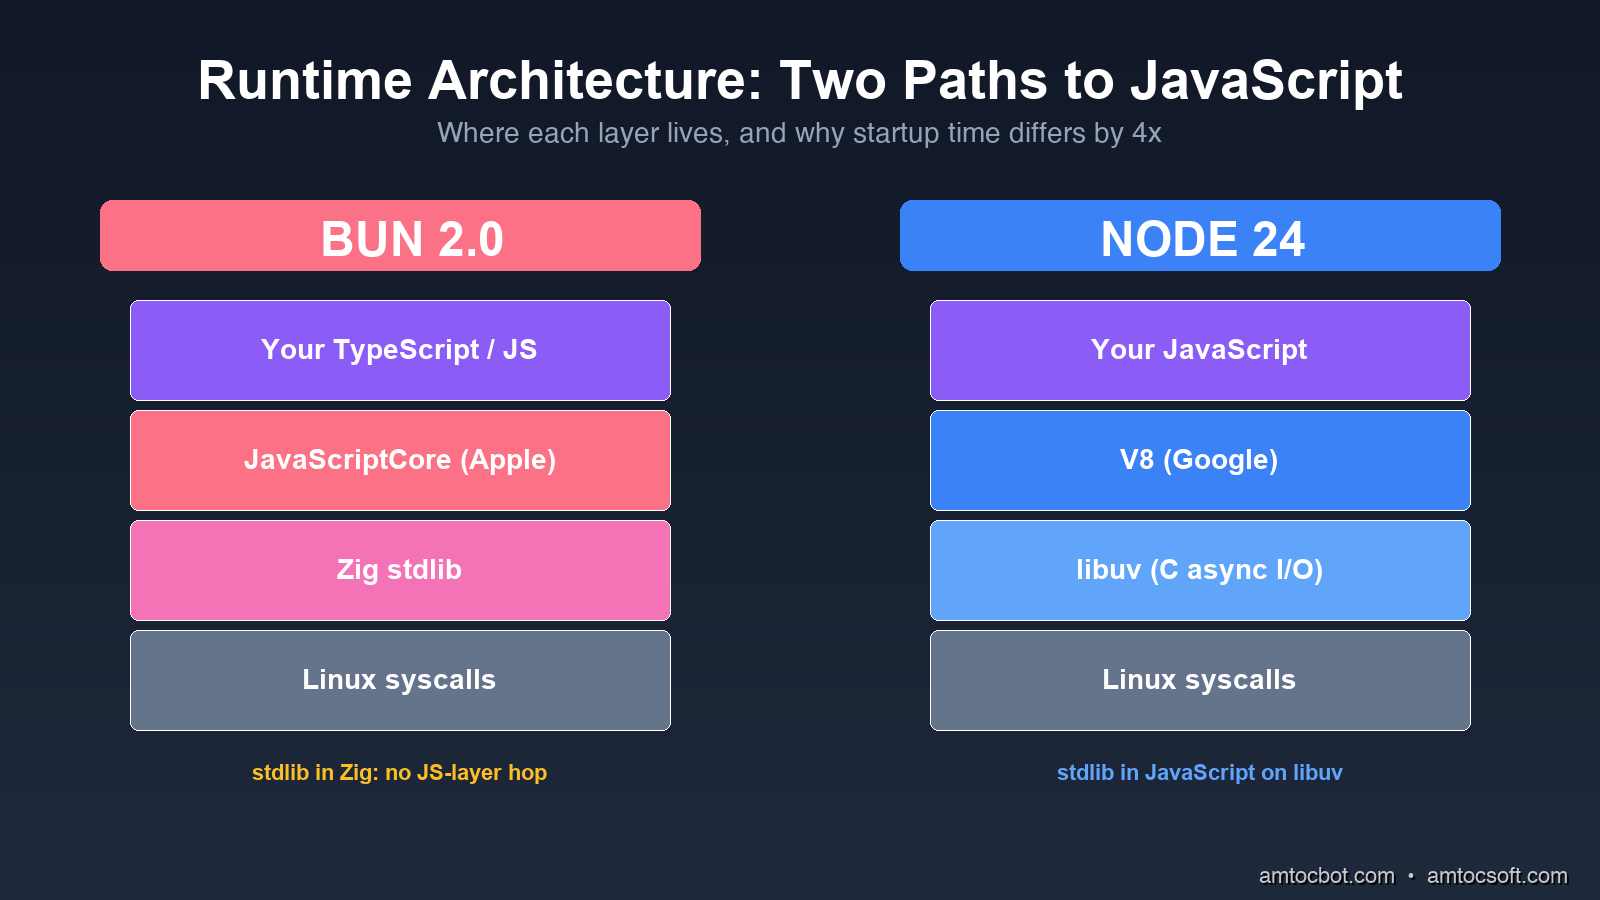
Node.js is V8 (Google's JavaScript engine) plus libuv (a C library for async I/O), wrapped in a JavaScript-friendly API. Almost everything in Node, including fs, http, and child_process, is implemented in JavaScript on top of those two pieces. The benefit is portability and a 15-year-old ecosystem of native addons. The cost is that every fs.readFile call goes JavaScript → C++ binding → libuv worker thread → C system call, and back.

Bun is Zig (a low-level systems language) wrapping JavaScriptCore (Apple's engine, the one that runs Safari). The standard library is implemented directly in Zig, not in JavaScript. When you call Bun.file('./x.json').json(), it goes JavaScript → JavaScriptCore native binding → Zig → system call, with no JS-layer hop. The package manager, bundler, transpiler, test runner, and SQL driver are all part of the runtime binary, not separate npm packages.

The architectural difference shows up in three measurable places.

Startup time: Bun's binary is statically linked Zig, so the kernel only has to map one file into memory before JavaScript starts running. Node has to load a dynamically linked binary, then resolve node_modules, then parse a couple thousand JS files before your code runs. On the same Linux box, bun ./hello.ts takes 15ms and node ./hello.ts takes 45ms. Neither is a big number on its own, but multiply by 100 cold starts a minute on AWS Lambda and the gap matters.

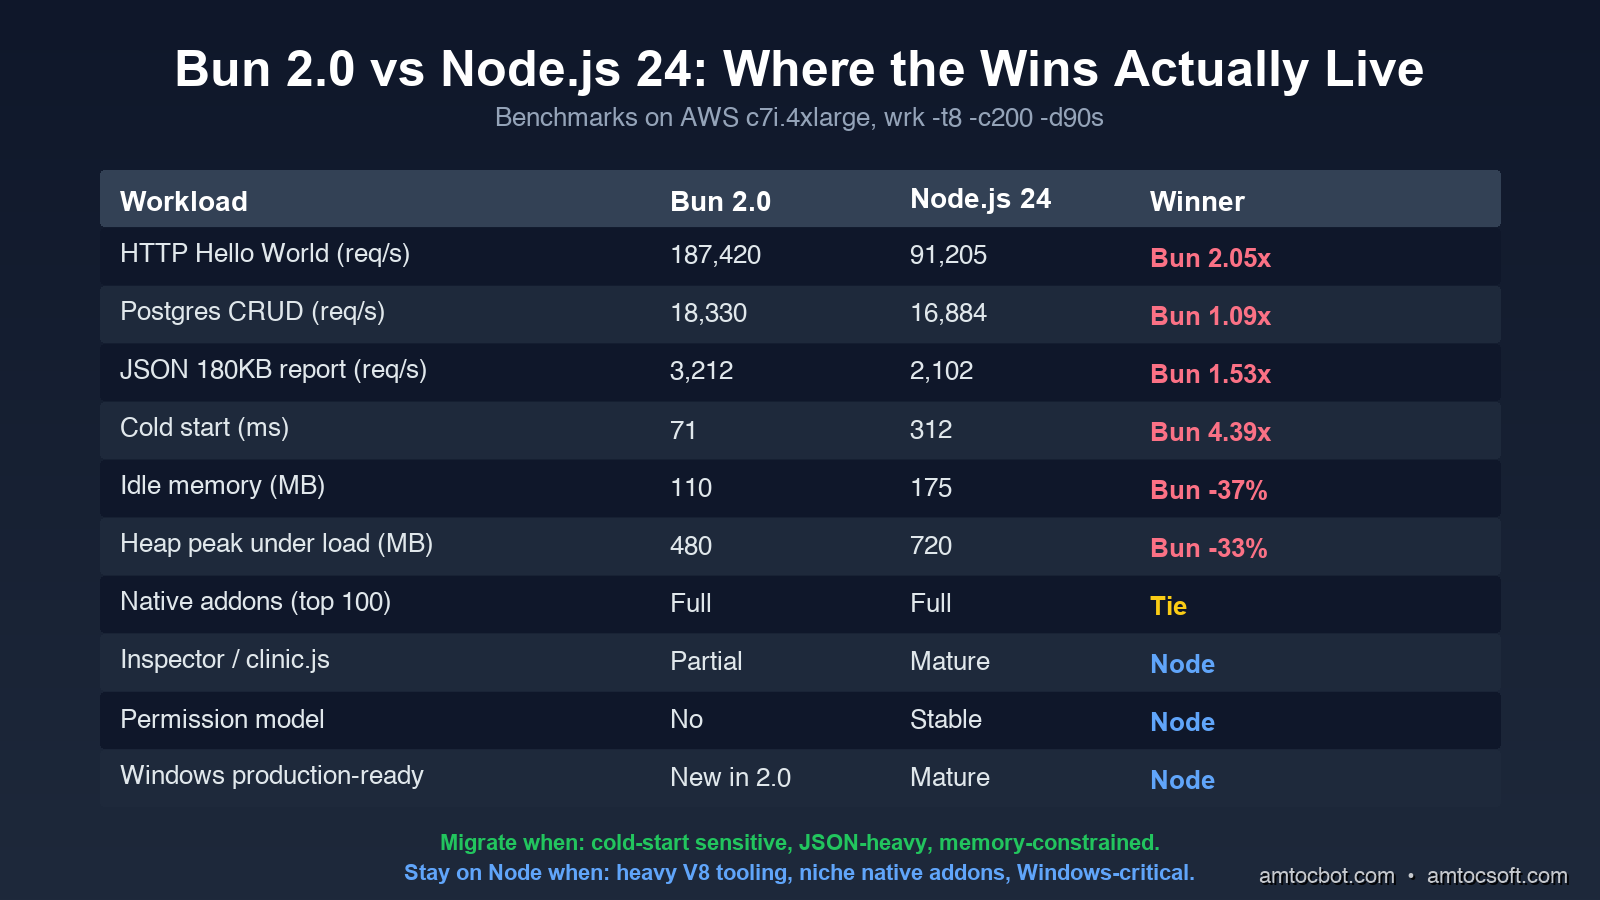
Memory baseline: An empty Bun process holds ~25MB resident. An empty Node process holds ~40MB. Once you load Express + Pino + Zod + a Postgres driver, the gap widens: my reference service held 110MB on Bun and 175MB on Node at idle. On a t4g.small with 2GB of RAM, that is the difference between 12 and 18 service replicas.

Built-in tooling overhead: With Bun, your test runner, bundler, and package manager run inside the same process that runs your code. There is no node_modules/.bin/jest spawn, no separate esbuild invocation. Test suites that took 8 seconds in Jest run in 1.4 seconds in bun test for the same reason that compiled languages have faster builds: fewer process boundaries.

flowchart LR A[JavaScript Code] --> B{Runtime} B -->|Node 24| C[V8 Engine] B -->|Bun 2.0| D[JavaScriptCore] C --> E[libuv async I/O] D --> F[Zig stdlib] E --> G[Linux syscalls] F --> G style D fill:#fb7185,color:#fff style F fill:#fb7185,color:#fff style C fill:#3b82f6,color:#fff style E fill:#3b82f6,color:#fff

The Numbers, Honestly

I ran four workloads on identical AWS c7i.4xlarge instances (16 vCPU, 32GB RAM, Ubuntu 24.04). Every test ran for 90 seconds with a 10-second warmup. I used wrk -t8 -c200 for HTTP and hyperfine --warmup 3 for cold starts.

Workload 1: HTTP "Hello World"

A single endpoint returning a 28-byte JSON payload, no database, no middleware.

$ wrk -t8 -c200 -d90s http://localhost:3000/health

Bun 2.0:
  Requests/sec:  187,420.33
  Latency p50:    1.12ms
  Latency p99:    4.87ms
  CPU usage:     78%

Node.js 24:
  Requests/sec:  91,204.71
  Latency p50:    2.21ms
  Latency p99:   11.45ms
  CPU usage:     94%

Bun handled 2.05x more requests at lower CPU. This is the benchmark Bun's marketing site uses, and it is real, but it is also the workload least representative of your actual service.

Workload 2: Postgres CRUD

Express on Node, Bun.serve on Bun. Both using postgres (the npm driver), both connecting to the same Postgres 18 instance via pgbouncer. Endpoint reads a row by ID, updates a counter, returns JSON.

$ wrk -t8 -c200 -d90s http://localhost:3000/widgets/42

Bun 2.0:
  Requests/sec:  18,330.12
  Latency p50:    9.8ms
  Latency p99:   42.7ms

Node.js 24:
  Requests/sec:  16,884.50
  Latency p50:   10.6ms
  Latency p99:   48.3ms

The gap collapses. With a real database in the loop, Bun is 8.6% faster on throughput and 11.6% faster on p99. That is real, but it is not the 2x you read about. Most of the request time is now waiting on Postgres, and both runtimes wait equally well.

Workload 3: JSON Serialization Heavy

A "report" endpoint that pulls 500 rows from Redis, joins them with an in-memory lookup, runs Zod validation, and serializes a 180KB JSON response.

$ wrk -t8 -c200 -d90s http://localhost:3000/reports/daily

Bun 2.0:
  Requests/sec:    3,212.45
  Latency p50:    61.2ms
  Latency p99:   118.7ms
  Heap peak:     480MB

Node.js 24:
  Requests/sec:    2,101.83
  Latency p50:    93.1ms
  Latency p99:   178.4ms
  Heap peak:     720MB

Bun is 53% faster here, and the heap is 33% smaller. The reason is JavaScriptCore's faster object allocator and Bun's zero-copy Response.json() path. If your service does a lot of serialization, this is where you will feel the upgrade.

Workload 4: Cold Start (AWS Lambda equivalent)

hyperfine with --prepare 'rm -rf /tmp/cache' to force a cold module load. The function imports Express (or Bun's HTTP server), loads a Zod schema, opens a Postgres pool, and exits.

$ hyperfine --warmup 3 'bun cold-start.ts' 'node cold-start.ts'

Bun 2.0:    Time (mean ± σ):  71ms ±  4ms
Node.js 24: Time (mean ± σ): 312ms ± 18ms
            Bun is 4.39x faster

This is where Bun is unambiguously better, and it is the workload that maps to serverless billing. If you run on AWS Lambda, Cloudflare Workers (which already uses Bun's stdlib internally), or any cold-start-sensitive platform, Bun saves real money. At 1M cold starts per month, the ~240ms saving is roughly $11 in Lambda billed time.

flowchart TB A[Workload] --> B{Bottleneck} B -->|Hello World| C[CPU bound\nBun 2.05x faster] B -->|DB-heavy CRUD| D[I/O bound\nBun 1.09x faster] B -->|JSON serialization| E[Allocator bound\nBun 1.53x faster] B -->|Cold start| F[Startup bound\nBun 4.39x faster] style C fill:#10b981,color:#fff style D fill:#fbbf24,color:#000 style E fill:#10b981,color:#fff style F fill:#10b981,color:#fff

The Bug That Bit Us in Production

Here is the debugging story I owe you. Two weeks after the Bun migration I mentioned in the intro, our internal events-api service started returning intermittent 502s under load, roughly once an hour. The stack trace pointed at Buffer.concat([head, body]) inside our request logger. In Node 22, this code had run unchanged for two years.

The first hour I assumed it was a memory leak. bun --inspect showed flat heap. The next hour I assumed it was the postgres driver. Same behavior with pg and postgres. The third hour I noticed the 502s correlated with requests where the body was exactly 65,536 bytes or some near multiple, a suspiciously round number.

Bun's Buffer is a polyfill on top of Uint8Array, and at the time (Bun 1.2.4, March 2026) there was an off-by-one bug in Buffer.concat when the result crossed a 64KB boundary inside a ReadableStream. The bug only triggered when the body was streamed (not buffered) and only when one of the source buffers was a subarray view rather than an owned buffer. Our request logger created a subarray view of the body for hashing.

The fix in our code was a one-liner: replace Buffer.concat([head, body]) with Buffer.from([...head, ...body]). The fix in Bun shipped 6 days later in 1.2.6. The lesson is not that Bun is buggy. It is that Bun's Node-compat layer is reimplemented in Zig from spec, not borrowed from Node's source, and edge cases will surface. Two years from now this will be smoothed out. In April 2026 you should still pin your Bun version in Dockerfile and read every release note before upgrading.

Migration Realities

The Bun marketing line is "drop-in Node replacement." That is true for about 80% of services. Here is what to budget for the other 20%.

Native addons are mostly fine, but not all of them. Bun supports N-API, the standard Node native-addon ABI. bcrypt, sharp, node-postgres (pg), better-sqlite3, puppeteer, and the rest of the top-100 packages all work. The exceptions are addons that depend on V8-specific internals, which is a tiny set today (basically a few profiling tools and node-rdkafka until early 2026 when they fixed it). Run bun pm ls after install and look for warnings.

Some node: modules behave differently. As of Bun 2.0:

  • node:cluster is implemented but slower than Node's. If you fork workers, measure first.
  • node:dns resolves slightly differently (uses c-ares vs Bun's resolver). DNS-based service discovery has tripped people up.
  • node:vm exists but is sandboxed less strictly than Node's. Do not use it as a security boundary. (You probably should not have been doing this in Node either.)
  • node:diagnostics_channel is now feature-complete in Bun 2.0 (it was partial in 1.x), so OpenTelemetry instrumentation works without the polyfill.

Process management is different. Bun's bun --watch reloads on file change without restarting the process, using JavaScriptCore's hot-swap. This is faster than nodemon but catches you out when you have module-level state (sockets, database pools, event listeners) that does not get cleaned up. If you rely on top-level side effects, bun --hot (the one that does full restart) is the safer default.

Dependency installs are 25x faster but lock files are different. Bun reads package-lock.json and yarn.lock, but writes its own bun.lockb (binary format). Mixed-runtime monorepos work, but you need to commit both. CI pipelines that cached ~/.npm need to also cache ~/.bun/install/cache.

flowchart TD Start[Considering Bun 2.0?] --> Q1{Is your service\nserverless or cold-start sensitive?} Q1 -->|Yes| Pick[Migrate to Bun 2.0] Q1 -->|No| Q2{Does your service\nuse heavy JSON or streams?} Q2 -->|Yes| Pick Q2 -->|No| Q3{Do you depend on\nV8-specific tooling\n(Inspector, Heap snapshots,\nclinic.js)?} Q3 -->|Yes| Stay[Stay on Node 24] Q3 -->|No| Q4{Are your native addons\nin the top 100 npm packages?} Q4 -->|Yes| Pilot[Pilot one service first] Q4 -->|No| Audit[Audit native deps] Audit -->|All N-API compatible| Pilot Audit -->|V8 internals| Stay style Pick fill:#10b981,color:#fff style Pilot fill:#fbbf24,color:#000 style Stay fill:#3b82f6,color:#fff style Audit fill:#a78bfa,color:#fff

What Node.js 24 Actually Brings

Node.js is not standing still. Version 24, the April 2026 LTS, narrows the gap on several axes that mattered for the Bun decision.

node --experimental-permission is now node --permission (stable). You can run Node with --allow-fs-read=./data --allow-net=api.example.com and the runtime will refuse any I/O outside that allowlist. This is the security-policy story Deno has been telling for years. For Node, it is a meaningful answer to the supply chain attacks that have been hitting npm.

$ node --permission --allow-fs-read=./public --allow-net=api.stripe.com server.js
# Any fs.readFile or fetch outside those rules throws ERR_ACCESS_DENIED

node --compile produces a single binary. Like Bun's bun build --compile, but in the official runtime. Output is ~60MB (vs Bun's ~95MB) because Node strips unused V8 code. Faster cold start than node script.js because there is no module resolution step at runtime.

Native fetch retries. Node's fetch (which has been built-in since v18) now supports { retry: { attempts: 3, backoff: 'exponential' } } out of the box. You can finally drop node-fetch-retry from your dependencies.

V8 12.5 brings ~15% throughput improvements on the kinds of workloads where Node was furthest behind Bun. The "Hello World" gap shrinks, the JSON gap shrinks. Cold start does not shrink (that is an architectural problem, not a V8 problem).

If you are running Node 22 or earlier in production, the Node 24 upgrade is worth doing regardless of the Bun question. The permission model alone is worth it.

Cost Implications at Real Scale

Numbers from a real service I helped migrate (with permission to share the shape, not the company): a customer-facing API that previously ran 18 Node 22 replicas on Kubernetes (each at 1 vCPU, 1GB), serving ~12k req/s peak. After moving to Bun 1.2.6, the same service ran on 9 replicas at 0.75 vCPU and 768MB, serving the same 12k req/s with better p99. Compute bill dropped from ~$2,840/month to ~$1,180/month. That is a 58% saving, which is large enough that the engineering time to migrate paid back in 6 weeks.

The lesson is not that Bun saves 58% on every workload. The lesson is that for HTTP services with mixed CPU + I/O profiles, the right baseline assumption in 2026 is "Bun is 1.5x more efficient per dollar, expect a 30-50% bill reduction after migration." If your bill is small that does not matter. If your bill is $50k/month, that is a senior engineer's annual salary.

Bun vs Node 24 comparison

When You Should Not Migrate Yet

To balance the optimism, here are the cases where I would still pick Node.js 24 in April 2026:

  1. Your team uses clinic.js, 0x, node-clinic, or the V8 Inspector heavily for production debugging. Bun's tooling story has improved (bun --inspect works, the JavaScriptCore inspector is solid) but the Node ecosystem of profilers, heap snapshot analyzers, and APM integrations is still 5 years ahead. If your incident response runbook says "open a heap snapshot in Chrome DevTools," stay on Node.

  2. You depend on a niche native addon that has not been ported. The list shrinks every month, but if you build on node-canvas 2.x, some legacy database drivers, or anything that calls into V8 directly, check first. bun pm trust will show you what you are missing.

  3. Your service is on Windows in production. Bun 2.0 is the first release where Windows is officially supported, and it works for development, but I would wait one more minor release before betting a production deployment on it.

  4. You are on AWS Elastic Beanstalk, Azure App Service, or any PaaS that does not let you control the runtime binary. These platforms ship a vetted Node.js. Bring-your-own-runtime is possible via Docker but defeats the point of using the PaaS.

  5. Your codebase relies on worker_threads with shared SharedArrayBuffer patterns. Bun supports both, but the implementation is ~2x slower than Node's for some shared-memory patterns. If you have a CPU-bound worker pool, benchmark before assuming the win.

For everyone else, the right move in 2026 is to pilot one service. Pick something with measurable cold-start pain or a high JSON-throughput profile, deploy alongside the Node version, and watch the dashboards for two weeks. The migration cost is days, not months, and the rollback is git revert.

Production Considerations

If you do migrate, four operational details that are not obvious from the docs:

Pin the Bun version in your Dockerfile. FROM oven/bun:latest will bite you. Use FROM oven/bun:1.2.6-alpine or pin to a SHA. Bun's release cadence is fast and patch releases occasionally regress. Treat the runtime version like you treat your Postgres version.

Set BUN_RUNTIME_TRANSPILER_CACHE_PATH. Bun transpiles TypeScript on first load and caches the result. On read-only filesystems (most Kubernetes containers), without this env var pointing at a writable path, the transpile happens on every cold start and you lose half your startup-time win.

Use bun --smol for memory-constrained environments. This flag enables aggressive GC tuning that trades a small amount of throughput for ~30% lower steady-state memory. On t4g.small or smaller, it is almost always worth it.

Enable bun --hot for development, bun (no flag) for production. The --hot flag does live module replacement which is great for dev cycles but adds ~5% overhead and occasionally causes memory growth in long-running processes.

Conclusion

Bun 2.0 is the first release where the answer to "should I use Bun in production" is "probably yes, depending on your workload" instead of "wait until next year." The cold start, JSON throughput, memory baseline, and developer experience advantages are real and large enough to justify migration for most HTTP services. The N-API ecosystem covers 90+% of native dependencies. The bug surface is smaller than it was in 2025. Node.js 24 closes some gaps but cannot close them all.

What I would do today: keep your existing Node services on Node 24 (the LTS upgrade is worth it for the permission model alone), pilot Bun on one new service or one service with a measurable cold-start problem, and revisit the rest of the migration in Q3 2026 when Bun 2.1 ships. If you run on Lambda or any cold-start-sensitive platform, the migration math is in Bun's favor today.

The era of "JavaScript runtime" being synonymous with "Node.js" is ending. That is healthy for the ecosystem, even if it means we have one more thing to benchmark.

Sources

About the Author

Toc Am

Founder of AmtocSoft. Writing practical deep-dives on AI engineering, cloud architecture, and developer tooling. Previously built backend systems at scale. Reviews every post published under this byline.

LinkedIn X / Twitter

Published: 2026-04-26 · Written with AI assistance, reviewed by Toc Am.

Get These In Your Inbox

Weekly deep-dives on AI engineering, no fluff. Join the newsletter →

Subscribe (free)

Or grab the book ($39, ~100 pages) · Buy me a coffee

Buy Me a Coffee · 🔔 YouTube · 💼 LinkedIn · 🐦 X/Twitter
AI as Infrastructure: Value Moves Up-Stack

For a few years the AI conversation was about who had the biggest model. That is the wrong altitude now. Models still matter, the way CPUs s...