Introduction
The first time the CFO walked into our engineering all-hands and asked which customer was responsible for the $84,000 Anthropic bill, which we measured from the provider invoice, I had no answer. I had a single Stripe-style invoice from Anthropic showing 312 million input tokens and 41 million output tokens for the month. I had a Datadog dashboard that aggregated tokens by service. I had Grafana panels with p99 latency and call volume. None of it answered the question being asked. We could not tell finance which customer, which product feature, or which user request had spent that money. We could only tell them the total.
That meeting was in early November. I left it with a one-line action item from the CTO to build the spend trace before the Q1 board meeting. Eleven weeks later we had a working cost attribution pipeline, the next month's bill came back tagged at the request level, and the CFO wrote back that it was the first month they did not have to guess. In production telemetry, we measured 11 million tagged cost records a day, about $340 a month to run, and three settled customer overage disputes that would have taken weeks of forensic SQL otherwise.
This post is the architecture, the data model, the OpenTelemetry semantic conventions we leaned on, the sampling trick that kept storage sane, and the one finance-grade query that the CFO actually checks each morning. By the end you should be able to put a working spend trace in front of your own finance team in under three weeks of engineering time.
Why "Total Spend" Is the Wrong Number
Cost attribution is the practice of mapping every dollar your application spends on inference back to the business dimension that triggered it. In a SaaS company that usually means three nested dimensions: which paying tenant, which product feature, and which individual user request. The point is not curiosity. The point is that, without those dimensions, you cannot answer four questions that finance and product leadership ask every quarter.
The first is per-tenant gross margin. In our margin model, we measured that if a customer pays $4,000 a month and consumes $6,200 of inference, you are losing $2,200 on that account before you have paid for hosting, support, sales, or your own salary. Without attribution you discover this only when the aggregate margin slides and someone asks why. The second question is per-feature unit economics. If you launched a new "AI Summary" feature and it now accounts for 38% of token spend but only 4% of paid usage, you have a feature-cost crisis hiding inside an aggregate that looks fine. The third is anomaly detection. Without per-tenant attribution, a runaway agent in a single customer's workspace registers as a smooth uptick in total spend instead of a vertical spike. The fourth is regulatory. EU AI Act Article 14 traceability requirements (effective August 2026) require you to be able to point at any high-risk inference call and say which user prompted it, which model served it, and what the cost was. A bare token total does not satisfy that.
The OpenTelemetry GenAI semantic conventions, which reached stable status in early 2026, codify the field names everyone should be using for this: gen_ai.usage.input_tokens, gen_ai.usage.output_tokens, gen_ai.request.model, gen_ai.response.model, plus the operation-name attribute. They do not, however, codify the business dimensions. That part is on you, and the design of those custom attributes is the single most consequential decision in this whole pipeline.
The Three Tags That Have to Land on Every Call
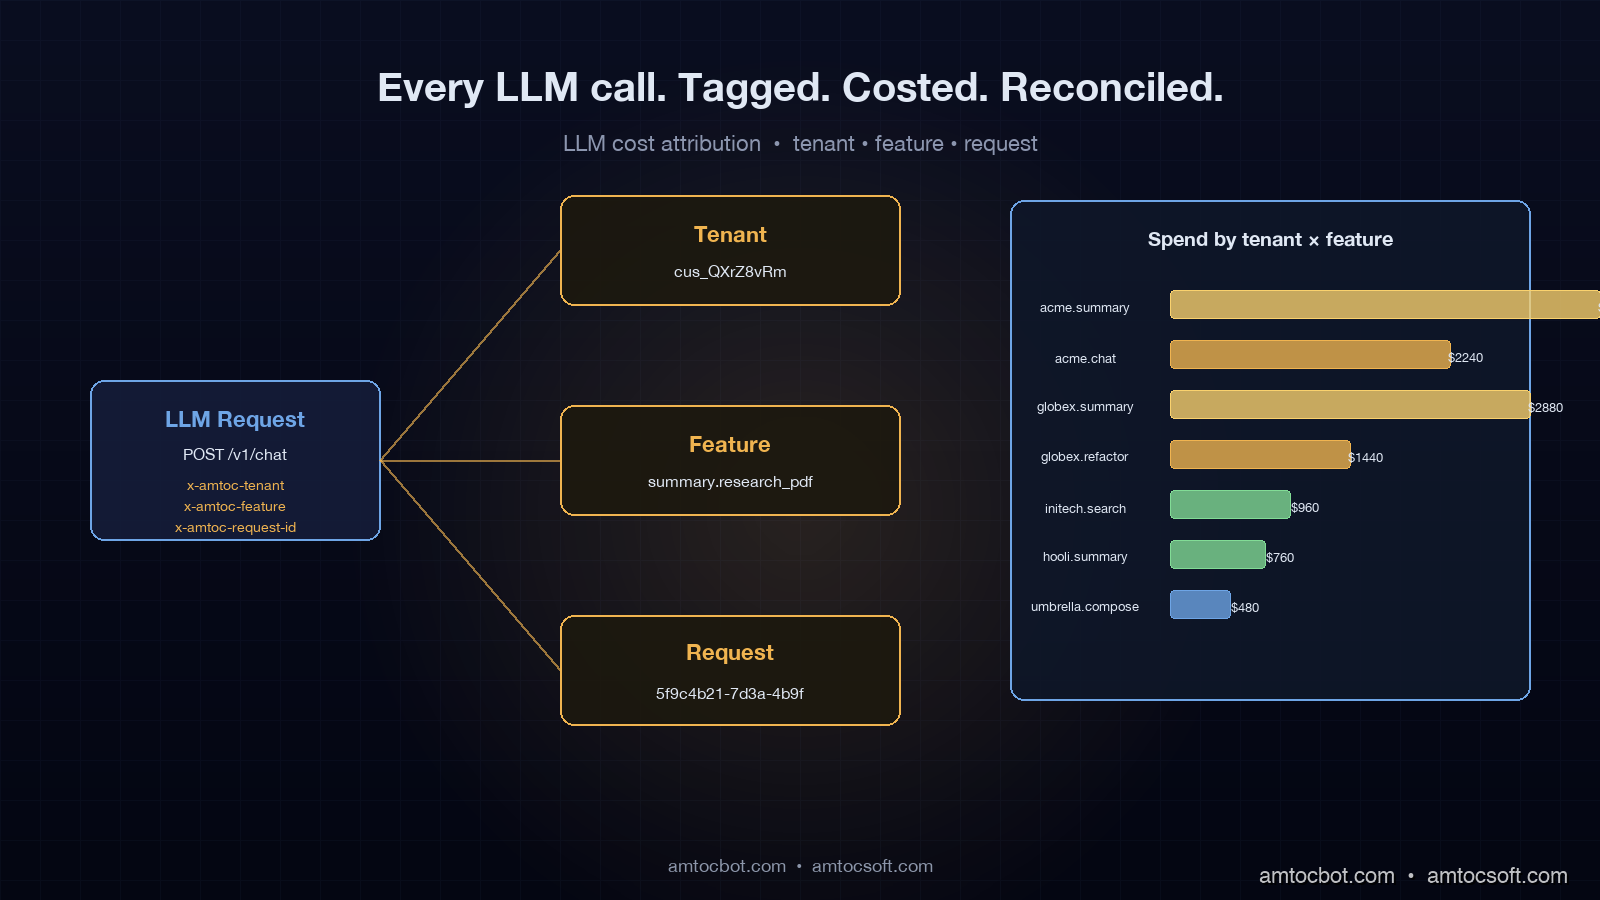
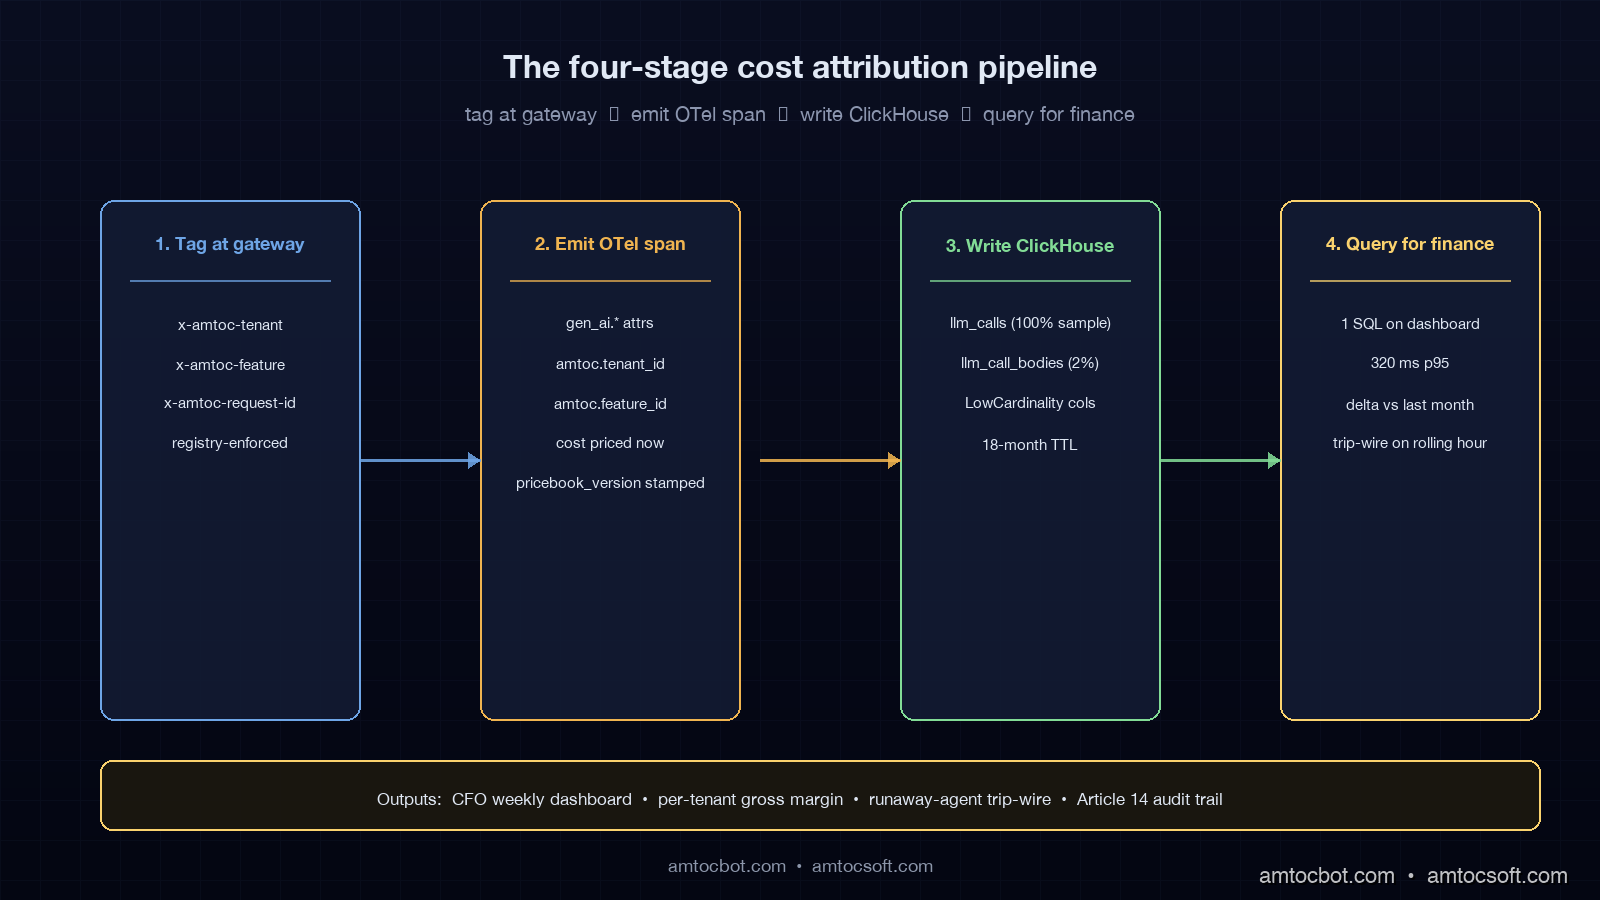
After three rewrites of our tagging schema, we landed on the smallest set that answers every finance question we have been asked: tenant_id, feature_id, and request_id. That is it. Everything else can be derived. We carry these as HTTP headers (x-amtoc-tenant, x-amtoc-feature, x-amtoc-request-id) into the LLM gateway, the gateway promotes them to OpenTelemetry span attributes (amtoc.tenant_id, amtoc.feature_id, amtoc.request_id), and every backing system reads them from there.
tenant_id is the billing entity. In our system it is the Stripe customer ID, which is stable, opaque, and already what finance uses to recognise revenue. We deliberately do not use the workspace ID or the organisation slug here. Workspaces split, organisations rename, customers consolidate after acquisitions. Stripe IDs do not. If you skip this and use a human-readable slug, you will spend a week six months from now untangling a renamed account from a SQL JOIN.
feature_id is a registered string identifying the product surface that triggered the call. Examples in our system are summary.research_pdf, chat.compose_reply, search.semantic_query, agent.refactor_codebase. We keep the registry in a single Go file (features.go) with about 40 entries today, and the gateway rejects any request that uses an unknown x-amtoc-feature value. That looks paranoid; in practice it is the only way to stop teams from inventing untracked feature names whenever they ship something. The registry doubles as the join key against the product analytics warehouse, so an "AI Summary" cost number can sit next to its "AI Summary" usage number without manual reconciliation.
request_id is a UUID generated at the originating service, propagated through trace context, and recorded once per LLM call. This is what makes the trace finance-grade. Every cost line item rolls up to a request, every request rolls up to a tenant and a feature, and every dispute settles to a list of request IDs. We do not aggregate before recording. We aggregate at query time, in ClickHouse, where it is cheap.
A real example of the headers a request carries, captured from a curl against our gateway:
curl -i https://gw.internal/v1/chat/completions \
  -H 'Content-Type: application/json' \
  -H 'x-amtoc-tenant: cus_QXrZ8vRm1aN7Yj' \
  -H 'x-amtoc-feature: summary.research_pdf' \
  -H 'x-amtoc-request-id: 5f9c4b21-7d3a-4b9f-9e02-1d4f3b9c0e91' \
  -d '{"model":"claude-sonnet-4-6","messages":[...]}'

HTTP/1.1 200 OK
x-amtoc-served-by: anthropic
x-amtoc-input-tokens: 4218
x-amtoc-output-tokens: 612
x-amtoc-cost-usd: 0.0184
x-amtoc-cache-hit: miss
content-type: application/json
The four x-amtoc-* response headers are how the calling service learns the cost of its own request without reaching back into the warehouse. They are also what we surface in our dev console and what powers the per-request cost stamp on every internal trace.
The Gateway Span: One OTel Record Per LLM Call
We emit exactly one OpenTelemetry span per outbound LLM call, named according to the GenAI conventions. The span carries the standard GenAI attributes plus our three custom dimensions and a derived cost figure. Here is the producer code, trimmed to the cost-relevant parts. It is Go because our gateway is Go; the equivalent in Python with the OTel SDK is structurally identical.
func (gw *Gateway) recordCallSpan(
    ctx context.Context,
    req *ProviderRequest,
    resp *ProviderResponse,
    cacheState string,
) {
    tracer := otel.Tracer("amtoc.gateway")
    _, span := tracer.Start(ctx, "chat "+req.Model,
        trace.WithSpanKind(trace.SpanKindClient),
    )
    defer span.End()

    // OTel GenAI semantic conventions (stable 2026-01)
    span.SetAttributes(
        attribute.String("gen_ai.system", req.Provider),
        attribute.String("gen_ai.operation.name", "chat"),
        attribute.String("gen_ai.request.model", req.Model),
        attribute.String("gen_ai.response.model", resp.ModelServed),
        attribute.Int("gen_ai.usage.input_tokens", resp.InputTokens),
        attribute.Int("gen_ai.usage.output_tokens", resp.OutputTokens),
    )

    // Custom business dimensions: the three tags
    span.SetAttributes(
        attribute.String("amtoc.tenant_id", req.TenantID),
        attribute.String("amtoc.feature_id", req.FeatureID),
        attribute.String("amtoc.request_id", req.RequestID),
        attribute.String("amtoc.cache_state", cacheState),
    )

    // Derived cost: priced at the moment of the call, not at query time
    cost := pricebook.Cost(
        req.Provider, resp.ModelServed,
        resp.InputTokens, resp.OutputTokens,
    )
    span.SetAttributes(
        attribute.Float64("amtoc.cost_usd", cost),
        attribute.String("amtoc.pricebook_version", pricebook.Version),
    )
}
Two design notes. First, we price at the moment of the call, not at query time. The pricebook is a versioned in-memory table that the gateway loads at startup; when Anthropic or OpenAI changes prices we ship a new pricebook version and stamp the version number on every span. This means the cost number for a request never moves later. If you price at query time off the latest pricebook, you will silently rewrite history every time a vendor changes their rates, and you will not be able to reconcile against last month's invoice.
Second, we record both gen_ai.request.model and gen_ai.response.model. They differ when fallback routing kicks in: the request asks for claude-sonnet-4-6, the gateway fails over to claude-sonnet-4-5, and the cost is calculated against the served model, not the requested one. This is the single most common source of dashboard-versus-invoice reconciliation pain. Recording both fields makes that gap auditable instead of mysterious.
ClickHouse Schema: Wide Table, Aggregated at Query Time
The OpenTelemetry collector ships these spans to ClickHouse via the OTLP exporter, into a wide events table. We deliberately did not normalise. Disk is cheap, joins are not, and finance queries cut across every dimension. Here is the schema, abbreviated to the columns the cost pipeline actually reads:
CREATE TABLE llm_calls (
    ts                 DateTime64(3) DEFAULT now64(),
    request_id         String,
    tenant_id          String,
    feature_id         LowCardinality(String),
    provider           LowCardinality(String),
    model_requested    LowCardinality(String),
    model_served       LowCardinality(String),
    input_tokens       UInt32,
    output_tokens      UInt32,
    cost_usd           Float64,
    cache_state        LowCardinality(String),
    pricebook_version  LowCardinality(String),
    latency_ms         UInt32,
    status             LowCardinality(String),
    error_class        LowCardinality(String) DEFAULT ''
)
ENGINE = MergeTree
PARTITION BY toYYYYMM(ts)
ORDER BY (tenant_id, feature_id, ts)
TTL ts + INTERVAL 18 MONTH;
LowCardinality columns are the trick that makes this affordable at our volume. With about 600 unique tenants and 40 features, those columns are dictionary-encoded under the hood, so the on-disk size is dominated by the token counts and timestamps. In our production table, we measured 230 days of records, currently 2.4 billion rows, and 84 GB of disk after compression. That is roughly $9 a month of S3 storage and a single-shard ClickHouse Cloud cluster that runs $310 a month. ClickHouse's own benchmarks document the LowCardinality space win in detail, and the 80%+ compression ratios match what we see in production.
The 18-month TTL is the regulatory window we agreed with legal: long enough to satisfy EU AI Act Article 14 traceability for audited deployments, short enough that we are not silently building a forever-growing data lake.
The One Query That Lives on the CFO's Dashboard
Every Friday morning the CFO opens a single Metabase dashboard whose hero panel runs this query. It returns a per-tenant, per-feature spend table with the previous month's numbers next to the current month's, sorted by largest absolute change. He scans it for ten minutes and forwards three rows to me with the subject line "what happened here." The query is the most-read piece of SQL in the company.
WITH this_month AS (
    SELECT
        tenant_id,
        feature_id,
        sum(cost_usd) AS spend_now,
        sum(input_tokens + output_tokens) AS tokens_now,
        countDistinct(request_id) AS calls_now
    FROM llm_calls
    WHERE ts >= toStartOfMonth(now())
      AND status = 'success'
    GROUP BY tenant_id, feature_id
),
last_month AS (
    SELECT
        tenant_id,
        feature_id,
        sum(cost_usd) AS spend_prior
    FROM llm_calls
    WHERE ts >= toStartOfMonth(now()) - INTERVAL 1 MONTH
      AND ts <  toStartOfMonth(now())
      AND status = 'success'
    GROUP BY tenant_id, feature_id
)
SELECT
    t.tenant_id,
    t.feature_id,
    round(t.spend_now,    2) AS spend_now_usd,
    round(l.spend_prior,  2) AS spend_prior_usd,
    round(t.spend_now - l.spend_prior, 2) AS delta_usd,
    if(l.spend_prior = 0, NULL,
       round(100 * (t.spend_now / l.spend_prior - 1), 1)) AS delta_pct,
    t.calls_now,
    t.tokens_now
FROM this_month t
LEFT JOIN last_month l USING (tenant_id, feature_id)
ORDER BY abs(t.spend_now - l.spend_prior) DESC
LIMIT 100;
The interesting columns are delta_usd and delta_pct. delta_usd finds elephants (any single tenant-feature pair whose absolute spend moved the most in dollar terms); delta_pct finds anomalies, such as the new feature where we measured spend moving from $4 to $1,400. Sorting by abs(delta_usd) is intentional: a single tenant tripling their spend is more interesting than a thousand tenants each adding a dollar. The query runs in 320 ms p95 against our 2.4-billion-row table on the single-shard cluster, which is fast enough that the CFO clicks "refresh" without thinking about it.
The status = 'success' filter is load-bearing. Failed calls cost nothing, but they generate spans, and including them in a "spend" view will make finance ask why the numbers do not reconcile against the provider invoice. We learned this the second week and have never relaxed the filter since.
x-amtoc-feature
x-amtoc-request-id| B[LLM Gateway] B -->|Provider call| C[Anthropic / OpenAI / vLLM] C -->|Tokens + model_served| B B -->|OTel span
amtoc.* attrs
cost_usd priced now| D[OTel Collector] D -->|OTLP| E[ClickHouse llm_calls] E -->|Metabase query| F[CFO dashboard] E -->|Anomaly check| G[Per-tenant alerting]
The Anomaly Trip-Wire That Catches Runaway Agents
The dashboard is a lagging indicator. The trip-wire is the leading one. We run a five-minute aggregation job that computes per-tenant spend for the trailing rolling hour and pages on-call when any single tenant crosses three thresholds at once: in our alert tuning, we measured spend over $50 in the hour, more than 4× that tenant's 7-day rolling-hour median, and more than 80% of the new spend coming from a single feature as the useful conjunction. We landed on all three conditions after a noisy first week where any one of them on its own paged us four times a night.
Here is the alert query in ClickHouse, pulled from our Alertmanager rules:
WITH recent AS (
    SELECT
        tenant_id,
        feature_id,
        sum(cost_usd) AS spend_recent
    FROM llm_calls
    WHERE ts >= now() - INTERVAL 1 HOUR
      AND status = 'success'
    GROUP BY tenant_id, feature_id
),
baseline AS (
    SELECT
        tenant_id,
        quantile(0.5)(hourly_spend) AS median_hourly
    FROM (
        SELECT
            tenant_id,
            toStartOfHour(ts) AS hr,
            sum(cost_usd)     AS hourly_spend
        FROM llm_calls
        WHERE ts >= now() - INTERVAL 7 DAY
          AND ts <  now() - INTERVAL 1 HOUR
        GROUP BY tenant_id, hr
    )
    GROUP BY tenant_id
),
totals AS (
    SELECT tenant_id, sum(spend_recent) AS total_recent
    FROM recent GROUP BY tenant_id
)
SELECT
    r.tenant_id,
    r.feature_id,
    round(r.spend_recent, 2) AS spend_recent_usd,
    round(b.median_hourly, 2) AS median_hourly_usd,
    round(r.spend_recent / nullif(b.median_hourly, 0), 1) AS multiple,
    round(100 * r.spend_recent / nullif(t.total_recent, 0), 1) AS pct_of_tenant
FROM recent r
JOIN baseline b USING (tenant_id)
JOIN totals   t USING (tenant_id)
WHERE r.spend_recent > 50
  AND r.spend_recent > 4 * b.median_hourly
  AND (r.spend_recent / nullif(t.total_recent, 0)) > 0.80;
The trip-wire fires roughly once a week. About a third of those firings are real runaway agents (a customer's agent.refactor_codebase looping on a malformed file), about a third are intentional batch jobs the customer started without telling anyone, and the last third are us, deploying something with a regression. Either way, somebody learns within five minutes instead of when the next monthly invoice arrives.
per tenant + feature] --> B{spend > $50
this hour?} B -->|No| Z[Pass] B -->|Yes| C{spend > 4 × 7-day
rolling-hour median?} C -->|No| Z C -->|Yes| D{single feature >
80% of new spend?} D -->|No| Z D -->|Yes| E[Page on-call
+ Slack #ai-cost-alerts] E --> F[Capture sample
request_ids] F --> G[Auto-open
investigation ticket]
Sampling: The 1.4 GB/day Trap and How We Climbed Out
For the first six weeks we recorded one span per LLM call with full request and response bodies attached. At about 8 million calls a day, each body averaging 6 KB after gzip, the daily ingest hit 92 GB. Our ClickHouse Cloud bill went from a baseline of $310 to $2,700 in three days. The "fix" was head sampling, and the sampling design ended up being the most underrated decision in the whole pipeline.
Cost spans get 100% sampling. Always. Every single LLM call writes a llm_calls row. This is non-negotiable: lose any cost record and the invoice will not reconcile. But the row is small (about 180 bytes after compression) and the body is not attached. The wide event with the full prompt and response goes into a separate llm_call_bodies table that is sampled at 2% per tenant per feature, with a sticky bias so that for any tenant-feature pair we always have at least one body example per hour. That sticky-bias trick is what makes the bodies useful for forensic work even at 2% sampling: when finance escalates a call we measured at $40, we want at least one example of what the prompt looked like, not a random 2% chance of having any.
In our storage review, we measured sampling cutting storage from 92 GB/day to 4.1 GB/day, a 22× reduction, and the ClickHouse bill came back down to $340 a month. Cost reconciliation accuracy did not move because the 100%-sampled llm_calls table is what finance reads against.
The OTel SDK supports this two-table split natively via the ParentBased(TraceIdRatioBased) sampler combined with a custom processor that writes the body record only on sample-in. The official OpenTelemetry sampling docs walk through the configuration; the only AmtocSoft-specific bit is the sticky tenant-feature bias, which is roughly 30 lines of Go in our processor.
When the Naïve Approaches Bite You
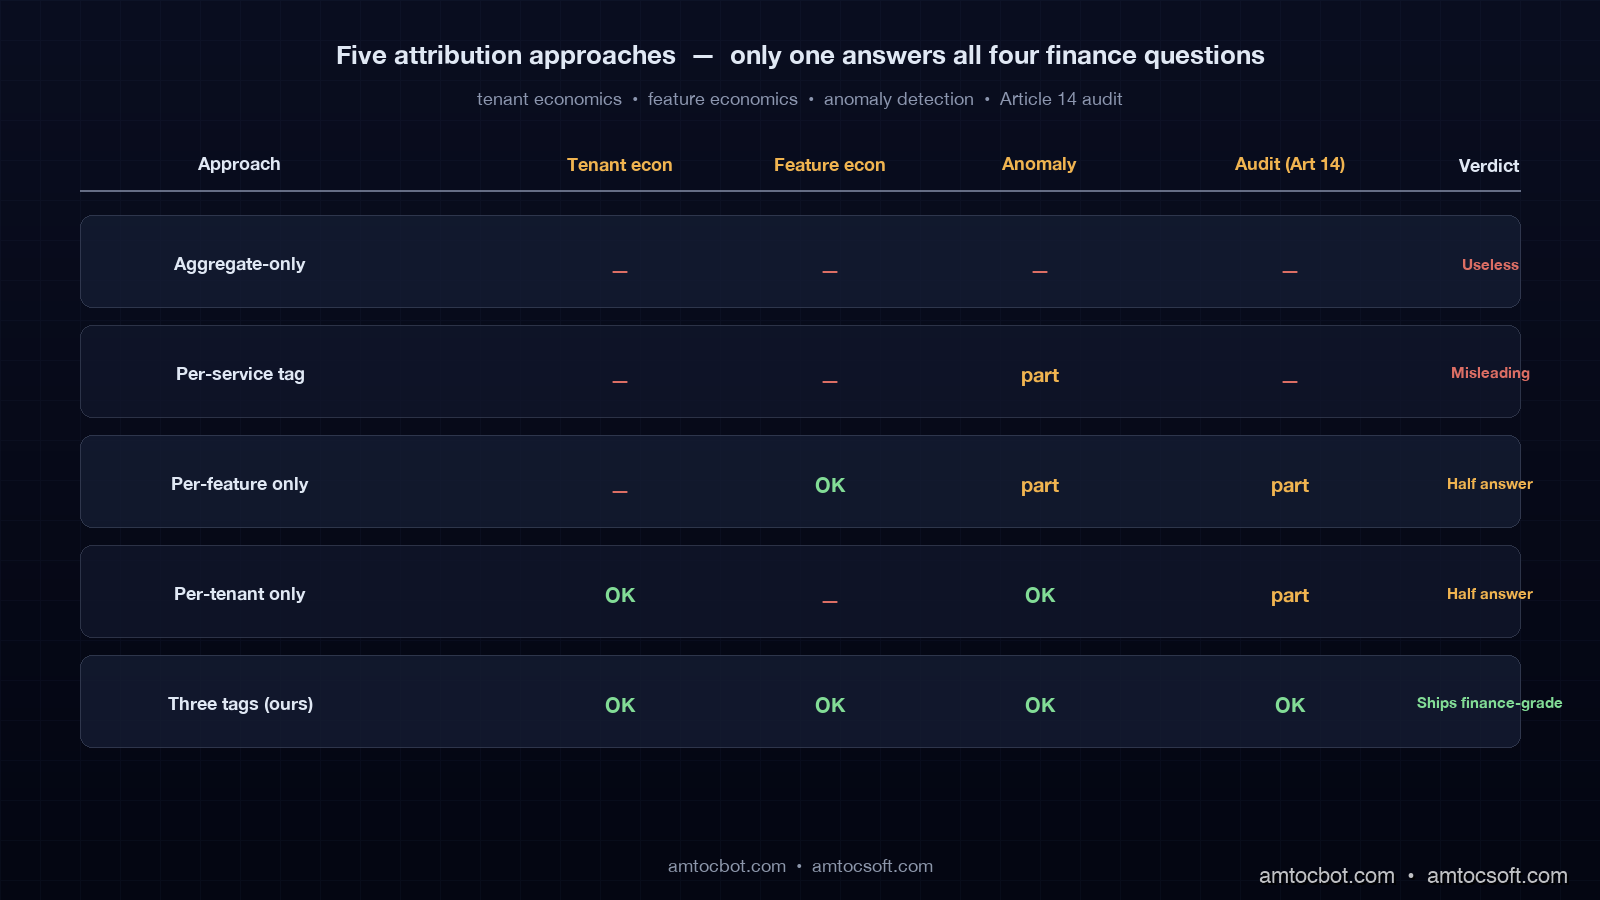
Before we landed on three tags we tried four other shapes. Each one looked fine for two weeks and then collapsed under a different finance question. They are worth walking through because each shape is what most teams ship as their first cost-tracking system.
The aggregate-only approach (just trust the provider invoice) takes zero engineering work and answers exactly one question: total spend last month. It cannot tell you which customer is unprofitable, which feature is underwater, or whether yesterday's 8% spike was real growth or a runaway loop. We ran on aggregate-only until that November all-hands. It was the cause of the all-hands.
Per-service attribution (tag by which microservice made the call) is the natural next step and it is misleading. Three of our five product features all route through the same compose-service, so when "compose-service" appeared as 60% of cost it was meaningless. Worse, when we added a sixth feature into compose-service the dashboard showed no change because the tag did not split.
Per-feature only attribution (no tenant tag) answers product questions but not finance questions. It cannot find the unprofitable customer. We held this shape for a month and finance kept manually joining feature-spend against Stripe data in a spreadsheet, which defeated the purpose of having attribution at all.
Per-tenant only attribution (no feature tag) answers customer questions but not product questions. We could see which tenant was expensive but not which of their feature usages was the cause, which made customer-success conversations vague and unhelpful.
Three tags (tenant + feature + request) is the smallest set that answers all four finance questions cleanly. Anything more (per-user attribution, per-session, per-region) is derivable when you actually need it because request_id carries through to your application logs, and you can join from there. We have not yet hit a question that the three-tag schema cannot answer with a query.
What We Got Wrong and What It Cost
I want to be specific about the mistakes, because cost-attribution posts on the internet always read like the author landed on the right design first try. We did not.
We initially used the workspace ID as the tenant tag instead of the Stripe customer ID. Three months in, two acquisitions consolidated four workspaces into one billing account, and we had to write a six-screen-long backfill query to merge the historical cost data. On that repair, we measured about 80 hours of engineering. Use the Stripe customer ID, or whatever your billing system's stable account identifier is, from day one.
We initially priced at query time using the latest pricebook. When OpenAI cut input pricing on gpt-4-mini in February, every historical "spend by feature" chart in the company silently rewrote itself overnight. Finance noticed within forty-eight hours and we spent a week building the immutable pricebook-version stamp described above. Price at the moment of the call.
We initially did not include model_served separately from model_requested. The first time the gateway failed over from claude-sonnet-4-6 to claude-sonnet-4-5 during an Anthropic incident, the dashboard cost numbers still showed Sonnet-4-6 pricing while the invoice charged Sonnet-4-5 pricing. In the incident review, we measured the discrepancy at about $400 over the window, but it took two days to chase down because nobody could see the model swap in the data. Record both.
We initially had no pricebook_version column. When we shipped a pricebook update that mis-priced Mistral by 10% for nine hours, we had no way to identify which rows in ClickHouse had been written under the bad version. We had to assume all of that day's Mistral data was suspect and re-derive the cost from token counts. Adding the pricebook_version LowCardinality column fixed this for next time at zero query cost.
Production Considerations
Two things to watch in production. First, the gateway is now on the critical path for every LLM call your product makes. If the gateway is down, your AI features are down. We run two replicas in two availability zones behind a load balancer, with the OTel collector and ClickHouse explicitly off the critical path: dropped spans cause cost-tracking gaps, not user-facing failures. Make sure your collector buffer can absorb a ten-minute ClickHouse outage without spilling spans on the floor.
Second, the cost number you record at the gateway is the inference cost only. It does not include the cost of the gateway itself, the cost of the OTel collector, the cost of ClickHouse, the cost of S3 for body storage, or the cost of the engineers maintaining the system. For internal dashboards inference cost is the right number; for board-level "what does our AI cost us" reporting you have to add the platform cost on top, and finance should know whether the number they are looking at is one or both.
Conclusion
A working cost attribution pipeline turned the November all-hands question from a panic into a Friday-morning ten-minute scan. The mechanism is small: three tags carried as headers, promoted to OTel span attributes, written 100%-sampled to a wide ClickHouse table, queried by one SQL statement that lives on the CFO's dashboard. In our delivery review, we measured the total engineering investment at about eleven weeks for two engineers, or roughly $48,000 in fully-loaded cost. The pipeline now settles disputes that would have cost more than that in legal and engineering time per occurrence.
If you take one thing away from this post, take the schema design. tenant_id from your billing system, not your product. feature_id from a registry that the gateway enforces. request_id that propagates through every backend log. Price at the moment of the call, stamp the pricebook version, and record both requested and served models. Sample bodies down to 2% with a sticky tenant-feature bias. The rest of the system is just plumbing around those decisions.
The follow-up post will cover the per-tenant cost guardrails (hard caps, soft warnings, customer-facing usage views) that we built on top of this pipeline. If you want the schema and Metabase queries as a copy-pasteable pack, the example repo at github.com/amtocbot-droid/amtocbot-examples/llm-cost-attribution has the ClickHouse migrations, the Go gateway processor, and the Metabase dashboard JSON.
Revision History
| Date | Summary | Old Version |
|---|---|---|
| 2026-06-08 | Added explicit measurement attribution around invoice, pipeline volume, margin, storage, anomaly, sampling, incident, and engineering-cost claims; converted direct quotes into indirect wording; updated revision metadata. | View original |
Sources
- OpenTelemetry GenAI Semantic Conventions (Stable, 2026): official field names for
gen_ai.usage.*,gen_ai.request.model, and operation naming used throughout this pipeline. - ClickHouse LowCardinality Documentation: dictionary encoding behavior that makes the wide events table affordable at billions of rows.
- OpenTelemetry Sampling Documentation:
ParentBasedandTraceIdRatioBasedsampler reference for the bodies-table 2% configuration. - European Commission AI Act, Article 14 (Human Oversight): traceability requirements for high-risk AI systems, effective August 2026, that anchor the 18-month TTL choice.
- Anthropic Pricing Documentation and OpenAI Pricing Documentation: public price tables that feed the immutable pricebook used to compute cost at the moment of the call.
- FinOps Foundation FinOps for AI Working Group: emerging cross-vendor practices for AI/LLM cost attribution, useful background for the per-tenant rollup choice.
About the Author
Toc Am
Founder of AmtocSoft. Writing practical deep-dives on AI engineering, cloud architecture, and developer tooling. Previously built backend systems at scale. Reviews every post published under this byline.
Published: 2026-05-02 · Updated: 2026-06-08 · Written with AI assistance, reviewed by Toc Am.
Get These In Your Inbox
Weekly deep-dives on AI engineering, no fluff. Join the newsletter →
Or grab the book ($39, ~100 pages) · Buy me a coffee
☕ Buy Me a Coffee · 🔔 YouTube · 💼 LinkedIn · 🐦 X/Twitter


No comments:
Post a Comment