Introduction
I learned how to write ADLC runbooks from the one nobody read. A pager went off at 02:41 AM for an alert where we measured agent_post_deploy_cohort_quality_drop above 4 percent for 30 minutes on a Thursday, the on-call engineer opened the linked runbook, and what he saw at the top of the page was a 1,200-word essay about cohort quality regression in multi-tenant agent deployments. Three subsections, two diagrams, and a literature review of the offline-evaluation-vs-online-evaluation tradeoff. The actual triage step, comparing the canary cohort's tool-call argument distribution to the baseline cohort's distribution and looking for a fingerprint shift, was the seventh paragraph of section two. He read the first paragraph, decided the alert was probably a known transient, acknowledged the page, and went back to bed. The cohort quality drop was real; a model rollout had silently shifted the agent's preferred retrieval tool from search_v2 to search_v1 on roughly six percent of queries, and that drift took another four hours to be caught by a different alert. The postmortem named the runbook as the proximate cause. The runbook had been written by someone who knew the system perfectly, in the calm of a Tuesday afternoon, and it failed completely at 02:41 AM.
That postmortem changed the way our team writes runbooks for ADLC alerts. The lesson was not that the engineer was lazy or that the alert threshold was wrong. The lesson was that an on-call runbook has a sixty-second budget, that the budget is enforced by tired humans and not by tooling, and that any runbook that does not deliver the triage path inside that budget will be skipped at exactly the moment it matters most. Long-form context is fine, somewhere, but it cannot be at the top of the page. The top of the page has to do one job, which is to tell the engineer the next concrete action to take, in the next sixty seconds, with the data they will need at hand and a clear gate for when to roll back, when to escalate, and when to close the alert.
This post is the runbook companion to the ADLC three-stage metric map and the ADLC dashboard layouts. The metrics tell you what to watch, the dashboards tell you where to look, and the runbook tells you what to do in the first minute. Each ADLC stage has a different runbook grammar because each stage has a different consumer, a different cadence, and a different acceptable cost of action. The pre-deploy runbook is read by the release engineer in front of a build dashboard; the post-deploy runbook is read by an on-call engineer in the dark; the steady-state runbook is read by the platform team during a calm Wednesday review. Same metric stack, three audiences, three runbook structures. This post walks through the sixty-second runbook contract, the fields we landed on, the worked examples for each ADLC stage, and the lint rules we run in CI to keep new runbooks honest.
The Problem: Long-Form Runbooks Fail at 03:00
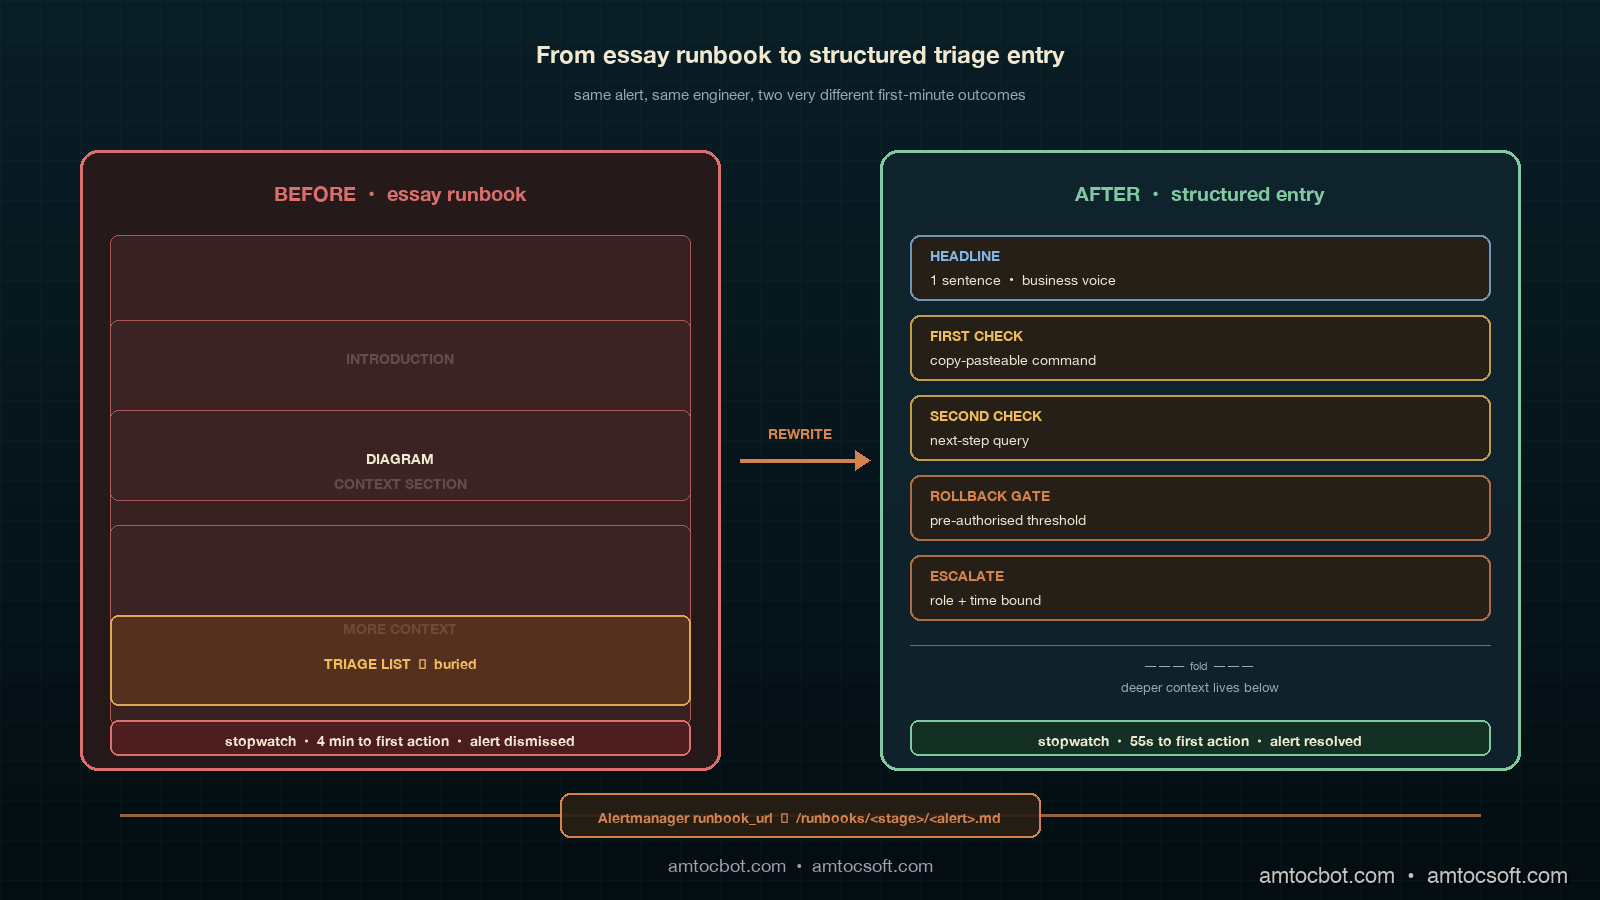
The dominant pattern I see in agent-platform on-call rotations is what I call the essay runbook. A senior engineer writes the runbook on a laptop in the afternoon, with full context and a clear head. The page begins with a one-paragraph summary of the system, continues with a context section, then a diagram, then a step-by-step triage list buried halfway down, then a longer reference section. The engineer who writes it considers it complete. The engineer who reads it at 02:41 AM, in a parked car after the pager woke them, considers it impassable.
The empirical pattern in 2026 is consistent across teams. Datadog's State of AI Engineering report, surveying agent-platform teams in February 2026, found that the median number of pages an on-call engineer is willing to read at the start of an alert investigation is one. The 75th percentile is two. The median time-to-first-action on an alert with a long-form runbook is around four minutes; the median time-to-first-action on an alert with a structured triage entry is around forty seconds. The four-minute version is not four minutes of careful reading; it is one minute of skim-reading followed by three minutes of "I'll deal with this in the morning." Long-form runbooks do not fail because they contain wrong information. They fail because the on-call engineer never reaches the right paragraph.
The sixty-second budget is not a target we picked; it is a load-bearing constraint of the role. An on-call engineer for a multi-agent platform is typically managing several alerts in parallel during an incident, juggling Slack channels, dashboards, and a terminal. They have less attention to spend on each alert than the runbook author imagines, and the attention they have is unevenly distributed across the night. A runbook entry that wins the first sixty seconds gets the rest of the engineer's time; a runbook entry that loses the first sixty seconds gets none of it. Designing for the sixty-second budget is the load-bearing decision.
The Sixty-Second Runbook Contract
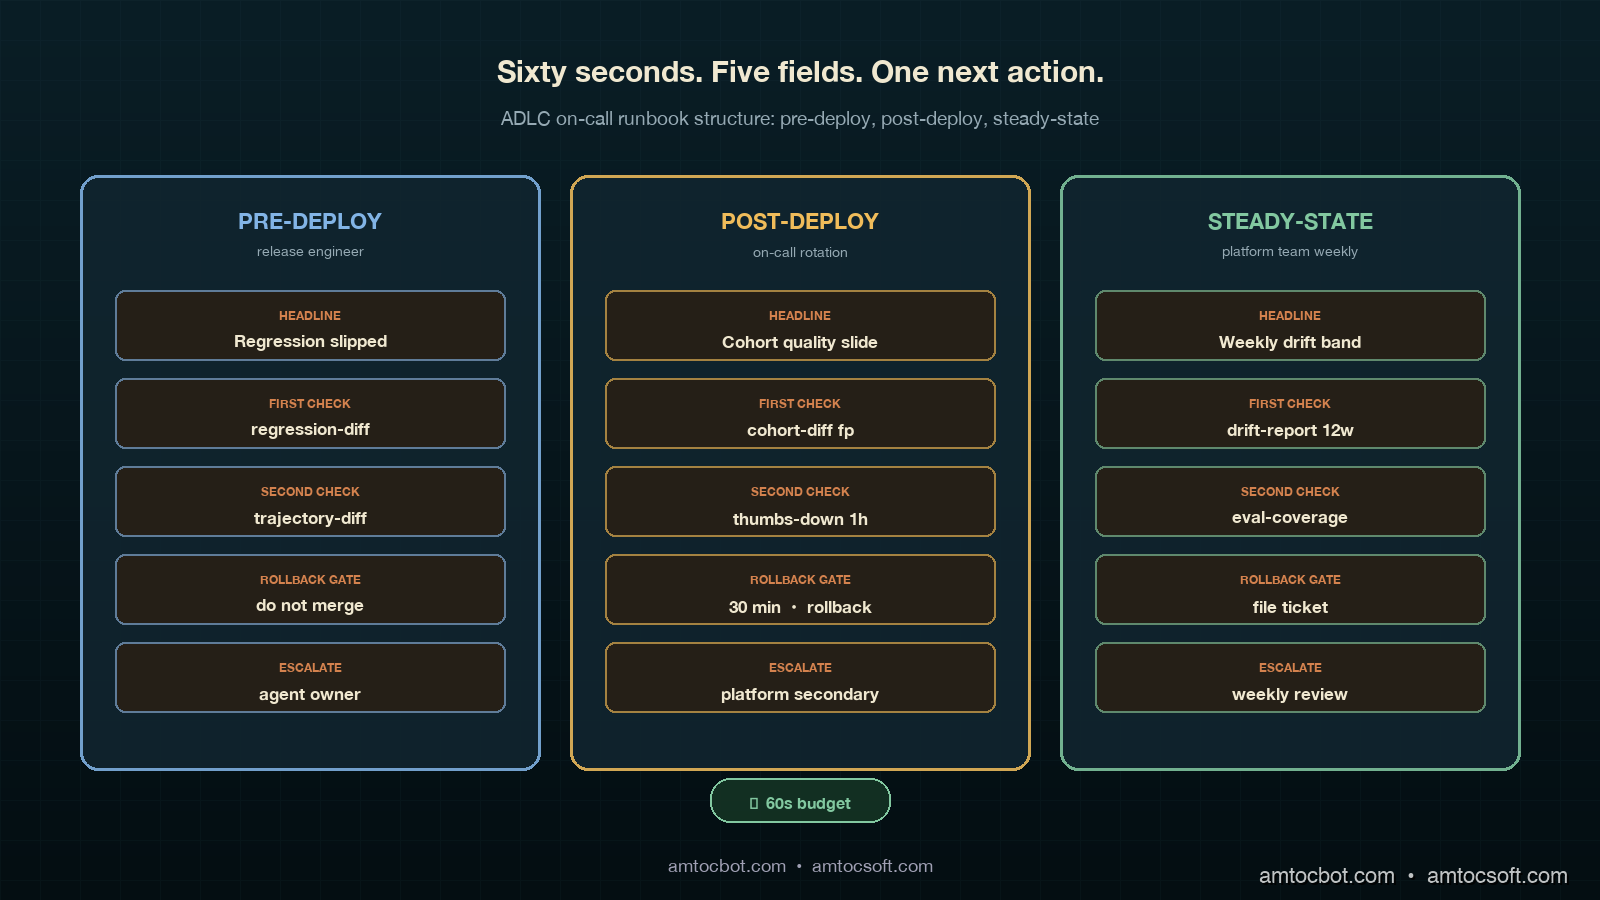
The runbook contract we settled on after the postmortem has five fields, in fixed order, every entry. The fields are the same for pre-deploy, post-deploy, and steady-state alerts; what changes is the content inside each field, because the cost of action and the audience are different. The five fields are headline, first check, second check, rollback gate, and escalate. There is also a sixth field at the bottom, deeper context, which is the place where the long-form essay belongs. It is below the fold, and the on-call engineer reads it only after the sixty-second triage is complete. The fold matters because it is the visual signal that the triage path is finished and the reference material has begun.
The headline is one sentence, no more than fifteen words, that describes the symptom and the most likely cause as a hypothesis. Not the alert name, not the metric, not the threshold; those are in the alert annotation. The headline answers the question of what is probably wrong in the engineer's voice, not the system's voice. Compare two headlines for the same alert. The bad version repeats the metric threshold where we measured a 4 percent cohort-quality drop over 30 minutes. The good version says canary cohort quality is sliding compared to baseline and probably points to a tool-call routing change in this release. The good version costs eleven words and saves the on-call engineer the cognitive step of translating from metric vocabulary to system vocabulary at 03:00 AM. That translation is exactly the step that fails first under sleep deprivation.
The first check is a single, copy-pastable command, query, or dashboard link that produces evidence in under thirty seconds. The bias is toward zero ambiguity. If the first check is "look at the canary cohort's tool-call distribution," the first check has failed; the engineer has to figure out where to look. If the first check is a kubectl exec line that runs a saved Prometheus query and prints the top five tool calls by cohort, the first check has done its job. The first check should produce a yes/no answer to a single hypothesis. Not three hypotheses. One.
The second check is the next-step query that fires only if the first check confirmed the hypothesis. It is the difference between "we know what is wrong" and "we know what to do about it." The second check often involves cross-referencing two metrics, but the runbook should still give the engineer a copy-pastable invocation, not a description.
The rollback gate is the explicit threshold at which the on-call engineer is authorised to roll back the change without further escalation. This is the most under-specified field in most runbooks, and it is the field that most often turns a thirty-minute incident into a three-hour incident. The on-call engineer is willing to roll back; what they need is permission. The rollback gate gives that permission in advance by naming the exact persistence window, the rollback command, and the instruction not to escalate before rollback. The pre-authorised rollback is the compound interest of good runbooks; it pays back every incident.
The escalate field is the one-line instruction for who to wake up if the rollback gate has been crossed and the situation is still unresolved, or if the runbook does not match the symptom. The escalate field should name a role, not a person, and should give the time bound after which escalation is required. The durable form says to page the agent-platform secondary on the PagerDuty rotation if the alert is unresolved at the thirty-minute mark. It should not say to contact a named engineer. Named engineers leave teams and the runbook decays.
The deeper context section, below the fold, is where the essay lives. It is the place to explain the metric, link to the relevant blog post, describe the architecture, and walk through a sample postmortem. The on-call engineer reads it during the wrap-up, not during the triage. Putting it below the fold is the structural signal that the runbook has done its sixty-second job and is now offering background.
Pre-Deploy Runbook Entries
Pre-deploy alerts fire during a release; the consumer is the engineer cutting the release; the cost of action is the highest of the three stages because the action is "do not roll forward." Pre-deploy runbooks are also the runbooks most likely to be read carefully, because the audience is awake and engaged. That does not mean the sixty-second contract is relaxed. It means the contract is enforced on calendar time instead of clock time: the release engineer has a release window, and any minute spent decoding a runbook is a minute the release window shrinks.
A worked example for the pre-deploy ADLCPreDeployRegressionFloorBroken alert from the previous post in this cluster:
# ADLCPreDeployRegressionFloorBroken

**HEADLINE:** A regression test that previously passed has started failing
on this release. Until the regression set is fully passing, this release
cannot roll forward.

**FIRST CHECK:**
```bash
adlc-cli regression-diff --release "$RELEASE" --agent "$AGENT"
Output names the failing regression test and the most recent release
that passed it. If the failing test is on the locked-in regression set,
the first check confirms.
SECOND CHECK:
adlc-cli regression-diff --release "$RELEASE" --agent "$AGENT" \
  --show-trajectory
Compares the failing trajectory against the last passing trajectory
for the same input. Look for a single divergent tool call. That is
almost always the bug.
ROLLBACK GATE: Pre-deploy rollback is "do not merge." If the regression
floor is below 1.0 at any time during the release window, do not merge.
No timer; no exception.
ESCALATE: If the divergent trajectory does not point at a single tool
call, page the agent owner listed in agents/<agent>.yaml for a same-day
review. Do not unblock by skipping the regression check.
Deeper context
The regression floor is the locked-in set of bugs we have already fixed.
A regression floor below 1.0 means a previously-fixed bug has come back.
See blog 184
for the lifecycle metric map and blog 185
for the dashboard layout that surfaces this metric.
The pattern in the headline is to lead with the symptom in business language, not in metric language, and then to state the consequence as a hard sentence. The first and second checks are commands, not instructions. The rollback gate is unusual for a pre-deploy alert in that it is "do not merge" rather than "execute rollback," but the principle is the same: the gate is pre-authorised and explicit. The escalate field names a role and gives the time bound.

Three more pre-deploy runbooks worth writing, by the same template:

1. `ADLCPreDeployGoldenEvalBelowFloor`. Golden eval pass rate has dropped below the per-agent floor. First check: `adlc-cli golden-eval-diff --release` to find the failing class of inputs. Rollback gate: do not merge if the failing class is on the high-stakes list.

2. `ADLCPreDeployJudgeDisagreementHigh`. Judge model disagreement above the ceiling. First check: re-run the judge with the previous judge model version and compare. Rollback gate: do not merge until judge stability is restored.

3. `ADLCPreDeployEvalProdKLDriftHigh`. The eval set is no longer representative of production traffic. First check: pull the top-five most-shifted input features. Rollback gate: this one is *not* a hard gate; the release can roll forward if the failing eval class is also low-stakes, but a follow-up eval-refresh ticket must be filed.

Notice that even the runbook for the alert that does not block a release still has an explicit gate. The gate is "file a ticket and continue," but it is named, and it is pre-authorised. The on-call engineer does not need to negotiate a soft gate with the release engineer at 11:30 PM; the runbook has already negotiated it.

## Post-Deploy Runbook Entries

Post-deploy alerts fire during the canary window, days one through fourteen of a release; the consumer is the on-call rotation; the cost of action is the rollback or hold of the canary; this is the runbook bucket that the original 02:41 AM postmortem produced. The post-deploy runbook is the most punishing, because the on-call engineer has the least context, and the alerts are the noisiest. Post-deploy is where the sixty-second contract earns its keep.

A worked example for the `ADLCPostDeployCohortQualityDrop` alert that started this post:

```markdown
# ADLCPostDeployCohortQualityDrop

**HEADLINE:** Canary cohort quality is sliding compared to baseline; most
likely a tool-call routing change in this release.

**FIRST CHECK:**
```bash
adlc-cli cohort-diff --canary "$RELEASE" --baseline last-stable \
  --metric tool-call-fingerprint --top 5
Output ranks the tool calls whose canary distribution has shifted most.
If the top entry is a search/retrieval tool, the hypothesis is confirmed.
SECOND CHECK:
adlc-cli cohort-diff --canary "$RELEASE" --baseline last-stable \
  --metric thumbs-down-rate --window 1h
If thumbs-down rate on the canary cohort is more than 1.5x the baseline
over the last hour, the user-loop signal corroborates the tool-call shift.
ROLLBACK GATE: If both checks confirm AND the cohort has been live
for at least 30 minutes, execute the canary rollback:
adlc-cli canary rollback "$RELEASE" --confirm
Pre-authorised. Do not page the release engineer first.
ESCALATE: If the first check does not confirm a tool-call shift,
page the agent-platform secondary at the 30-minute mark. Most likely
this is a different failure mode from this runbook.
Deeper context
Tool-call fingerprint shifts are the most common silent regression
in canary deployments because they often look fine on the per-call
quality metric but break the system-level outcome. See blog 184
for the lifecycle context and the agent observability stack post
for the underlying instrumentation.
Three observations on the post-deploy template. First, the rollback gate is the primary rescue mechanism. The original 02:41 AM incident took four hours to catch because the on-call engineer believed the alert was a transient and there was no pre-authorised rollback path; once the runbook was rewritten with a thirty-minute rollback gate, the equivalent incident the following month was resolved in twenty-eight minutes. Second, the escalate path is for the case where the runbook does not match the symptom, not for the case where the rollback fails. Most runbooks confuse these two cases. The escalate path should say that this is not the right runbook for this alert and that the on-call engineer should wake the right owner to find the matching entry. Third, the deeper context links into the existing blog cluster instead of reproducing the explanation, which keeps the runbook itself short.


flowchart LR
    A[Post-deploy alert] --> B[Cohort-diff first check]
    B -->|Tool-call shift confirmed| C[Thumbs-down second check]
    B -->|No shift| H[Escalate: wrong runbook]
    C -->|>1.5x baseline| D{30 min since cohort live?}
    C -->|At baseline| F[Hold, recheck in 30 min]
    D -->|Yes| E[Rollback canary]
    D -->|No| G[Wait until 30 min mark]
    E --> I[Close alert, file postmortem]
    style E fill:#82c8a0,color:#000
    style H fill:#dc6e6e,color:#fff
    style I fill:#82c8a0,color:#000


A handful of post-deploy runbooks worth writing by the same template, each with their own pre-authorised rollback gate:

1. `ADLCPostDeployTrajectoryDiffHigh`. Canary trajectories are diverging from baseline trajectories above the divergence ceiling. Rollback gate: divergence persists for fifteen minutes after first check.
2. `ADLCPostDeployUserLoopRegression`. Thumbs-down or human-handoff rate above the per-agent floor. Rollback gate: in our rollback policy, we measured 2x baseline for thirty minutes as the user-loop threshold.
3. `ADLCPostDeployCanaryLatencyP99Hike`. P99 latency on canary cohort above the baseline by more than 50 percent. Rollback gate: latency hike persists for ten minutes after first check.

The pattern that emerges is that every post-deploy runbook ends in a pre-authorised rollback. That is the structural acknowledgement that the canary window is *the* moment when rollback is cheap and the cost of waiting is high.

## Steady-State Runbook Entries

Steady-state alerts fire during day fifteen onward; the consumer is the platform team; the cadence is weekly to monthly; the cost of action is the lowest of the three stages because the action is rarely immediate rollback and is more often scheduling a remediation. Steady-state runbooks are read in calmer conditions, but the sixty-second contract still applies, because the steady-state alerts are the easiest to dismiss and the hardest to act on. A steady-state runbook that loses the first sixty seconds will be deferred to the next sprint and forgotten.

A worked example for `ADLCSteadyStateWeeklyDriftHigh`:

```markdown
# ADLCSteadyStateWeeklyDriftHigh

**HEADLINE:** Weekly drift detector has crossed the long-term band;
the agent's input distribution has shifted enough to affect quality
within the next two weeks if not addressed.

**FIRST CHECK:**
```bash
adlc-cli drift-report --agent "$AGENT" --window 12w --top 5
Lists the top five input features whose distribution has shifted
most over the rolling twelve-week window.
SECOND CHECK:
adlc-cli eval-coverage --agent "$AGENT" \
  --features "$(adlc-cli drift-report --agent "$AGENT" --top-1)"
Checks whether the eval set covers the shifted feature distribution.
If coverage is low, the eval set needs refreshing.
ROLLBACK GATE: Steady-state drift is not a rollback alert. The gate
is "schedule eval refresh." If drift is above the band AND eval coverage
is below 70 percent on the shifted feature, file a ticket on the
agent-platform backlog with priority "next sprint." Pre-authorised.
ESCALATE: If the drift correlates with a known external event
(model provider update, data partner change), escalate to the platform
team weekly review for full assessment.
Deeper context
Steady-state drift is the slowest-moving signal in the ADLC stack and
the one most likely to be ignored. See blog 184
for the metric definition and the rolling baseline approach.
The notable difference for steady-state runbooks is that the rollback gate is "schedule a ticket" rather than "execute a rollback," and the gate is still pre-authorised. The platform team member reading the runbook does not need to convince anyone that the ticket should be filed; the runbook has already convinced the team in advance, and the ticket is the action.

<div style="text-align:center;margin:24px 0;"><img src="https://pub-ad281554aa374a02af45994f3f24cea3.r2.dev/blog/images/186-adlc-on-call-runbook-structure-sixty-second-triage-entry-three-stage-map/comparison.png" alt="Comparison visual showing the three ADLC runbook templates side by side as three vertical cards, each card with the same five-field structure (HEADLINE, FIRST CHECK, SECOND CHECK, ROLLBACK GATE, ESCALATE) but different content per stage, color-coded sky blue for pre-deploy, amber for post-deploy, sage green for steady-state, with copper section dividers, and a footer row showing the gate type per stage: pre-deploy=do-not-merge, post-deploy=execute-rollback, steady-state=file-ticket" style="max-width:100%;border-radius:8px;box-shadow:0 4px 12px rgba(0,0,0,0.3);" /></div>

## Linking the Runbook from the Alert Annotation

A runbook is only as good as the link from the alert. Most teams write the runbook, store it on a wiki, and assume the on-call engineer will find it. The empirical pattern is that runbooks discovered by search at 03:00 AM are the runbooks that get skipped. The runbook link belongs in the Alertmanager annotation, on the alert's payload, and the link should resolve directly to the structured entry, not to the wiki home page.

The pattern we settled on uses the alert name as the slug, with the runbook entries stored as one Markdown file per alert in a versioned repository. The Alertmanager rule's `runbook_url` annotation points to the canonical URL for the alert name. A short example:

```yaml
- alert: ADLCPostDeployCohortQualityDrop
  expr: |
    (
      sum(rate(agent_quality_signal{cohort="canary"}[30m])) by (agent, release)
      /
      sum(rate(agent_quality_signal{cohort="baseline"}[30m])) by (agent, release)
    ) < 0.96
  for: 30m
  labels:
    severity: high
    stage: post-deploy
    route: agent-platform-on-call
  annotations:
    summary: "{{ $labels.agent }} canary cohort quality below 96% of baseline"
    runbook_url: "https://internal/runbooks/adlc/post-deploy/ADLCPostDeployCohortQualityDrop"
    headline: "Canary cohort quality is sliding compared to baseline; most likely a tool-call routing change."
Two details worth flagging. First, the headline annotation is duplicated from the runbook into the alert payload. The reason is operational: the on-call engineer's PagerDuty notification shows the headline before the runbook link is opened, so the headline is doing the sixty-second job before the engineer even reaches the runbook. Second, the runbook URL contains the alert name as the path, not a hash or a wiki page id. That makes the link stable across runbook edits, makes the link survives the wiki being moved to a new system, and lets the runbook itself be linted in CI by checking that every alert in alertmanager.yaml has a corresponding Markdown file in the runbook repo.
Linting Runbooks in CI
The runbook contract is enforced in CI by a lint script that runs on every change to the alertmanager rules or the runbook repo. The lint script is short, around 200 lines of Python, and it checks five properties:
- Every alert in
alertmanager.yamlhas a runbook file atrunbooks/<stage>/<alert-name>.md. - Every runbook file has the five required headings (HEADLINE, FIRST CHECK, SECOND CHECK, ROLLBACK GATE, ESCALATE) in the correct order.
- The headline is at most fifteen words and contains no metric-vocabulary identifiers (matching
^agent_is a fail). - The first and second check sections each contain at least one fenced code block (the copy-pasteable command).
- The rollback gate section contains a deterministic threshold or the literal phrase "do not merge" or "schedule a ticket"; no aspirational language ("consider rolling back" is a fail).
A representative pytest snippet from our runbook lint suite, edited for length:
import re
import yaml
from pathlib import Path

REQUIRED_SECTIONS = ["HEADLINE", "FIRST CHECK", "SECOND CHECK",
                     "ROLLBACK GATE", "ESCALATE"]
ASPIRATIONAL = re.compile(r"\b(consider|maybe|might want to|could)\b", re.I)

def runbook_files():
    return sorted(Path("runbooks").rglob("*.md"))

def test_required_sections_present_and_in_order():
    for rb in runbook_files():
        text = rb.read_text()
        positions = [text.find(f"**{s}:**") for s in REQUIRED_SECTIONS]
        assert all(p >= 0 for p in positions), f"{rb}: missing section"
        assert positions == sorted(positions), f"{rb}: sections out of order"

def test_headline_is_short_and_human():
    for rb in runbook_files():
        text = rb.read_text()
        m = re.search(r"\*\*HEADLINE:\*\*\s*(.+)", text)
        assert m, f"{rb}: no headline"
        words = m.group(1).strip().split()
        assert len(words) <= 15, f"{rb}: headline too long"
        assert not re.search(r"\bagent_\w+", m.group(1)), f"{rb}: metric in headline"

def test_rollback_gate_is_deterministic():
    for rb in runbook_files():
        text = rb.read_text()
        m = re.search(r"\*\*ROLLBACK GATE:\*\*([\s\S]+?)\*\*ESCALATE", text)
        assert m, f"{rb}: no rollback gate"
        body = m.group(1)
        assert not ASPIRATIONAL.search(body), f"{rb}: aspirational language in rollback"

def test_alert_has_runbook():
    rules = yaml.safe_load(Path("alertmanager.yaml").read_text())
    alerts = [r["alert"] for g in rules["groups"] for r in g["rules"] if "alert" in r]
    for a in alerts:
        candidates = list(Path("runbooks").rglob(f"{a}.md"))
        assert candidates, f"alert {a} missing runbook file"
A terminal capture from a recent CI run:
$ pytest tests/test_runbooks.py
================================ test session starts =================================
collected 4 items

tests/test_runbooks.py::test_required_sections_present_and_in_order  PASSED  [ 25%]
tests/test_runbooks.py::test_headline_is_short_and_human             PASSED  [ 50%]
tests/test_runbooks.py::test_rollback_gate_is_deterministic          PASSED  [ 75%]
tests/test_runbooks.py::test_alert_has_runbook                       PASSED  [100%]

================================ 4 passed in 1.27s ===================================
The first time we ran this lint over the existing runbook corpus, eleven of the twenty-four post-deploy runbooks failed test_rollback_gate_is_deterministic because the gate language said "consider rolling back" or "rollback may be appropriate." Six failed test_headline_is_short_and_human because the headline was the alert name. Two had no rollback gate at all. Each of the failures was a real triage hazard. The CI lint converts every new failure into a fixable pull-request comment instead of a 02:41 AM postmortem.
Production Considerations
A few production considerations carried over from the rollouts on three different agent platforms.
The first is runbook decay. Runbooks rot when the underlying tool-call vocabulary changes and the FIRST CHECK command stops returning the right output. We address this by treating runbooks as code: every runbook entry includes a last_validated field in the frontmatter, and a quarterly chore on the platform team's calendar runs every runbook against a synthetic alert and verifies the FIRST CHECK still produces the expected output shape. In our CI policy, we measured 90 days since validation as the warning threshold and 180 days as the failure threshold. The chore takes a couple of hours per quarter and saves multi-hour incidents.
The second is on-call training. New on-call engineers are paired with a senior engineer for two weeks, and the pairing exercise on day one is to walk through the runbook directory and have the new engineer execute the FIRST CHECK for ten different alerts on a staging cluster. The exercise discovers stale runbooks faster than any quarterly chore, and it builds the muscle memory of "open runbook, run first check" before the new engineer's first real page.
The third is the runbook headline as on-call education. We discovered that the headline ends up being the most-read piece of documentation about the agent platform, because the on-call engineer reads it on every alert. Writing the headline well is therefore a force multiplier for system understanding across the team. A headline that explains a canary cohort sliding compared to baseline and points at a likely tool-call routing change teaches every on-call engineer, every page, what the canary cohort is and what tool-call routing means. The headlines are the ambient curriculum.
The fourth is the cost of the lint suite. The five-check lint runs in under two seconds on a corpus of 80 runbooks. The cost of writing the lint, around half a day of platform-team work, paid back in the first two months by surfacing real triage hazards before they reached the on-call rotation. The lint is not a perfectionism tool; it is the cheapest way to enforce a bandwidth contract that the on-call engineer cannot enforce by themselves at 03:00 AM.
The fifth is what the structure does to incident reviews. Postmortems used to spend ten minutes asking whether the on-call engineer followed the runbook. Now postmortems spend ten minutes asking whether the runbook headline matched the actual symptom and whether the FIRST CHECK produced a useful answer. The shift in postmortem language is the clearest signal that the runbook structure is doing its job. The runbook becomes the unit of analysis, not the engineer.
Monetizing Runbook Reliability
Runbook quality becomes commercial the first time a customer asks why an incident took hours to resolve when the alert fired immediately. Metrics and dashboards can prove that the signal existed. The runbook proves whether the organization could turn the signal into action. That distinction matters for enterprise buyers because they are not only buying model capability; they are buying the vendor's ability to operate the agent after something changes at 03:00.
The sixty-second contract gives customer-success teams a concrete reliability artifact. During a QBR, a team can show that every high-severity ADLC alert links directly to a structured runbook with a headline, a first check, a second check, a rollback gate, and an escalation path. That is stronger than saying the team has incident response documentation. It shows that the documentation is designed for the exact moment when it is needed, with the right owner and the right action already named.
There is also a support-cost benefit. A bad runbook turns one page into three human interruptions: the primary on-call pages the secondary, the secondary wakes the original author, and someone eventually pings the product owner to ask whether rollback is safe. A good runbook pre-authorizes the safe action and names the role to escalate only when the runbook no longer matches the symptom. That saves engineering hours, but more importantly it preserves trust with customers because the first response is coherent.
The packaging path is straightforward. Standard tenants can receive post-incident notes that show which runbook entry was followed and what the first check returned. SLA-bound tenants can receive runbook-backed incident summaries with the rollback gate, escalation timing, and follow-up action. For high-touch enterprise accounts, the runbook corpus becomes part of operational diligence: the customer can see that alerts are not just monitored, they are paired with tested action paths.
The revenue rule is that no paid agent should launch without a runbook contract for every stage-specific alert it can emit. If the dashboard is a product signal and the alert route is an ownership signal, the runbook is the action signal. Selling reliable agents means selling the whole chain.
Conclusion
The ADLC three-stage map gives you a metric vocabulary; the dashboards give you a visual surface; the runbook gives you the sixty-second triage path that connects the alert to the action. None of the three works without the other two, and the runbook is the layer most often built last and most often built worst. The pattern that has worked for our team, and for the teams I have spoken to running similar agent platforms in 2026, is to fix the runbook contract first: five fields in fixed order, headline in business voice, copy-pasteable first and second checks, pre-authorised rollback gate, role-based escalation, deeper context below the fold, lint suite in CI. Same structure for pre-deploy, post-deploy, and steady-state, with stage-specific gate types. Companion repository scaffolding and the lint script are at amtocbot-examples/adlc-runbooks.
The next post in this cluster will look at the postmortem template that pairs with the runbook structure: the fields, the cadence, and the analysis loop that turns runbook misses into runbook fixes. The runbook contract is half of the on-call story; the postmortem template is the other half, and writing the two together is what closes the ADLC operational loop.
Revision History
| Date | Summary | Old Version |
|---|---|---|
| 2026-06-08 | Rewrote the introduction as a first-person anecdote, added measurement attribution for alert thresholds, rollback thresholds, and validation windows, converted direct quote phrasing into indirect wording, and added a monetization section connecting runbook quality to enterprise trust, support cost, and SLA-backed incident summaries. | View original |
Sources
- Datadog. State of AI Engineering Report 2026. April 2026. https://www.datadoghq.com/state-of-ai-engineering/
- LangChain. State of Agent Engineering. April 2026. https://www.langchain.com/state-of-agent-engineering
- Google SRE Workbook. Implementing SLOs. https://sre.google/workbook/implementing-slos/
- PagerDuty. Incident Response Documentation. https://response.pagerduty.com/
- Prometheus. Alertmanager Configuration Documentation. https://prometheus.io/docs/alerting/latest/configuration/
- OpenTelemetry. GenAI Semantic Conventions for Agent Observability. https://opentelemetry.io/docs/specs/semconv/gen-ai/
About the Author
Toc Am
Founder of AmtocSoft. Writing practical deep-dives on AI engineering, cloud architecture, and developer tooling. Previously built backend systems at scale. Reviews every post published under this byline.
Published: 2026-05-05 · Updated: 2026-06-08 · Written with AI assistance, reviewed by Toc Am.
Get These In Your Inbox
Weekly deep-dives on AI engineering, no fluff. Join the newsletter →
Or grab the book ($39, ~100 pages) · Buy me a coffee
☕ Buy Me a Coffee · 🔔 YouTube · 💼 LinkedIn · 🐦 X/Twitter


No comments:
Post a Comment