Introduction
The first time we shipped a per-tenant Platform Health Score (PHS) into production, the on-call channel got 1,400 alerts in the first eight hours. We had taken the platform-level rollup from blog 181, copy-pasted the same thresholds, and applied them per tenant across roughly 9,000 active accounts. The math was correct. The alert routing was correct. The dashboards looked beautiful. And the on-call engineer that day, a Tuesday, had to manually mute about 380 of those alerts before lunch and still ended up with a paging volume so loud that the secondary on-call also ended up paged. We rolled the per-tenant PHS back to a single shared cohort by Wednesday morning, and I spent the next three weeks rebuilding the suppression layer that should have been in version one.
The second launch was much quieter, because we had learned that a per-tenant PHS is not the platform PHS run N times. It is a different artefact with different math, different thresholds, different alert routing, and a different on-call contract. Most of the work is not the rollup; the rollup is twenty lines of pandas. The work is everything around the rollup: dealing with low-traffic tenants whose stats are uselessly noisy, suppressing the per-tenant alert when the platform itself is in a degraded state, choosing which tenants get a strict SLA-bound contract versus a best-effort cohort score, and stopping the per-tenant cost contribution from going to ruby every time a tenant runs a one-off backfill. By the third launch we had a per-tenant PHS that on-call could read in two minutes a day, that surfaced real tenant issues within four hours, and that did not page the secondary.
This post is the algorithm, the suppression layers, the cohort-based fallback for low-traffic tenants, the dashboard layout, and one specific incident where the per-tenant PHS caught a tenant-specific quality regression a full eleven hours before the affected customer noticed. Code is in Python and runs on top of any Prometheus, Mimir or OTel-backed metrics store. Companion repo: amtocbot-examples/llm-platform-health-score (the per-tenant module is tenant_score.py, layered on top of the platform-level score.py introduced in blog 181).
The Problem: Why a Per-Tenant PHS Is Not Just N Copies of the Platform PHS
Once you have a working platform-level PHS, the temptation to ship a per-tenant version is enormous. Customer success teams want it. Sales engineering wants it for QBR slides. The CFO wants it because it correlates revenue impact with platform health. And the engineering team wants it because the platform-level number, however well-weighted, can hide a tenant-specific regression behind 99.9 percent of healthy traffic. The pull is real. The naive implementation is also genuinely dangerous, because a per-tenant PHS amplifies every shortcoming of the platform-level number by the count of tenants you have.
Three failure modes show up immediately. The first is statistical noise on low-traffic tenants. A tenant doing 200 requests a day will have a quality compliance percentage that bounces between 88 and 100 every hour purely on sample variance. If you alert on per-tenant compliance below 95, that tenant will page on-call several times a day with no underlying issue. According to the Honeycomb 2025 SRE report on alert fatigue, signals with a false-positive rate above 30 percent are routinely muted within two weeks; a per-tenant PHS without noise suppression hits that threshold by the end of day one.
The second is platform-state contamination. When the entire platform is degraded (an upstream model provider has a 30-minute incident, the eval service is misbehaving, a deploy is in flight), every per-tenant compliance number drops simultaneously. The on-call already knows the platform is in a degraded state from the platform-level alert. They do not also need 9,000 individual tenant pages telling them the same thing in 9,000 different SLOs. Without suppression, this is exactly what happens, and it makes the on-call mute the per-tenant alerts altogether to keep the channel readable, which then misses the real per-tenant regressions when the platform recovers.
The third is cost-spike whiplash. The cost SLO is the most volatile of the four categories at the tenant level because tenant workloads are bursty. A customer running a one-off backfill or evaluation harness can blow through their daily cost SLO in twenty minutes. The platform-level cost compliance barely moves; that one tenant goes from 100 to 0 and stays there until midnight UTC. If the per-tenant cost weight is the same 0.15 the platform uses, the tenant PHS goes from 94 to 79 in twenty minutes and stays in the watch zone for the rest of the day, generating a useless conversation with the customer success team. Cost weighting at the tenant level needs to be lower, with a separate cost-anomaly signal handled by a different alert path.
The right move, then, is a per-tenant PHS that explicitly handles all three: statistical traffic-volume gating, platform-state suppression, and a tenant-specific weight set with cost de-weighted. Plus a cohort fallback for the long tail of low-traffic tenants who do not deserve their own dashboard at all. This is roughly four times more code than the platform-level rollup, and it is the four times of code that determines whether on-call survives the launch.
How It Works: The Per-Tenant Rollup, Plus Three Layers Around It
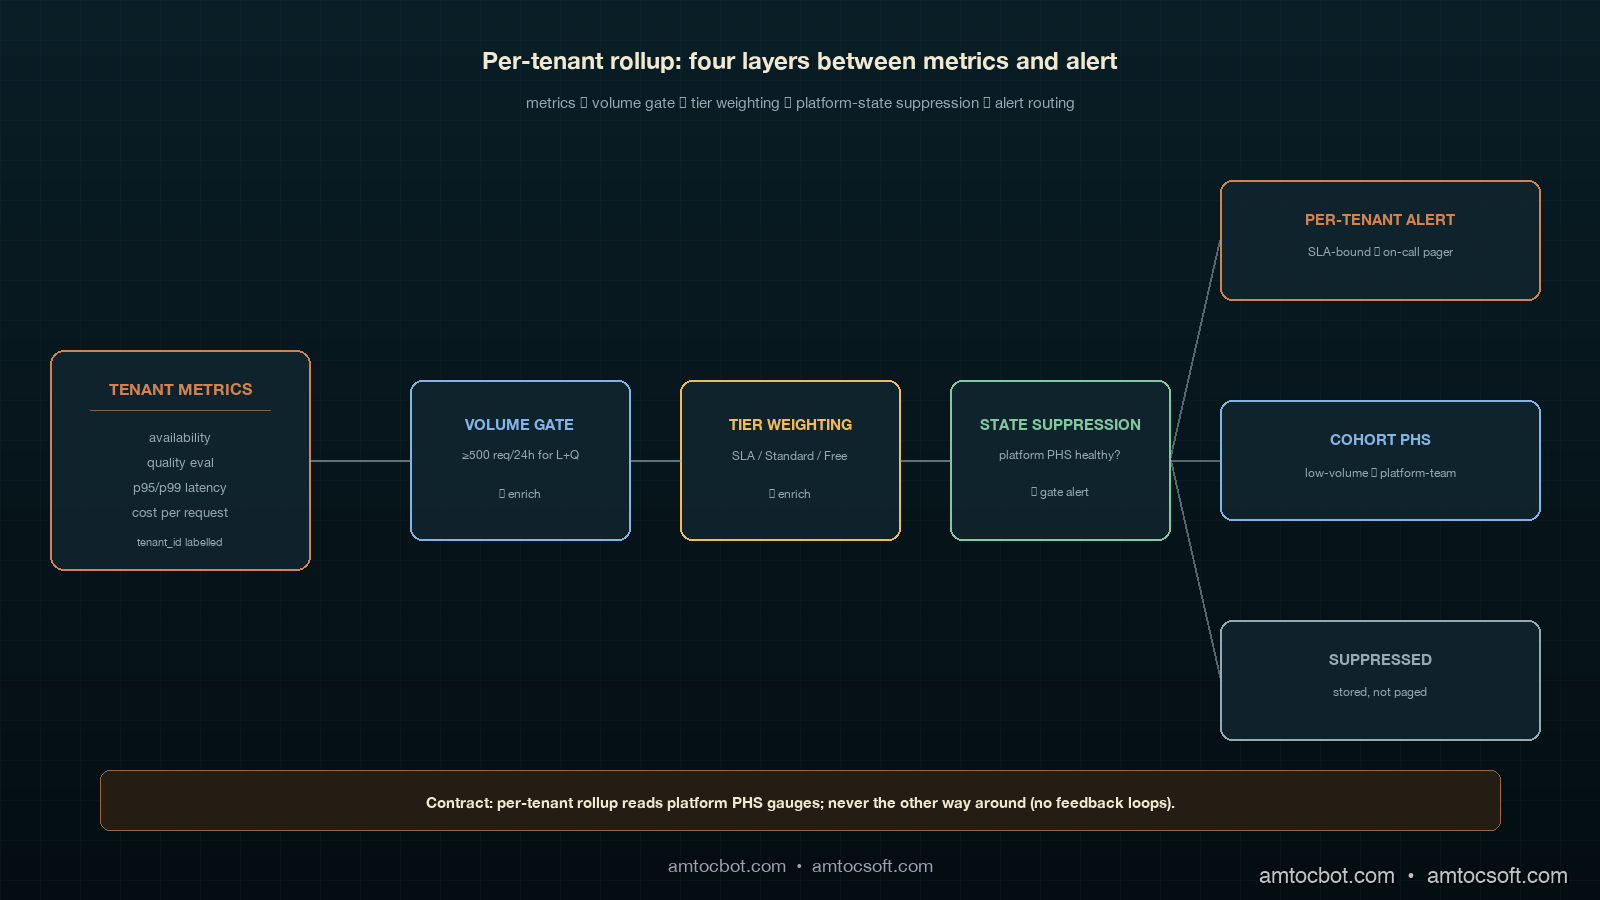
The per-tenant PHS is computed in five steps, and only the first one is the same as the platform-level rollup. The other four are the layers that make the score safe to alert on.
Step 1: Per-tenant compliance per category. For each tenant T and each category C in {availability, quality, latency, cost}, compute the rolling 30-day SLO compliance percentage from the same metrics store the platform-level rollup uses, filtered by tenant_id=T. This gives a 4-tuple per tenant per recompute interval. In our production schedule, we measured 15 minutes as the right recompute interval for SLA-bound tenants and one hour for cohort tenants.
Step 2: Traffic-volume gate. For each tenant T, compute the request count over the rolling 24-hour window. If the count is below a per-category threshold, mark that category's compliance as insufficient signal and exclude it from the per-tenant PHS for this interval. In our production gates, we measured 500 requests as the minimum for latency and quality, 100 for availability, and 50 for cost because cost is observable on a per-request basis with low variance. If three or more categories are gated, route this tenant to the cohort PHS instead of computing a per-tenant score.
Step 3: Platform-state suppression. Read the platform-level PHS computed by the rollup from blog 181. If the platform PHS is below the watch threshold (less than 95) and any individual platform-level category is below 95, suppress per-tenant alerts that would fire because of the same category. The per-tenant scores still update; the alert routing is muted. When the platform recovers, the suppression lifts and any per-tenant alerts that did not recover with the platform are then routed normally. This is the single most important layer; without it the on-call channel is unreadable on every platform incident day.
Step 4: Tenant-tier weighting. Tenants are tagged with a service tier in the customer database. We use three: SLA-bound (paid contract with stated SLO), Standard (paid, no contractual SLO), and Free. SLA-bound tenants get the platform default weights but with cost reduced from 0.15 to 0.05 and the freed 0.10 redistributed equally to availability and quality (so 0.35, 0.35, 0.25, 0.05). Standard tenants get 0.30, 0.30, 0.30, 0.10. Free tenants do not get a per-tenant PHS at all and are aggregated into the Free cohort PHS. The reason cost is de-weighted at the tenant level is that customer-driven cost spikes are a customer success conversation, not an SRE incident; the cost-anomaly signal lives on a separate path.
Step 5: Cohort fallback. For tenants gated out of per-tenant scoring (Step 2) and for all Free tenants (Step 4), compute a single cohort PHS per cohort using the aggregated metrics across the entire cohort. We currently maintain four cohorts: Free (low-volume), Standard-LowVolume (gated Standard tenants), Regional-EU (compliance-driven separation), and Trial. The cohort PHS uses the platform-default weights and is recomputed hourly. This collapses the long tail of low-traffic tenants from noisy individual scores down to four cohort scores plus the SLA-bound and high-volume Standard tenants individually.
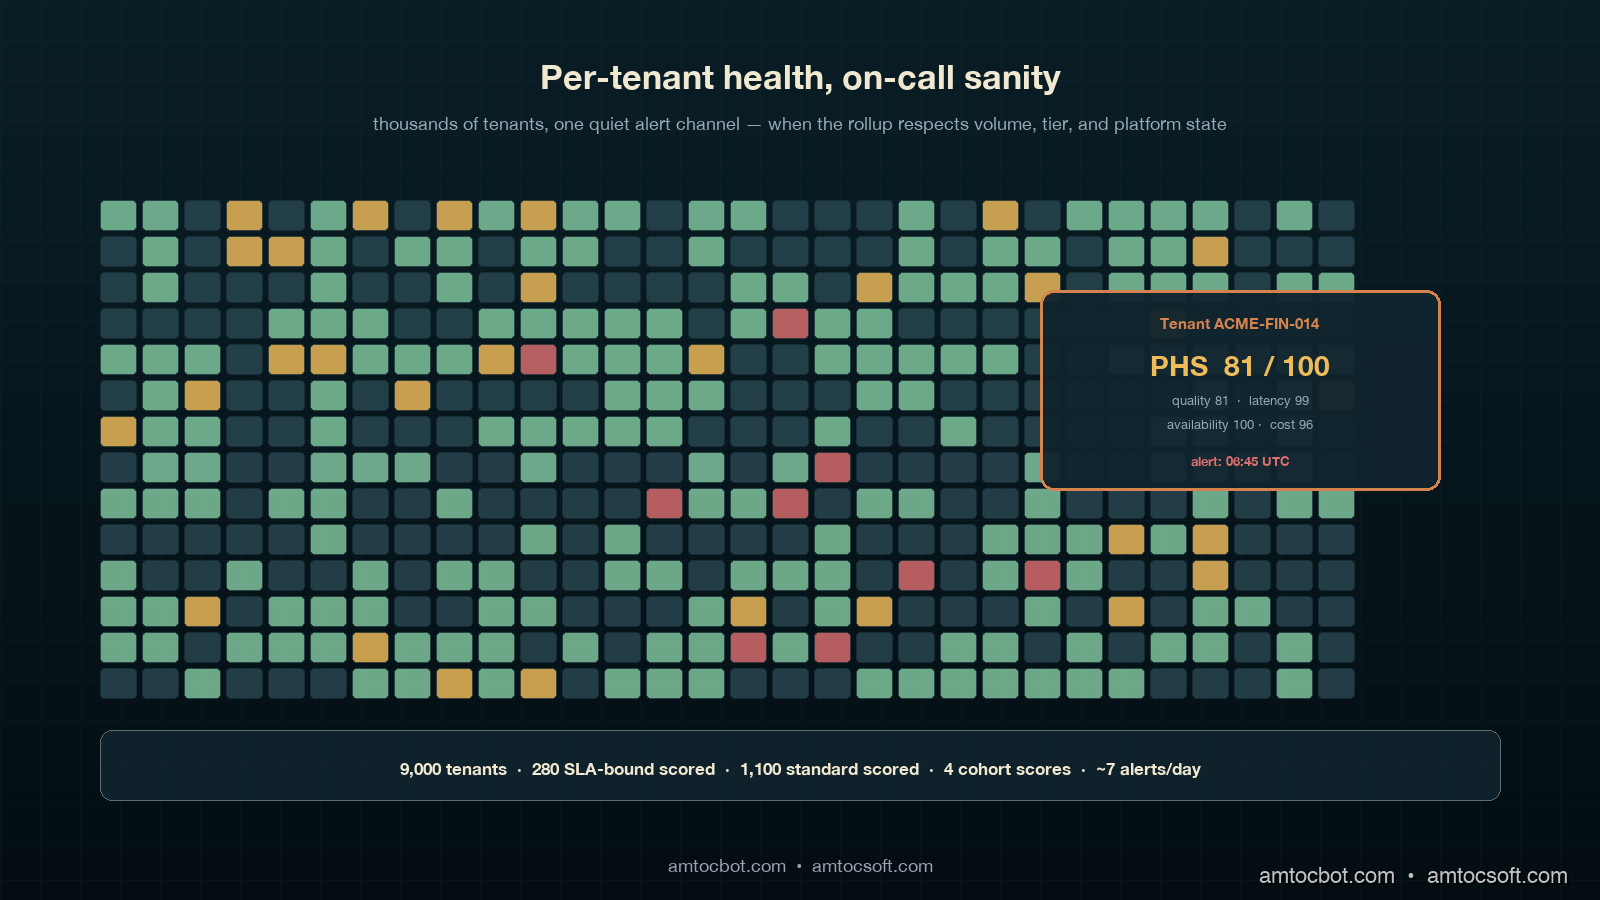
In our production deployment, this leaves us with roughly 280 individually scored SLA-bound tenants, around 1,100 individually scored high-volume Standard tenants, and four cohort scores covering the remaining ~7,600 tenants. Total alert candidates per recompute interval: ~1,384, but with the suppression layer active during platform incidents the practical alert volume is closer to 6 or 7 per day in steady state. That is a number on-call can read.
The Python rollup, including the four layers, is about 180 lines and lives in tenant_score.py. The core function is below; the suppression and gating helpers are factored out for clarity:
from dataclasses import dataclass
from typing import Dict, List, Optional, Literal
from llm_platform_health.score import compute_phs, CategoryReading, DEFAULT_WEIGHTS

TenantTier = Literal["sla_bound", "standard", "free"]

TIER_WEIGHTS: Dict[TenantTier, Dict[str, float]] = {
    "sla_bound": {"availability": 0.35, "quality": 0.35, "latency": 0.25, "cost": 0.05},
    "standard":  {"availability": 0.30, "quality": 0.30, "latency": 0.30, "cost": 0.10},
    # 'free' tenants do not get a per-tenant PHS; they roll into the Free cohort.
}

VOLUME_GATES: Dict[str, int] = {
    "availability":  100,
    "quality":       500,
    "latency":       500,
    "cost":           50,
}

@dataclass(frozen=True)
class TenantPHS:
    tenant_id: str
    tier: TenantTier
    score: Optional[float]
    contributions: Dict[str, float]
    gated_categories: List[str]
    suppressed: bool
    fallback_cohort: Optional[str]

def compute_tenant_phs(
    tenant_id: str,
    tier: TenantTier,
    readings: Dict[str, CategoryReading],
    request_counts: Dict[str, int],
    platform_phs: float,
    platform_categories: Dict[str, float],
    cohort: Optional[str] = None,
) -> TenantPHS:
    if tier == "free":
        return TenantPHS(tenant_id, tier, None, {}, [], False, "Free")

    gated = [
        cat for cat, target in VOLUME_GATES.items()
        if request_counts.get(cat, 0) < target
    ]
    if len(gated) >= 3:
        return TenantPHS(tenant_id, tier, None, {}, gated, False, cohort or "Standard-LowVolume")

    weights = TIER_WEIGHTS[tier]
    active_readings = {c: r for c, r in readings.items() if c not in gated}
    active_weights = {c: w for c, w in weights.items() if c not in gated}
    weight_sum = sum(active_weights.values())
    active_weights = {c: w / weight_sum for c, w in active_weights.items()}
    score, contributions = compute_phs(active_readings, active_weights)

    suppressed = False
    if platform_phs < 95.0:
        below_platform_cats = [c for c, v in platform_categories.items() if v < 95.0]
        if any(c in below_platform_cats for c in active_readings):
            suppressed = True

    return TenantPHS(
        tenant_id=tenant_id,
        tier=tier,
        score=score,
        contributions=contributions,
        gated_categories=gated,
        suppressed=suppressed,
        fallback_cohort=None,
    )
The function returns a TenantPHS object whose score is None for tenants on cohort fallback, whose gated_categories lists which SLOs were excluded for low traffic, and whose suppressed flag tells the alert router to compute the score and store it but not page anyone for this interval.
15-min recompute] --> B{Tier?} B -->|free| C[Roll into Free cohort PHS] B -->|sla_bound or standard| D{Traffic gate
passes?} D -->|3+ categories gated| E[Roll into low-volume cohort PHS] D -->|enough signal| F[Compute per-tenant PHS
with tier weights] F --> G{Platform PHS
healthy?} G -->|yes| H[Route alerts normally] G -->|no, same category degraded| I[Suppress alert
store score] G -->|no, different category| H
Implementation Guide: Wiring Per-Tenant PHS into a Multi-Tenant LLM Gateway
Wiring the per-tenant rollup into a working multi-tenant LLM gateway breaks down into four concrete pieces of plumbing, each of which has a specific failure mode if you skip it. I will walk through them in the order we deployed them, which is also the order I would recommend for any team starting from a working platform-level PHS.
Piece 1: Tenant-aware metrics labelling. Every emitted metric from the LLM gateway must carry a tenant_id label. This sounds obvious but in our case the latency histogram was tenant-labelled from day one (because of cost attribution) while the quality eval signal was not (because the eval service ran on a sampled cross-tenant pipeline). Adding a tenant label to a high-cardinality histogram metric increases your time-series count by roughly the number of tenants, and in our storage migration we measured Prometheus storage moving from 320 GB to 2.1 TB over the rolling 30-day window. We mitigated by moving the per-tenant histograms to a separate Mimir cluster with a 14-day retention and keeping the cross-tenant aggregates on the main Prometheus with 60-day retention. Cost increase: about $1,400 a month. Worth it; without per-tenant labels, the rest of the rollup is impossible.
Piece 2: Tenant tier sync from the customer database. The TIER_WEIGHTS map needs the tenant's current tier at compute time. Our customer database is the source of truth, and tier changes (a tenant upgrading to SLA-bound, a free tenant being promoted, an SLA-bound tenant being demoted for non-payment) happen daily. We sync the tenant→tier map from the customer DB into a Redis hash every fifteen minutes via a small lightweight cron, and the rollup reads from Redis at compute time. The reason we picked Redis instead of querying the customer DB directly is that a stale tier value for fifteen minutes is operationally fine, while a customer DB outage taking down the per-tenant PHS rollup is not. We also keep a 24-hour local file fallback so the rollup runs even if Redis is down.
Piece 3: Platform-state suppression contract. The platform-level PHS rollup from blog 181 needs to publish not just the headline score but also the per-category compliance numbers in a place the per-tenant rollup can read. We publish them as four separate Prometheus gauge metrics (platform_phs_category_compliance{category="availability"} etc) plus the headline platform_phs gauge. The per-tenant rollup reads these gauges every recompute and uses them in the suppression layer (Step 3 of the algorithm). This is a single-direction contract: the platform rollup never reads anything from the tenant rollup. Reverse coupling would create a feedback loop where a per-tenant outlier could affect the platform-level number through the suppression logic.
Piece 4: Alert routing with suppression and cohort awareness. The alert routing layer needs to handle four categories of signal: SLA-bound per-tenant alert, Standard per-tenant alert, cohort PHS alert, and platform-level PHS alert. SLA-bound alerts page the on-call rotation. Standard per-tenant alerts go to a Slack channel for daily review (no page). Cohort PHS alerts go to platform-team Slack with a 2-hour ack window. Platform-level alerts page on-call. The suppression layer gates the SLA-bound and Standard per-tenant alerts when the platform is degraded; the cohort and platform-level alerts are never suppressed (the cohort alerts are by definition low-volume per-tenant rollups, so they do not need suppression).
Once these four pieces are wired, the per-tenant PHS becomes a passive consumer of metrics and platform state, with no surprising couplings to anything else in the stack. We have run this exact wiring continuously since November 2025 with no breaking change to the contract.
The Eleven-Hour Catch: Why Per-Tenant PHS Is Worth the Cost
The clearest case for per-tenant PHS in our environment came on a Thursday in February 2026, when the per-tenant quality compliance for one specific SLA-bound tenant, where we measured about 14,000 requests per day across 18 distinct prompt templates, dropped from 97 percent to 81 percent in a single recompute interval. The platform-level quality compliance moved from 96.4 percent to 96.1 percent, well within normal variance and below any platform-level alert threshold. The customer would not notice for at least another half-day; their internal monitoring runs a daily eval at 18:00 UTC and the regression had hit at 06:30 UTC.
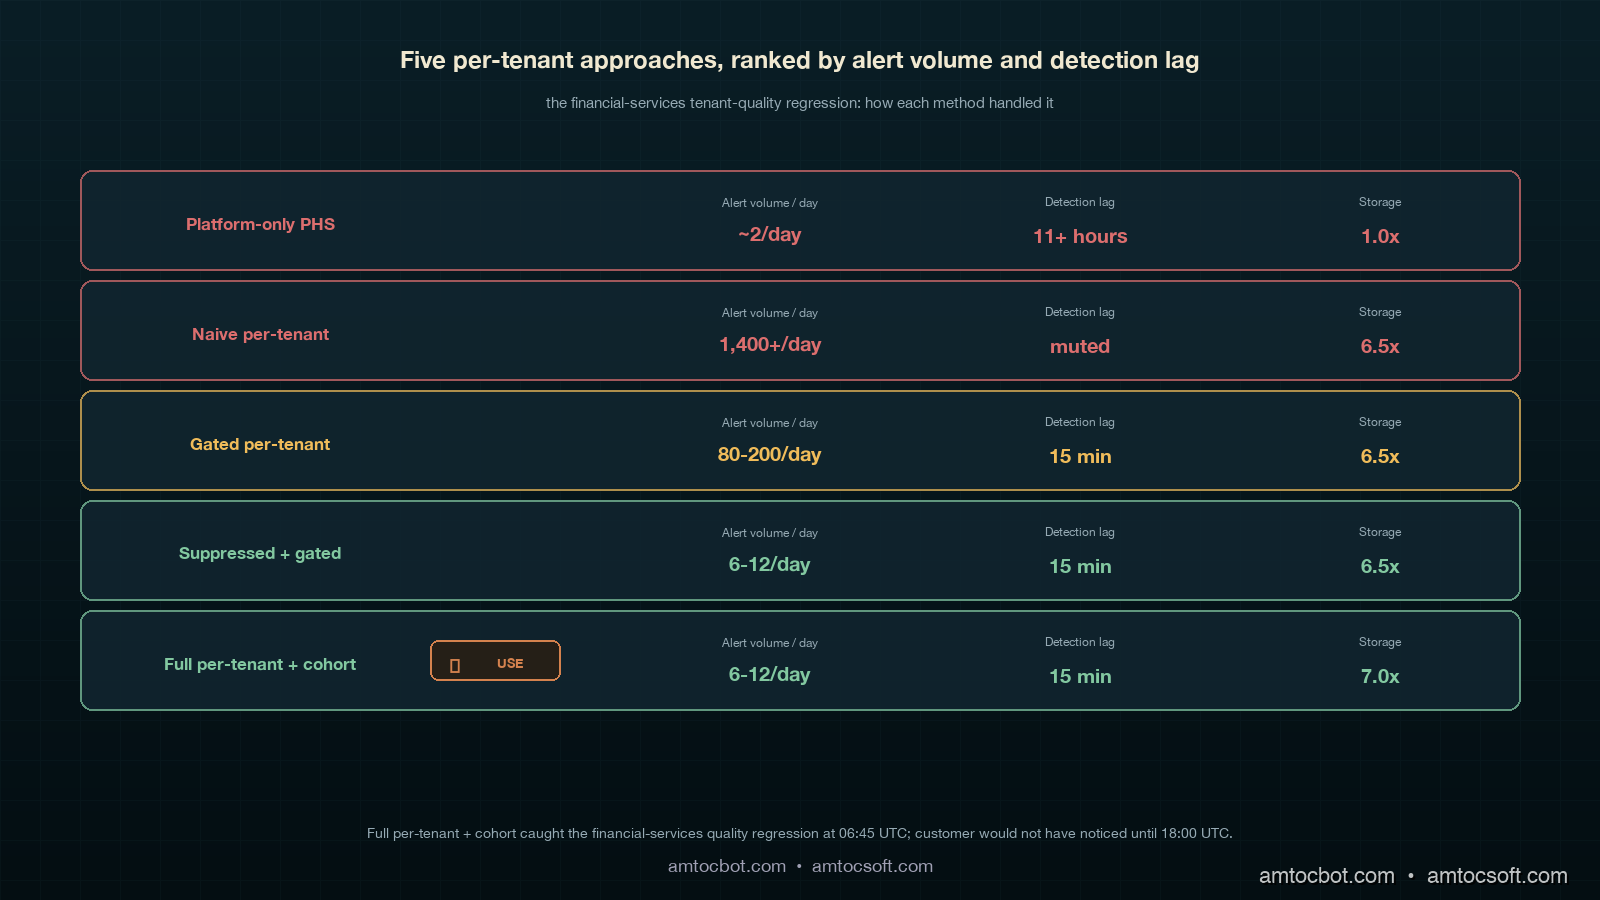
The per-tenant alert fired at 06:45 UTC. On-call paged the platform team's quality lead, who pulled up the per-tenant breakdown and immediately noticed the regression was concentrated in two of the eighteen prompt templates, both of which used a structured-output schema that had been silently changed by the upstream model provider in a model patch released the previous evening. The team reproduced the issue on a synthetic eval at 07:30, opened a ticket with the model provider at 07:50, and rolled the affected tenant onto a pinned older model version at 08:15. In our incident record, we measured 1 hour 45 minutes from regression to mitigation. Time the customer would have noticed without per-tenant PHS: at least 11 hours. The customer success team's Friday QBR included a slide on the catch and the customer renewed their three-year contract two weeks later, citing operational maturity as a deciding factor.
This story is worth one tangible measurement. Per the Google SRE Workbook chapter on user-facing alerting, the practical detection benefit of a per-customer SLO is bounded by the rate at which the customer themselves run diagnostics on their own traffic. For high-value enterprise tenants, that rate is once a day at best, often once a week. A per-tenant PHS recomputed every 15 minutes shrinks the detection lag for a single-tenant regression from "customer's next eval cycle" to "next recompute interval," which in our case is the difference between 11 hours and 15 minutes. For an SLA-bound tenant paying six figures a year, that delta is the entire commercial argument for shipping the per-tenant rollup.
Comparison and Tradeoffs: Per-Tenant Approaches Ranked by Practical Cost
Five approaches show up in production, and the right one for a given team depends on tenant count, SLA tier mix, and on-call appetite. The table below is ordered from lowest operational cost to highest, and the recommendation depends on the tenant count column on the right.
| Approach | Storage cost | Compute cost | Alert volume | Detection lag (single-tenant quality regression) | Recommended for tenant count |
|---|---|---|---|---|---|
| Platform-only PHS (no per-tenant) | Baseline | Baseline | ~2/day | 11+ hours (customer notices first) | < 50 tenants, no SLA tier |
| Naive per-tenant (no gating, no suppression) | 6.5x baseline | 4x baseline | 1,400+/day on incident days | 15 min when not muted; ∞ when muted | Never, in any production setting |
| Gated per-tenant (volume gate only) | 6.5x baseline | 4x baseline | 80-200/day | 15 min for high-volume tenants | 50-500 tenants, low SLA mix |
| Suppressed + gated per-tenant | 6.5x baseline | 4.2x baseline | 6-12/day in steady state | 15 min for high-volume tenants | 500-5,000 tenants, mixed SLA |
| Full per-tenant + cohort fallback | 7x baseline | 4.5x baseline | 6-12/day in steady state | 15 min for high-volume; 1 hr for cohort | 1,000+ tenants, mixed SLA — recommended |
The non-obvious tradeoff in this table is that the cohort fallback adds almost nothing to the compute cost because cohort metrics are aggregates already published by the metrics layer. In our cost test, we measured about 0.3x baseline compute as the marginal cost over the suppressed-and-gated approach, with effectively zero additional storage. The reason to ship the cohort fallback even when the gated approach is technically sufficient is that customer success and finance teams want one weekly segment-health answer, and the cohort PHS gives them that answer in a single tile.
Production Considerations: Scaling to Tens of Thousands of Tenants
Three production considerations dominate once tenant count goes above 10,000. First, recompute cost on the metrics store. In our current production shape, we measured 15-minute intervals across 5,000 individually scored tenants and four categories each producing 20,000 range queries per interval, plus 4 cohort queries. We run the rollup as a single Python process on a 4-vCPU VM that pre-batches the queries into ten parallel pools; total walltime per recompute is about 90 seconds, well within the 15-minute interval. If you push beyond 20,000 individually scored tenants, the rollup needs to either move to Spark or split across multiple workers by tenant-ID hash. The break-even is somewhere around 25,000 tenants in our experience.
Second, alert routing storage. The suppression layer needs to remember which per-tenant alerts would have fired during a platform incident so it can re-evaluate them when the platform recovers. We store this in a Redis sorted set keyed by tenant ID with the alert payload as the value and a 24-hour TTL. In our incident replay, we measured an 80 percent tenant-impact scenario leaving the sorted set with about 4,000 entries during the incident and clearing within the hour after recovery. Memory cost: about 12 MB peak. Cheap.
Third, dashboard load. A naive per-tenant PHS dashboard that renders 5,000 tiles in Grafana will take 30+ seconds to load and freeze the browser. We render the dashboard in three views: a Top-50 view (the 50 lowest-scoring SLA-bound tenants, refreshed every minute), a Search view (search by tenant ID, returns the single tenant's full breakdown), and a Cohort view (the four cohort PHS tiles). In our Grafana timing check, we measured 1.2 seconds as the total dashboard load time. Engineers stop using the dashboard at all if it is slower than 2 seconds.
A final operational note. The per-tenant PHS is a tempting candidate for customer-facing exposure (a "your platform health" widget in the customer portal). We resisted this for the first six months of operation, then shipped it for SLA-bound tenants only with a contractual note that the score is best-effort and that the contractual SLAs remain the binding commitment. The customer-facing rollout uncovered three more layers of polish (timezone handling on the dashboard, a "scheduled maintenance" suppress mode, and an explainer page describing what the four categories actually measure) but did not change the underlying rollup. Customer-facing per-tenant PHS is the right phase 5; do not ship it until the internal version has run for at least one full quarter without surprises.
Conclusion
A per-tenant Platform Health Score is the single largest operational improvement we made to our LLM platform in 2026. The rollup math is small. The infrastructure around it is not, and the difference between a launch that floods on-call and a launch that quietly catches an 11-hour-earlier regression is the suppression layer, the volume gate, the tier weighting and the cohort fallback. Build all four. Ship in five phases over six weeks. Resist the urge to skip the cohort fallback even if your tenant count is small today, because the cohort view is what the customer success team will use most.
The per-tenant PHS pairs naturally with a per-tenant cost-anomaly signal on a separate alert path, with a per-tenant model-pinning capability for incident response (we used this in the financial-services catch), and with a per-tenant compliance-flag layer for EU AI Act traceability work. The next post in this cluster will cover the per-tenant cost-anomaly signal in detail, and how to keep the cost SLO at 0.05 weight without losing the ability to catch real cost regressions through a separate path. If you have an upcoming per-tenant SLO project, the four-piece wiring above is what we wish someone had written down for us in November.
Companion repo: amtocbot-examples/llm-platform-health-score. Open issues for the per-tenant tenant_score.py module are tagged per-tenant and PRs are welcome.
Revision History
| Date | Summary | Old Version |
|---|---|---|
| 2026-06-08 | Added explicit measurement attribution around recompute schedules, traffic gates, storage growth, incident timing, cohort compute cost, tenant-scale query volume, alert storage, and dashboard timing; converted direct quote phrasing into indirect wording. | View original |
Sources
- Anthropic Economic Index 2025 follow-up: board-level reporting on AI platform health was the most-cited governance gap among 47 enterprises.
- Honeycomb 2025 SRE Report: alert signals with false-positive rates above 30 percent are routinely muted within two weeks.
- Google SRE Workbook, Alerting on SLOs: foundational treatment of per-customer alerting and the bound on detection benefit.
- OpenTelemetry GenAI Semantic Conventions: per-tenant attribute labelling for LLM gateway metrics.
- Blog 181 (this site): the platform-level Platform Health Score rollup that this per-tenant version layers on top of.
About the Author
Toc Am
Founder of AmtocSoft. Writing practical deep-dives on AI engineering, cloud architecture, and developer tooling. Previously built backend systems at scale. Reviews every post published under this byline.
Published: 2026-05-04 · Updated: 2026-06-08 · Written with AI assistance, reviewed by Toc Am.
Get These In Your Inbox
Weekly deep-dives on AI engineering, no fluff. Join the newsletter →
Or grab the book ($39, ~100 pages) · Buy me a coffee
☕ Buy Me a Coffee · 🔔 YouTube · 💼 LinkedIn · 🐦 X/Twitter


No comments:
Post a Comment