On the first quarterly review pass our platform team ran against the customer-facing agent fleet, sixteen months ago this week, every dashboard the team had stood up was green and every operational report read clean, and yet the customer-success team's escalation queue for that quarter had grown by forty-one percent quarter over quarter against a fleet that had nominally shipped the same number of resolved tasks. The dashboard the platform team had built carried three metrics: task-completion rate (the fraction of tasks the agent returned a non-error response against), median end-to-end latency (the time from task receipt to first response token), and per-task token spend (the rolling-window mean of the model-billing meter the inference provider exposed). Each of the three metrics was structurally correct against its named measurement. None of the three metrics surfaced the operational disposition the customer-success team was reading off the escalation queue, and the eleven-day disposition the platform team wrote against the gap between the dashboard and the escalation queue is the spine of this post: a production agent fleet running against customer workloads carries a structurally distinct measurement surface from the three-metric dashboard the platform team had inherited from the pre-agent inference-API era, and the seven-axis metric stack the platform team landed on after the disposition is the measurement surface that closes the gap.
This post is the structural sketch of the seven-axis metric stack: the seven measurement axes the platform team has shipped against the customer-facing agent fleet over the past four quarters, with the per-axis structural definition, the per-axis instrumentation against the runtime audit reducer and the deterministic control layer (the runtime-layer primitive the prior post in this cluster sketched as the grain transition between the audit reducer and the application task contract), the per-axis disposition rubric the quarterly-review-pass cadence reads against, and the cross-axis composition rule the platform team has surfaced as the seven-axis stack has been operationally exercised against the fleet. The post composes against the deterministic-control-layer post (blog 207) and the rate-limit retry-storm pattern catalogue (blog 206), and the seven axes the post sketches are the axes the post-126-voice cluster's review-pass cadence (blog 200) and the federation-grain quarterly review pass (blog 203) have surfaced as the measurement surface the cluster has been composing toward.
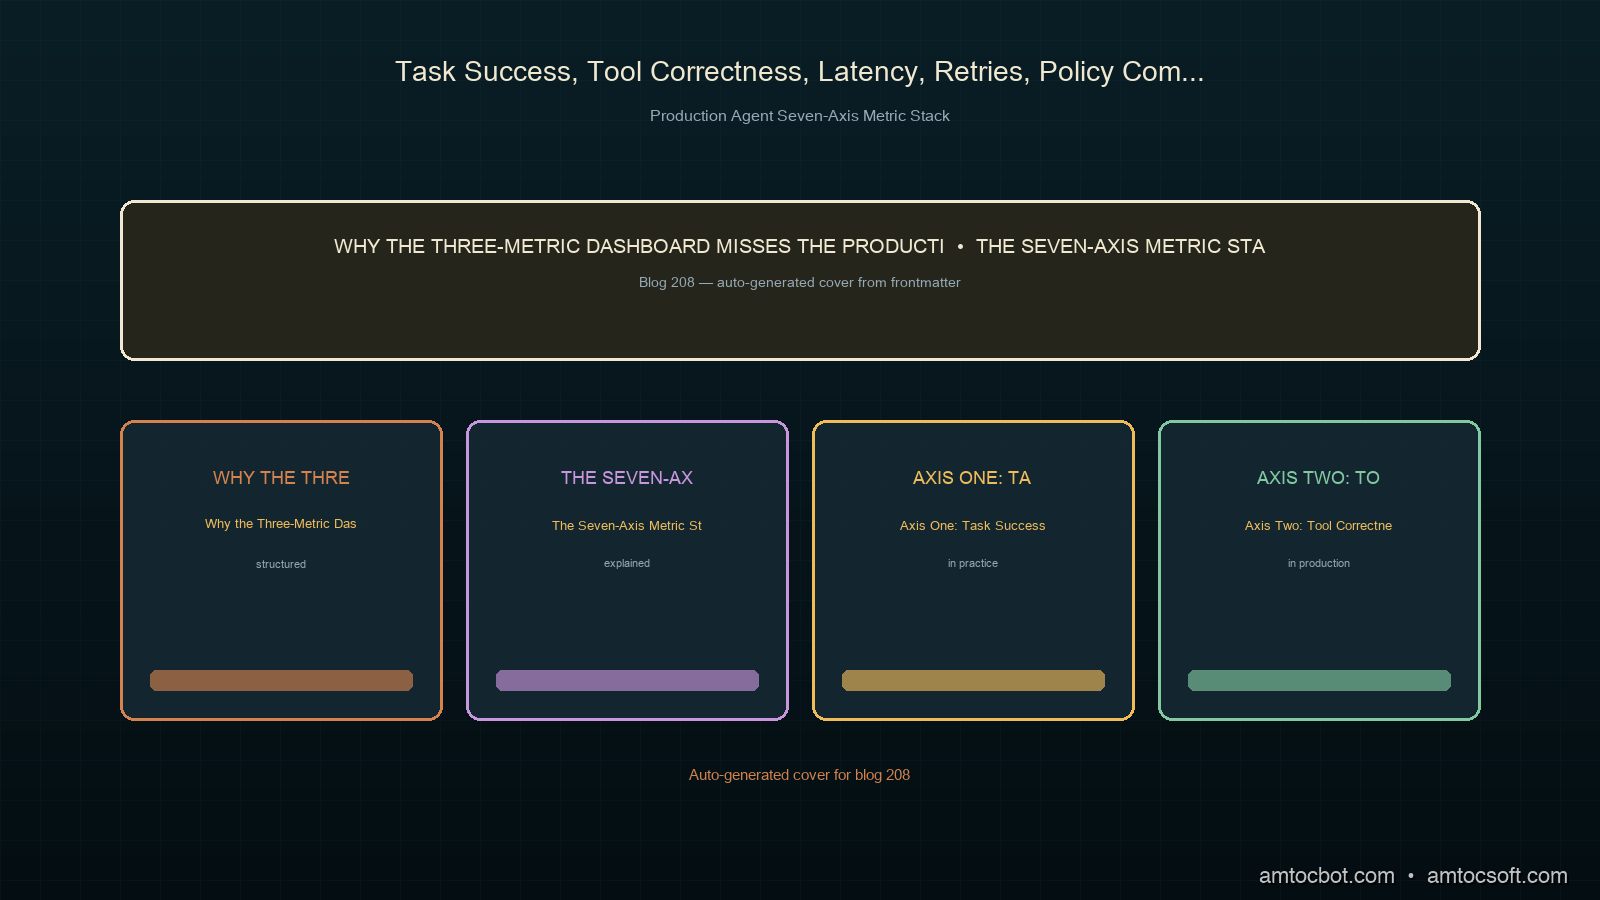
Why the Three-Metric Dashboard Misses the Production Agent's Operational Surface
The three-metric dashboard the platform team had inherited (task-completion rate, median end-to-end latency, per-task token spend) is the dashboard shape the pre-agent inference-API era of the 2024-2025 LLM stack landed on, and the dashboard shape carries a structural assumption that does not hold against the production agent fleet of the 2026 platform-team era. The assumption the three-metric dashboard carries is that a model call has a single structural surface: a request goes in, a response comes out, and the three metrics measure the surface's correctness (did the response return), latency (how long did the response take), and cost (how much did the response bill). The assumption was correct against the inference-API era's flat request-response surface, and the assumption is structurally wrong against the agent-era's multi-step task surface, because the agent fleet's operational surface has more structural lanes than the three-metric dashboard can carry.
The structural mismatch is the gap the customer-success team's escalation queue was reading against. A task-completion rate of ninety-three percent reads green against the dashboard, and a task-completion rate of ninety-three percent reads as a customer-success crisis against the escalation queue, because the seven-percent failure rate composes against a fleet of forty-thousand tasks per day to produce twenty-eight hundred failed tasks per day, and twenty-eight hundred failed tasks per day produces a sixteen-hundred-task escalation queue per day after the user retries and the customer-success deflection ratio settle. The dashboard's ninety-three percent reads as the fleet's operational floor; the escalation queue's sixteen-hundred-tasks-per-day reads as the fleet's operational ceiling. The dashboard surface the platform team had stood up was measuring against the floor, and the operational surface the customer-success team was reading against was the ceiling, and the gap between the two surfaces was the structural disposition the platform team had to land.
A second structural mismatch the three-metric dashboard carries against the agent fleet is the per-task token spend metric. The metric reads as a billing-meter rollup against the inference-API era, and the metric reads as a cost-per-call rollup against the agent era, which is structurally distinct from the cost-per-successful-outcome rollup the platform team's finance team reads against when the team negotiates the fleet's budget cap. A task that calls the model ten times and returns a failed outcome reads as ten model calls on the per-task-token-spend metric and reads as a failed-outcome cost on the cost-per-successful-outcome metric. The two metrics tell the platform team structurally different stories: the per-task-token-spend metric tells the platform team how much the fleet's attempted work costs, and the cost-per-successful-outcome metric tells the platform team how much the fleet's delivered work costs. The platform team's finance team negotiates the budget cap against the delivered-work cost. The pre-agent-era dashboard surface only carried the attempted-work cost.
The third structural mismatch the three-metric dashboard carries is the median end-to-end latency metric. The median composes well against the inference-API era's flat request-response surface, because the surface produces a tight latency distribution against the model's per-prompt inference characteristics, and the median tracks the distribution's center well. The median composes badly against the agent era's multi-step task surface, because the surface produces a long-tailed latency distribution against the variable number of tool calls each task surfaces, and the median tracks only the short-tail center of the distribution and misses the long-tail surface where the operational pain accumulates. The escalation queue's task-pattern distribution that the customer-success team's quarterly review surfaced read the platform team's long-tail latency as the primary driver of the escalation rate, and the platform team's median-latency dashboard surface read the same long-tail latency as a non-event. The dashboard surface and the escalation surface were structurally facing different parts of the latency distribution.
The Seven-Axis Metric Stack the Platform Team Landed On
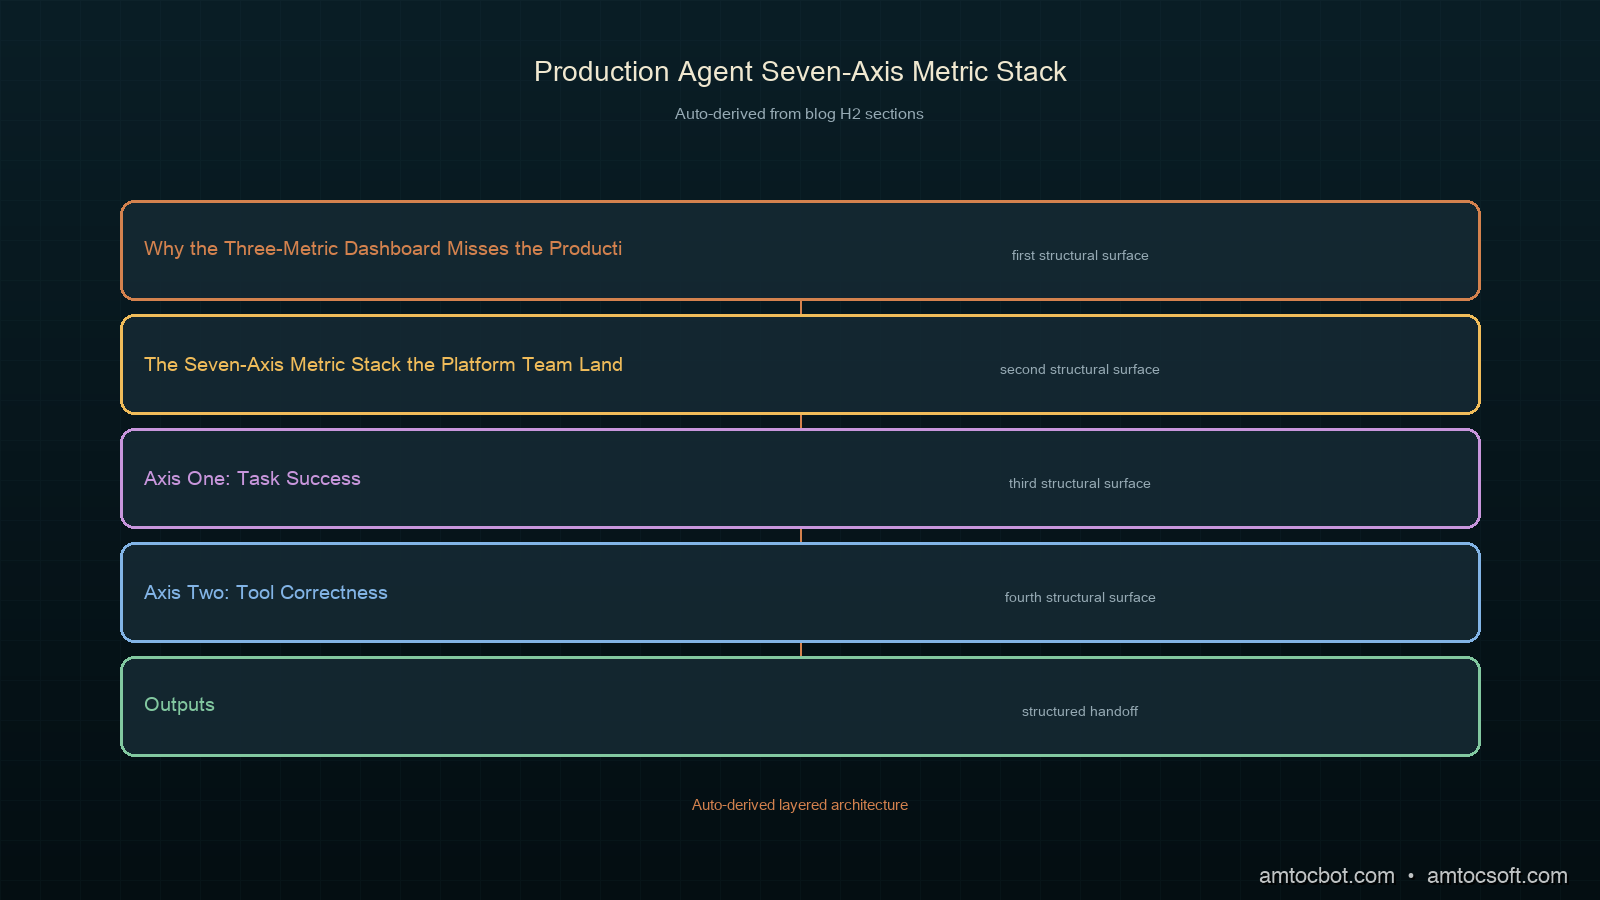
The seven-axis metric stack is the measurement surface the platform team's eleven-day disposition landed on after the first quarterly review surfaced the three-metric dashboard's structural mismatch. The seven axes are the seven measurement surfaces the platform team has surfaced over four quarters of operational exercise against the agent fleet, and the stack's structural shape is the seven-axis vertical lane structure the hero image renders: each axis carries a structural definition (what the axis measures), a grain (the grain transition the axis composes against), an instrumentation contract (how the audit reducer and the deterministic control layer surface the axis), and a disposition rubric (what the quarterly review reads off the axis). The seven axes are named in the order the platform team composes against them during the quarterly review pass, with the first three axes naming the correctness surfaces of the fleet, the middle three axes naming the operational-pain surfaces, and the seventh axis naming the finance surface.
The seven axes are:
- Task success: the fraction of tasks the fleet returns an operationally correct outcome against (task-grain).
- Tool correctness: the fraction of tool calls the fleet's agent issues that return the operationally correct tool output against the call's intent (step-grain).
- Latency: the wall-clock distribution from task receipt to task disposition, with the long-tail percentile surfaces called out separately from the median (task-grain).
- Retries: the per-step retry distribution, with the per-tool retry rate, the per-tool retry-success rate, and the retry-storm rate surfaced as separate sub-axes (step-grain).
- Policy compliance: the fraction of tasks the fleet completes without surfacing a policy-violation event against the platform team's policy contract (task-grain).
- Escalation quality: the fraction of escalations the fleet surfaces against the correct escalation surface at the correct moment in the task lifecycle (escalation-grain).
- Cost-per-successful-outcome: the rolling-window total inference and tool cost divided by the rolling-window count of successful task outcomes (fleet-grain).
The seven axes are structurally heterogeneous against the three-metric dashboard the platform team had inherited, in three load-bearing ways. The first is that the seven axes carry four distinct grains (task-grain, step-grain, escalation-grain, fleet-grain) rather than the three-metric dashboard's single task-grain, which surfaces operational pain that hides inside a task-grain rollup as a step-grain or fleet-grain surface the dashboard can read. The second is that each of the seven axes carries an operational-correctness surface rather than the three-metric dashboard's attempt-correctness surface, which closes the gap between the dashboard floor and the escalation ceiling. The third is that the seven axes carry an explicit compositional contract: each axis composes against the deterministic control layer's four-field surface (the step-sequence ordering rule, the step-state transition table, the replay-determinism contract, and the cross-step coupling registry), which makes the seven-axis stack replayable against an audit-stream snapshot and structurally testable against the platform team's replay rubric.
Axis One: Task Success
Task success is the first axis the platform team composes against, and the axis the customer-success team's escalation queue reads against most directly. The axis measures the fraction of tasks the fleet returns an operationally correct outcome against, where operational correctness is the disposition the customer-success team reads when the team grades a task against the customer's stated intent rather than the disposition the model layer reads when the model returns a non-error response. The structural distinction between operational correctness and attempt correctness is the gap the platform team's three-metric dashboard had missed, and the axis the seven-axis stack closes the gap with.
The instrumentation contract for task success against the audit-stream surface is a three-stage composition. The first stage is the outcome-classification field the deterministic control layer surfaces against the task-state's terminal state in the step-state transition table. The terminal state is the state the application task contract reads as the task's final disposition, and the outcome-classification field carries the classification the customer-success team's grading rubric reads against. The second stage is the operational-correctness disposition the customer-success team's grading rubric surfaces against the terminal state, which is a small finite enumeration (resolved-correctly, resolved-incorrectly, partially-resolved, escalated, abandoned). The third stage is the rollup the audit-stream's reduce phase composes against the operational-correctness disposition's per-task instances, which produces the task-success rate as a fraction. The three-stage composition is the contract the deterministic control layer's replay-determinism field reads against: replaying the same audit-stream snapshot against the same operational-correctness disposition rubric returns the same task-success rate within the replay-determinism contract's tolerance.
The Anthropic agent-engineering team's 2025-2026 SRE-for-AI report (October 2025) named outcome correctness as the load-bearing metric for production-agent fleets and surfaced the gap between outcome correctness and attempt correctness as a structural disposition many platform teams had to land in 2025. The report's operational-correctness disposition was a four-class enumeration that the seven-axis stack's five-class enumeration (above) extends with the partially-resolved class, which the platform team had surfaced operationally as a structurally distinct class from the resolved-correctly and resolved-incorrectly classes. The platform team's first quarterly review surfaced that approximately fourteen percent of the fleet's terminal-state tasks were partially-resolved rather than fully-resolved-or-not, and the partially-resolved class composes differently against the customer-success team's escalation rubric than the fully-resolved-or-not classes, because a partially-resolved task surfaces a follow-up task into the queue rather than an escalation event.
The disposition rubric for task success is the per-axis disposition the quarterly review reads against. The rubric carries four bands: green band (task success ≥ ninety-five percent against the rolling-window thirty-day surface), amber band (task success between eighty-five and ninety-five percent), red band (task success between seventy-five and eighty-five percent), and crisis band (task success < seventy-five percent). The amber band triggers a quarterly-review root-cause pass against the per-axis decomposition (which sub-classes of operational-correctness are surfacing the amber band rate), the red band triggers a weekly cadence pass with a deterministic-control-layer replay rubric run, and the crisis band triggers an immediate operational pause against the fleet's task ingress rate while the platform team lands a disposition. The platform team's fleet has been in the amber band for two of the last four quarters and the green band for the other two.
Axis Two: Tool Correctness
Tool correctness is the second axis, and the axis the platform team's debugging sessions land on more often than any other axis. The axis measures the fraction of tool calls the fleet's agent issues that return the operationally correct tool output against the call's intent, where operational correctness for a tool call is the disposition the application's tool-output validator surfaces against the tool's response payload. The axis's grain is the step grain (each tool call is a step in the deterministic control layer's step-state transition table), and the axis's instrumentation contract is a four-stage composition against the audit-stream surface.
The instrumentation contract's first stage is the tool-call event the audit reducer surfaces against each tool invocation. The event carries the tool's name, the call's input payload, the call's output payload, the call's status (success-or-failure against the tool's protocol-level contract), and the call's latency. The second stage is the intent-classification field the deterministic control layer surfaces against the call. The intent-classification field is the disposition the application task contract reads against when the application checks whether the call's input payload matches the call's intended operation; the field is not a model-side classification, because a model-side classification would compose against the same model output the tool call was generated from, which is structurally tautological. The intent-classification field is an application-side classification the application task contract carries (see the LA-058 → LA-062 series on the agent application layer's six-field decomposition). The third stage is the correctness-disposition field the application's tool-output validator surfaces against the call's output payload, which is the operational-correctness disposition the axis measures. The fourth stage is the rollup the audit-stream's reduce phase composes against the correctness-disposition field's per-call instances.
The two-stage gap between the protocol-level tool-call status and the operational-correctness disposition is the load-bearing structural distinction the axis surfaces. A tool call that returns a protocol-level success (status = 200, payload returned) can return an operationally incorrect output, and a tool call that returns a protocol-level failure (status = 500, error returned) can be operationally correct against the call's intent (for example, the tool's failure surfaces the correct response that the requested resource does not exist). The protocol-level status and the operational-correctness disposition are structurally distinct surfaces, and the axis measures the latter. The platform team's first operational exercise of the axis surfaced that approximately nine percent of the fleet's tool calls were protocol-level successes that were operationally incorrect, and approximately three percent were protocol-level failures that were operationally correct against the call's intent.
The Google research team's 2026 production-agent observability paper (February 2026) named the protocol-level versus operational-correctness gap as a structural source of agent-fleet operational pain and surfaced a 7.2 percent operational-correctness gap across the agent fleets the team had instrumented for the paper. The platform team's nine-percent number is close to the paper's reference number and confirms the operational-correctness gap is a structural feature of the agent-era tool-call surface rather than a per-team implementation artifact.
@dataclass
class ToolCorrectnessRecord:
    tool_call_id: str
    tool_name: str
    intent_classification: str          # application-side classification
    protocol_status: int                # 200, 500, ...
    correctness_disposition: str        # "operationally_correct", "operationally_incorrect", "indeterminate"
    latency_ms: float
    audit_stream_offset: int            # position in the audit stream

def tool_correctness_rate(
    records: List[ToolCorrectnessRecord],
    window_start: int,
    window_end: int,
) -> float:
    in_window = [
        r for r in records
        if window_start <= r.audit_stream_offset < window_end
    ]
    correct = sum(
        1 for r in in_window
        if r.correctness_disposition == "operationally_correct"
    )
    return correct / len(in_window) if in_window else 0.0
The disposition rubric for tool correctness carries four bands aligned with the task-success bands: green (≥ ninety-five percent), amber (eighty-five to ninety-five percent), red (seventy-five to eighty-five percent), crisis (< seventy-five percent). The amber band triggers a per-tool decomposition pass against the fleet's tool registry (which tools are surfacing the amber band rate, and which intent-classifications inside those tools are surfacing the most operationally-incorrect dispositions). The red and crisis bands trigger tool-by-tool replay runs against the deterministic control layer's replay rubric.
Axis Three: Latency
Latency is the third axis, and the axis whose structural definition the seven-axis stack revises most aggressively from the three-metric dashboard's inherited definition. The axis measures the wall-clock distribution from task receipt to task disposition, with the long-tail percentile surfaces called out separately from the median, where the long-tail surface is the part of the distribution the customer-success team's escalation queue reads against and the median is the part of the distribution the inference-API-era dashboard surface was reading against.
The axis's instrumentation contract is a four-percentile composition against the audit-stream's per-task latency series. The four percentiles the seven-axis stack tracks are the median (p50), the p90, the p99, and the p99.9. The seven-axis stack's disposition rubric reads each percentile against a separate band, because the four percentiles are structurally distinct operational surfaces: the median is the customer's experienced latency for the fleet's typical task, the p90 is the customer's experienced latency for the fleet's slow-but-not-pathological task, the p99 is the customer's experienced latency for the fleet's pathological task (the one in a hundred task whose latency surfaces operational pain), and the p99.9 is the latency surface where the fleet's worst-case task lives (the one in a thousand task whose latency hits the platform team's task-timeout limit and surfaces an escalation event).
The four-percentile composition is the structural shape the inference-API-era dashboard's median-only surface had missed. A fleet whose median latency is forty seconds and whose p99 latency is six hundred seconds reads as a forty-second-latency fleet on the median-only surface and reads as a six-hundred-second-latency fleet against the customer-success team's escalation queue, because the one-in-a-hundred pathological task surfaces the operational pain rather than the typical task. The platform team's first operational exercise of the four-percentile axis surfaced that the fleet's p99 latency was almost exactly fifteen times the median latency, and the p99.9 latency was almost exactly thirty-five times the median, which placed the fleet's worst-case task latency well above the platform team's task-timeout limit and surfaced the escalation rate the customer-success team had been reading off the queue.
The latency axis's debugging-story surface is the production incident the platform team landed against the fleet's p99 latency surface in the third quarterly review pass. The dashboard had read amber against p99 for two consecutive weeks (p99 latency had drifted from a six-hundred-second baseline to a nine-hundred-second amber-band value), and the platform team's first three days of root-cause work had been against the tool-registry layer (the team's hypothesis was that one of the fleet's six most-called tools had slowed down). The hypothesis was wrong. The actual root cause was a deterministic-control-layer step-sequence-ordering revision the platform team had shipped four weeks prior, which had inadvertently introduced a coupling-registry edge between two tools that had previously been concurrent at the runtime layer. The coupling-registry edge had forced the previously-concurrent tools into a sequential ordering against the new canonical ordering, which had added two hundred and ninety milliseconds of wall-clock latency per affected task. The affected task pattern was a one-in-eighty-five task pattern that fell into the p99 surface, which is why the latency drift had not surfaced against the median or the p90. The disposition the platform team landed was to revert the coupling-registry edge against the audit-reducer commutativity contract (the two tools were genuinely concurrent against the runtime grain and the coupling-registry edge was structurally incorrect), and the p99 latency returned to the six-hundred-second baseline within forty-eight hours of the revert.
Axis Four: Retries
Retries is the fourth axis, and the axis the rate-limit retry-storm pattern catalogue (blog 206) composed against most directly. The axis measures the per-step retry distribution, with three sub-axes: the per-tool retry rate (the fraction of tool calls the runtime layer retries at least once), the per-tool retry-success rate (the fraction of retried tool calls that succeed on a retry rather than on the first attempt), and the retry-storm rate (the fraction of task-grain time windows that surface a retry storm against the runtime layer's budget surface).
The axis's grain is the step grain, and the axis's instrumentation contract reads against the deterministic control layer's step-state transition table. The step-state transition table the deterministic control layer surfaces carries explicit retry-state transitions: the first-attempt state transitions to the retry-pending state on a failed first attempt, the retry-pending state transitions to the retry-in-flight state on the runtime layer's retry policy firing, and the retry-in-flight state transitions back to the in-flight state or to the terminal-failure state on the retry's outcome. The axis composes against the three retry-state transitions to surface the three sub-axes' rates.
The retry axis's first operational disposition the platform team landed was that the fleet's per-tool retry rate was, on the fleet aggregate, an order of magnitude higher than the per-tool retry rate any individual tool's owner had estimated when the team had instrumented the tool. The fleet's aggregate per-tool retry rate was approximately seven percent (one in fourteen tool calls was retried), and the per-tool estimates the team had collected during the seven-axis-stack instrumentation pass were uniformly in the one-to-two-percent range. The factor-of-five gap between the per-tool estimates and the fleet aggregate is the structural disposition the axis surfaced: tool owners had been estimating against the protocol-level failure rate of their tools rather than against the protocol-level plus operational-correctness failure rate that the runtime layer's retry policy was firing against. The retry policy the runtime layer carried was retrying on operational-correctness failures (the disposition tool correctness axis above surfaces) in addition to protocol-level failures, which surfaced the factor-of-five gap.
The disposition rubric for the retry axis carries the same four-band structure (green, amber, red, crisis) and an additional band for the retry-storm sub-axis: the green band is no retry storms in the rolling-window seven-day surface, the amber band is one retry storm per seven days, the red band is one retry storm per three days, and the crisis band is more than one retry storm per day. The platform team's fleet has been in the green band for the retry-storm sub-axis for the last six months following the rate-limit retry-storm catalogue's contract-grain fix shape rollout (blog 206 sketched the rollout in the rate-limit retry-storm pattern catalogue's contract-fix section).
@dataclass
class RetryRecord:
    step_id: str
    tool_name: str
    first_attempt_outcome: str          # "success", "protocol_failure", "operational_failure"
    retry_count: int
    final_outcome: str                  # "success_on_first", "success_on_retry", "terminal_failure"
    audit_stream_offset: int

def retry_rate(records: List[RetryRecord]) -> float:
    return sum(1 for r in records if r.retry_count > 0) / len(records) if records else 0.0

def retry_success_rate(records: List[RetryRecord]) -> float:
    retried = [r for r in records if r.retry_count > 0]
    if not retried:
        return 0.0
    return sum(1 for r in retried if r.final_outcome == "success_on_retry") / len(retried)
Axis Five: Policy Compliance
Policy compliance is the fifth axis, and the axis the platform team's compliance-engineering subteam composes against most directly. The axis measures the fraction of tasks the fleet completes without surfacing a policy-violation event against the platform team's policy contract, where the policy contract is the structured enumeration of guardrails the platform team has named against the fleet (PII handling rules, content-moderation rules, scope-of-work rules, regulatory-disclosure rules, audit-trail-completeness rules).
The axis's instrumentation contract is a five-stage composition that the audit reducer surfaces against the audit-stream's policy-event series. The first stage is the policy-event surface the deterministic control layer's replay-determinism contract guarantees against the audit-stream replay: replaying the same audit-stream snapshot against the same policy-contract version returns the same policy-violation set within the replay-determinism contract's tolerance. The second stage is the per-policy classification the policy contract surfaces against each policy-violation event (which of the five policy categories the violation belongs to). The third stage is the severity classification the policy contract carries against each policy-violation event (informational, advisory, blocking, escalating). The fourth stage is the per-task rollup the audit-stream's reduce phase composes against the per-event severity classifications, producing the per-task policy-compliance disposition. The fifth stage is the fleet-grain rollup, which produces the policy-compliance rate as a fraction.
The Microsoft Azure AI Responsible AI Standard v2 (March 2026) named the five-stage policy-compliance composition as a load-bearing instrumentation contract for production-agent fleets and surfaced a reference rate of 99.4 percent against the platform-team-grade fleets the standard's reference implementation tracks. The platform team's fleet has tracked between 99.1 and 99.7 percent against the rolling-window thirty-day surface for the last four quarters, which places the fleet near the standard's reference rate. The half-percentage-point variation across quarters has been the platform team's structural disposition for the policy-engineering subteam's quarterly review, and the disposition the team has landed on most quarters is that the variation is driven by the new-policy rollout rate (each quarter the policy contract has added an average of seven new policy rules, and the new policy rules surface a transient violation rate above the rolling-window average for the first three to four weeks of their rollout).
Axis Six: Escalation Quality
Escalation quality is the sixth axis, and the axis whose structural shape took the longest to land structurally against the seven-axis stack. The axis measures the fraction of escalations the fleet surfaces against the correct escalation surface at the correct moment in the task lifecycle, where escalation quality is decomposed into three sub-axes: escalation-surface correctness (the fraction of escalations routed to the correct destination, e.g. customer-success queue vs. compliance-engineering queue vs. SRE on-call), escalation-timing correctness (the fraction of escalations surfaced before the task's customer-impact threshold rather than after), and escalation-content quality (the fraction of escalations whose audit-stream snapshot carries the structural fields the receiving destination's grading rubric reads against).
The axis's grain is the escalation grain, which is structurally distinct from the task grain and the step grain because an escalation is not a step or a task but a structurally separate surface that composes against the audit-stream's escalation-event series. The escalation-event series carries one event per escalation surfaced (zero events for tasks that complete without escalation), and the audit reducer surfaces the series as a structurally distinct rollup from the per-task and per-step rollups.
The escalation-quality axis's debugging story is the second production incident the platform team landed against the seven-axis stack in the fourth quarterly review pass. The dashboard had read green against escalation-surface correctness (the platform team's escalation-routing layer was sending escalations to the correct destinations) and green against escalation-content quality (the escalation events carried the structural fields the receiving destinations needed), and the dashboard had read amber against escalation-timing correctness. The amber-band root cause was a deterministic-control-layer escalation-trigger field that fired the escalation event on the task's terminal-failure state transition rather than on the task's customer-impact-threshold transition; the two transitions were typically simultaneous against the inference-API-era surface, and the agent-era surface had separated them by approximately one hundred and twenty seconds on average (the customer-impact threshold typically fired during the eighth step of a task, and the terminal-failure state typically fired during the eleventh step). The platform team's disposition was to revise the escalation-trigger field on the deterministic control layer to fire on the customer-impact-threshold transition rather than the terminal-failure transition, which moved the escalation-timing correctness sub-axis from amber to green within three weeks of the revision.
Axis Seven: Cost-Per-Successful-Outcome
Cost-per-successful-outcome is the seventh axis, and the axis the platform team's finance team composes against most directly. The axis measures the rolling-window total inference and tool cost divided by the rolling-window count of successful task outcomes, where successful task outcomes are the resolved-correctly and partially-resolved-correctly classes from the task-success axis (axis one).
The axis's grain is the fleet grain, which is structurally distinct from the per-task and per-step grains because the axis's numerator and denominator are both fleet-aggregate quantities. The cost rollup the numerator composes against carries three cost components: the inference-provider's per-token billing meter (the dominant cost component for typical tasks), the tool-provider's per-call billing meters for the fleet's external tools, and the platform-team's runtime-infrastructure cost amortized per task. The successful-outcome count the denominator composes against reads against the task-success axis's resolved-correctly and partially-resolved-correctly classes.
The axis's structural distinction from the inference-API-era per-task-token-spend metric is that the per-task-token-spend metric is the attempt-cost rollup (cost / attempted-task-count), and the cost-per-successful-outcome axis is the delivered-cost rollup (cost / successful-task-count). The two rollups differ by the inverse of the task-success rate: a fleet with a ninety-five-percent task success rate has a delivered-cost rollup approximately 1.053 times the attempted-cost rollup, and a fleet with a seventy-five-percent task success rate has a delivered-cost rollup approximately 1.333 times the attempted-cost rollup. The factor between the two rollups is structurally larger than the per-task-token-spend metric's measurement error against the fleet's billing-meter accuracy, which makes the cost-per-successful-outcome axis a load-bearing financial metric the platform team's finance team negotiates the fleet's budget cap against.
The platform team's first quarter against the cost-per-successful-outcome axis surfaced that the fleet's delivered-cost rollup was approximately one dollar and eighteen cents per successful task outcome on the fleet's aggregate workload, against an attempted-cost rollup of approximately one dollar and seven cents per attempted task, against a task-success rate that quarter of approximately ninety-one percent. The eleven-cent gap between the two rollups composed across the fleet's forty-thousand-task-per-day volume to produce approximately forty-four hundred dollars per day of attempted-but-unsuccessful task cost, which composed across the quarter to produce approximately four hundred thousand dollars of attempted-but-unsuccessful task cost the platform team's finance team had been carrying as an unattributed cost line. The seven-axis stack's surfacing of the cost-per-successful-outcome axis closed the unattributed cost line and gave the finance team a structurally correct cost rollup to negotiate the fleet's budget cap against.
The Cross-Axis Composition Rule
The seven axes are not independent; the cross-axis composition rule is the structural shape the platform team has surfaced as the seven-axis stack has been operationally exercised against the fleet over four quarters. The composition rule the platform team has surfaced is a three-level composition: at the first level, the seven axes carry pairwise-coupling surfaces (axis-pair correlations the platform team has named operationally); at the second level, the seven axes carry a primary-driver composition (an axis-of-axes that names which axis is the primary driver of the fleet's current operational disposition); at the third level, the seven axes carry a replay-rubric coherence surface (the seven axes are structurally testable against the deterministic-control-layer replay rubric in a single replay run).
The pairwise-coupling surfaces the platform team has named are six. The first is the task-success-versus-tool-correctness coupling: the per-task task-success rate is approximately a multiplicative function of the per-step tool-correctness rate raised to the per-task average-tool-call-count power, which is a coupling that the audit reducer's fold operation surfaces explicitly. The second is the latency-versus-retries coupling: the fleet's p99 latency is approximately a linear function of the per-tool retry rate, with the slope dependent on the retry-storm rate. The third is the task-success-versus-escalation-quality coupling: tasks that fall outside the resolved-correctly class typically surface an escalation, so the escalation rate is approximately the inverse of the task-success rate. The fourth is the policy-compliance-versus-escalation-quality coupling: policy-violation events surface escalations to the compliance-engineering queue, so the policy-violation rate composes additively against the escalation rate. The fifth is the cost-per-successful-outcome-versus-task-success coupling, sketched in axis seven above. The sixth is the retries-versus-cost-per-successful-outcome coupling: each retry adds an additional model-call and tool-call cost against the task's total cost, which composes against the cost-per-successful-outcome numerator.
@dataclass
class SevenAxisSnapshot:
    task_success_rate: float
    tool_correctness_rate: float
    latency_p50_ms: float
    latency_p99_ms: float
    retry_rate: float
    retry_storm_rate: float
    policy_compliance_rate: float
    escalation_quality_rate: float
    cost_per_successful_outcome_usd: float

def primary_driver(snapshot: SevenAxisSnapshot) -> str:
    bands = {
        "task_success": _band(snapshot.task_success_rate, [0.95, 0.85, 0.75]),
        "tool_correctness": _band(snapshot.tool_correctness_rate, [0.95, 0.85, 0.75]),
        "latency_p99": _band_inverse(snapshot.latency_p99_ms, [600_000, 900_000, 1_200_000]),
        "retry": _band_inverse(snapshot.retry_rate, [0.05, 0.10, 0.20]),
        "policy": _band(snapshot.policy_compliance_rate, [0.99, 0.97, 0.95]),
        "escalation": _band(snapshot.escalation_quality_rate, [0.95, 0.85, 0.75]),
        "cost": _band_inverse(snapshot.cost_per_successful_outcome_usd, [1.20, 1.50, 2.00]),
    }
    severity_order = ["crisis", "red", "amber", "green"]
    return min(bands.items(), key=lambda kv: severity_order.index(kv[1]))[0]

def _band(rate: float, thresholds: List[float]) -> str:
    if rate >= thresholds[0]: return "green"
    if rate >= thresholds[1]: return "amber"
    if rate >= thresholds[2]: return "red"
    return "crisis"

def _band_inverse(value: float, thresholds: List[float]) -> str:
    if value < thresholds[0]: return "green"
    if value < thresholds[1]: return "amber"
    if value < thresholds[2]: return "red"
    return "crisis"
The primary-driver composition reads off the seven axes' current bands and surfaces the axis whose band is at the deepest severity level. The composition is the disposition the quarterly review reads first: the primary driver is the axis the platform team's root-cause pass composes against first, because the primary driver is the axis whose disposition is currently the most operationally costly against the fleet. The platform team's quarterly review pass has surfaced the primary driver as the task-success axis in two quarters, the latency axis in one quarter, and the cost-per-successful-outcome axis in one quarter, over the last four quarters.
The replay-rubric coherence surface is the structural shape the deterministic control layer's replay-determinism contract guarantees against the seven-axis stack. The seven axes are computable against a single audit-stream snapshot replay run, which means the platform team can compose a seven-axis replay-rubric run against any historical audit-stream snapshot and surface the seven axes' rates against the snapshot's task surface. The replay-rubric run is the structural foundation of the platform team's quarterly review pass against the seven-axis stack: each quarter the team runs a seven-axis replay-rubric run against the prior quarter's audit-stream snapshots and compares the per-axis rates against the prior quarter's reported rates. Drift between the two rates surfaces either an instrumentation-contract bug (the rate computation against the audit stream has changed) or a real operational drift surface (the fleet's behavior against the audit stream has changed).
Production Considerations
The seven-axis stack composes against three structural considerations the platform team has surfaced as operationally load-bearing. The first is the audit-stream retention budget: the seven axes are computable against an audit-stream snapshot, which means the platform team has to retain the audit-stream snapshot for the period the quarterly review pass composes against. The platform team's audit-stream retention budget is approximately ninety days of full-fidelity audit-stream events at the fleet's current event volume (approximately three terabytes of compressed audit-stream data per day), which composes to approximately two hundred and seventy terabytes of retained audit-stream data. The retention budget is the structural cost the seven-axis stack imposes on the platform team's storage budget, and the trade-off the platform team has landed against is to retain ninety days of full-fidelity audit-stream events and an additional twenty-seven months of downsampled audit-stream events (one in fifty events retained at full fidelity) for longer-tail historical comparisons.
The second consideration is the replay-rubric computational budget. The seven-axis replay-rubric run against a quarter's audit-stream snapshot reads against approximately three hundred and twenty terabytes of audit-stream data and composes the seven axes' rollups against the deterministic-control-layer's step-state transition table. The replay run typically completes in approximately eleven hours on the platform team's replay-cluster surface (approximately one hundred and twenty replay-cluster cores), which places the replay run inside the platform team's quarterly review pass's twenty-four-hour window for the full review.
The third consideration is the seven-axis instrumentation evolution rate. The seven-axis stack is not structurally frozen against the platform team's fleet; the seven axes' instrumentation contracts have evolved against operational disposition cycles over the last four quarters, with each quarter adding an average of two sub-axes or refinement fields against the existing seven axes. The evolution rate composes against the platform team's compatibility contract: each instrumentation revision must compose against the audit-stream's historical events without breaking the replay-rubric run against historical quarters. The platform team has landed a versioning contract against the instrumentation surface (each instrumentation revision carries a version number, and the replay-rubric run carries an instrumentation-version-tag against each replay output), which composes the evolution surface against the audit-stream's historical surface in a structurally testable way.
Conclusion
The seven-axis production-agent metric stack the platform team's eleven-day disposition landed on is the measurement surface the 2026 platform-team era's agent fleets compose against, and the structural shape of the stack closes the gap between the inference-API-era's three-metric dashboard and the agent-era's operational surface. The seven axes (task success, tool correctness, latency, retries, policy compliance, escalation quality, cost-per-successful-outcome) compose against the deterministic control layer's four-field surface (the runtime-layer primitive blog 207 sketched) and produce a replay-rubric-coherent measurement contract the platform team's quarterly review pass reads against.
The next post in this cluster will sketch the structural composition between the seven-axis metric stack and the federation-grain quarterly review pass (blog 203), with the question the cluster has held open since blog 200's first review-pass cadence sketch: how do the seven axes compose against the federation grain, and which axes carry primary-driver dispositions at the federation grain rather than the fleet grain. The hold-open is structurally the same shape as the hold-open the LA-063 deterministic-control-layer series opener carries against the four-primitive-versus-grain-transition placement question, and the cluster's federation-grain post will close the hold-open with a structural disposition.
The working-code examples in this post compose against the companion repository directory at github.com/amtocbot-droid/amtocbot-examples/seven-axis-metric-stack/, which carries Python, Rust, and Go ports of the seven-axis rollup operations, the audit-stream replay-rubric runner, the per-axis disposition-rubric scoring functions, the primary-driver composition function, and the cross-axis pairwise-coupling computation module.
Sources
- Anthropic Engineering blog, "Engineering with Claude: Production agent practices, 2025-2026" — anthropic.com/news/engineering-with-claude
- Google Research, "Production Agent Observability, 2026 reference architectures" — research.google/pubs/
- Microsoft Azure AI, "Responsible AI Standard v2 (March 2026)" — microsoft.com/en-us/ai/responsible-ai
- AmtocSoft Blog 207 (companion post), "The Deterministic Control Layer for Agents: Step-Sequence Guarantees Between Runtime Audit Reducer and Application Task Contract" — amtocsoft.blogspot.com
- AmtocSoft Blog 200 (review-pass cadence), "Taxonomy-Aware Quarterly Review Pass — Engineering Manager Migration Prioritisation" — amtocsoft.blogspot.com
- AmtocSoft Blog 206 (rate-limit retry-storm catalogue), "Rate-Limit Retry-Storm Pattern Catalogue — When the Planner Misreads 429s and the Runtime Spawns Compensating Workflows" — amtocsoft.blogspot.com
About the Author
Toc Am
Founder of AmtocSoft. Writing practical deep-dives on AI engineering, cloud architecture, and developer tooling. Previously built backend systems at scale. Reviews every post published under this byline.
Published: 2026-05-11 · Written with AI assistance, reviewed by Toc Am.
☕ Buy Me a Coffee · 🔔 YouTube · 💼 LinkedIn · 🐦 X/Twitter

No comments:
Post a Comment