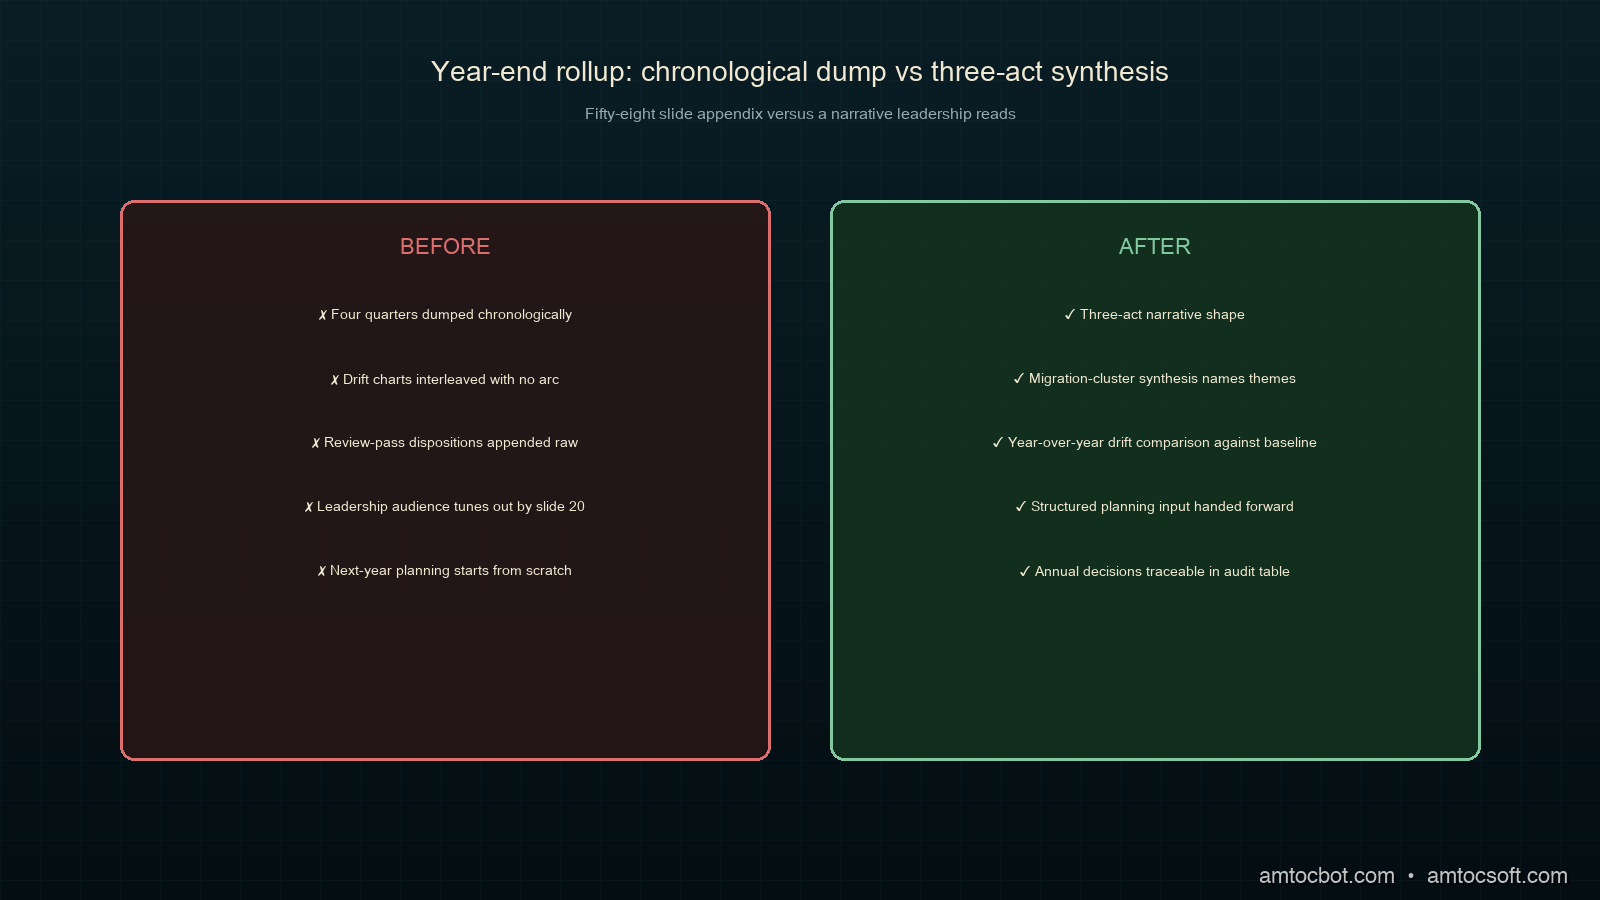
The first time the platform team I work with tried to run an annual taxonomy-evolution rollup at the year-end retrospective, the rollup we produced was a fifty-eight-page slide deck nobody on the platform-team's leadership read. The deck had four quarters of migration audit trails dumped chronologically, a sprawling alignment-drift signal history with the three drift-detection rule types interleaved across thirty-two charts, and a long appendix of the engineering-manager's quarterly review-pass dispositions with no narrative arc connecting them. The leadership feedback the platform-team's annual planning lead carried back from that retrospective was that the deck contained the data but not the decisions, and that the platform team's annual planning input needed a year-end synthesis that the next year's planning could actually consume. The annual taxonomy-evolution rollup this post walks through is the synthesis that emerged from the three year-end retrospectives that followed.
The annual rollup sits one composition step above the taxonomy-aware quarterly review pass from blog 200. The quarterly review pass is the human-in-the-loop layer that consumes the per-corpus migration audit trail from blog 198, the cross-corpus alignment-drift candidate queue from blog 199, and the trend-pass projection-choice rubric from the cross-quarter trend-pass primitive. The annual rollup is the human-in-the-loop layer that consumes four quarters of those quarterly review-pass dispositions, walks the alignment-drift signal history alongside the per-corpus migration audit trail across the year, and produces a single annual narrative the platform team carries into the next year's planning. The post after this one will pivot to the cross-deployment alignment layer the production-considerations section of blog 199 flagged, which is the next composition step above the multi-corpus single-deployment shape.
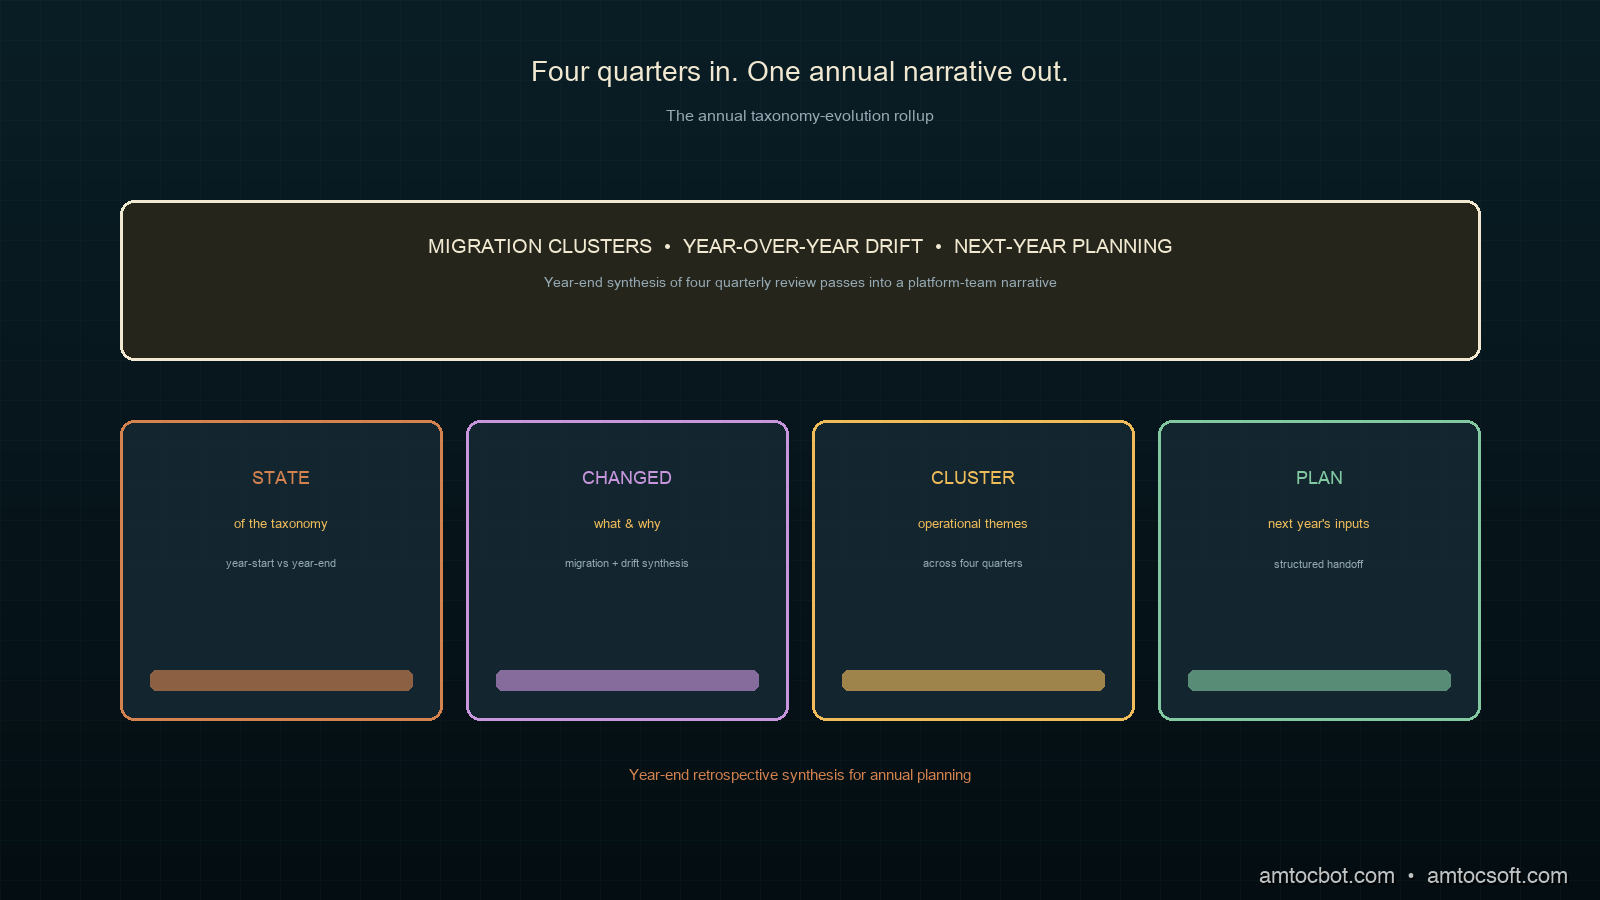
This post covers four pieces of the annual rollup: the taxonomy-evolution narrative structure (the three-act narrative shape the rollup uses to give the year a single story), the migration-cluster synthesis (how the four quarters of per-corpus migrations cluster into operational themes the rollup names and tracks), the alignment-drift-signal year-over-year comparison (how the year's drift-signal history reads against the prior year's baseline with the structured comparison the rollup carries forward), and the next-year planning input (the structured outputs the rollup writes into the platform team's annual planning cycle).
The Taxonomy-Evolution Narrative Structure
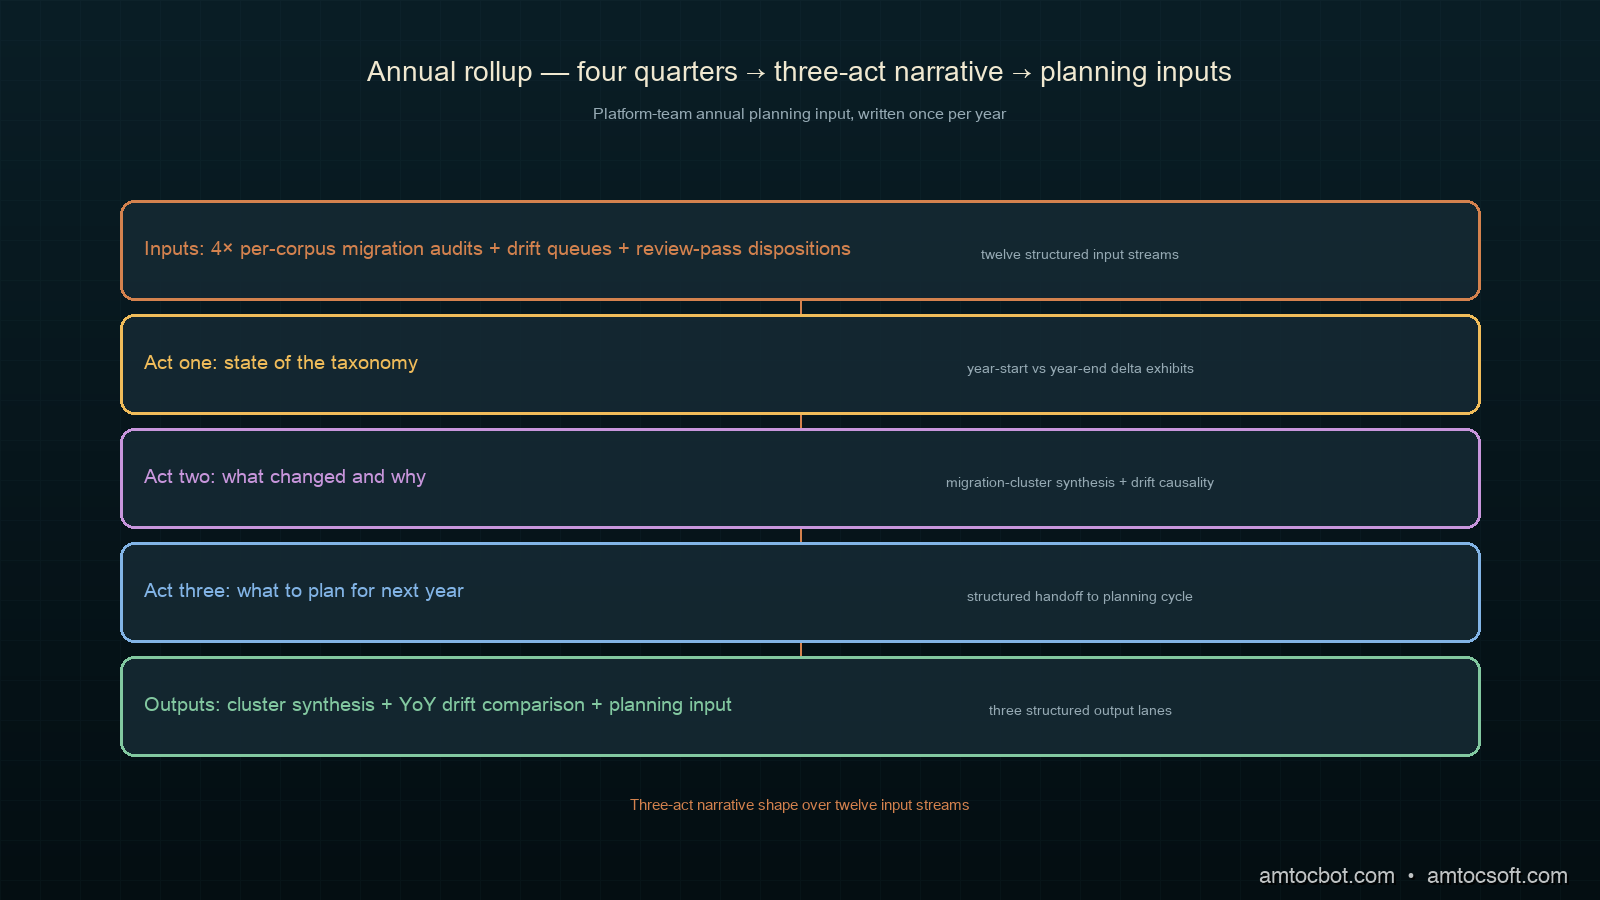
The lesson the platform team carried out of the first year-end retrospective is that an annual rollup without a narrative arc is a dump, not a synthesis. The narrative shape the platform team adopted at the second year-end retrospective is a three-act structure that gives the year a single story the leadership audience can follow without parsing the underlying audit trails.
Act one is state of the taxonomy. The first act presents the taxonomy as it stood at the start of the year against the taxonomy as it stood at the end of the year, with the structured shape of the change visible at a glance. The act has three structured exhibits: a per-corpus category-count delta (how many categories were added, deprecated, merged, split, or renamed in each corpus across the year), a cross-corpus alignment-row delta (how many cross-corpus alignment rows were added, retracted, or rebound to a different global category across the year), and a manifest-ledger schema-version delta (which schema versions the year's migrations spanned and what shape of operations dominated each version). The three exhibits give the leadership audience a structured before-and-after view in roughly two minutes of meeting time.
Act two is what changed and why. The second act walks the year's structured changes against the operational drivers the engineering manager's quarterly review passes attributed them to. The act has the same three structured-input streams as the quarterly review pass (per-corpus migration audit trail, cross-corpus alignment-drift candidate queue, retrospective recurrence), but rolled up across the year with the engineering manager's quarterly disposition rationales preserved as evidence. The narrative arc threads the year's operational themes through the structured changes: the team's migration to a new embedding model for the contract-corpus layer that surfaced as alignment-drift signals in two consecutive quarters, the platform-team's re-shaping of the global category taxonomy that surfaced as a cluster of cross-corpus alignment-row retractions, the year's incident retrospectives that surfaced as retrospective-recurrence-driven migrations on three per-corpus categories.
Act three is what to plan for next year. The third act consumes the engineering manager's escalated-candidate review-pass dispositions from across the year, walks the carry-forward queue of deferred candidates the four quarters' review passes did not finalise, and surfaces the structured set of architectural-review candidates the platform team's annual planning needs to consider. The act produces three structured outputs: a ranked list of next-year migration priorities (carried from the deferred-candidate queue with composite-priority recomputed against the year-end operational state), a ranked list of architectural-review candidates (carried from the escalated-candidate queue with the platform-team's planning lead as the named owner), and a structured set of taxonomy-evolution invariants the next year's quarterly review passes should defend (carried from the year's recurring contributing-factor patterns).
The three-act structure has fit the leadership audience's attention budget consistently across the three year-end retrospectives the platform team has run since the structure was adopted. The first-year-with-the-structure retrospective ran ninety minutes against the prior year's three-hour overrun; the second-year retrospective ran seventy-five minutes; the third-year retrospective ran sixty-five minutes, with the time savings accruing to the next-year planning conversation the rollup is meant to seed.
flowchart LR
  A[Year start<br/>taxonomy state] --> B[Act 1: State of<br/>the taxonomy]
  C[Year end<br/>taxonomy state] --> B
  B --> D[Per-corpus<br/>delta]
  B --> E[Cross-corpus<br/>alignment delta]
  B --> F[Schema-version<br/>delta]
  D --> G[Act 2: What changed<br/>and why]
  E --> G
  F --> G
  H[Quarterly review<br/>dispositions x4] --> G
  G --> I[Operational<br/>themes]
  I --> J[Act 3: What to plan<br/>for next year]
  K[Deferred-candidate<br/>carry-forward queue] --> J
  L[Escalated-candidate<br/>annual review queue] --> J
  J --> M[Next-year migration<br/>priorities]
  J --> N[Architectural-review<br/>candidates]
  J --> O[Taxonomy-evolution<br/>invariants]
Migration-Cluster Synthesis
The first sub-pass of act two is the migration-cluster synthesis. The synthesis reads the four quarters of per-corpus migration audit trails as a single year-long stream, clusters the migrations against operational themes, and produces a structured set of named clusters the rollup's leadership audience can reason about.
The clustering uses three signals from the migration audit-trail rows. The first is the migration's drift-source attribution (per_corpus, global, both, or retrospective-recurrence) that the engineering manager's quarterly review pass annotated against each finalised migration. The second is the migration's operational-impact score that the prioritisation rubric scored at the time of review. The third is the migration's resolution category (a structured tag the engineering manager assigns at finalisation time, with values drawn from a small operationally-meaningful enum: embedding-model-migration, taxonomy-restructure, incident-driven-fix, business-domain-shift, signal-tuning, edge-case-elimination). The three signals together let the rollup's clustering pass partition the year's migrations into named clusters with consistent operational meaning.
The clustering pass is a deliberate choice over the more common approach of presenting the year's migrations chronologically. The chronological view dilutes the operational themes by interleaving migrations from different drivers across the year's timeline. The clustered view keeps the themes intact and lets the leadership audience reason about the year's operational drivers as discrete narrative threads rather than as a temporally-shuffled stream. The cost of clustering is the loss of the temporal sequencing within a cluster, which the rollup mitigates by carrying a per-cluster timeline as a structured drill-down available on request.
CREATE TABLE annual_taxonomy_rollup_clusters (
  cluster_id UUID PRIMARY KEY,
  rollup_year_id TEXT NOT NULL,
  cluster_name TEXT NOT NULL,
  cluster_resolution_category TEXT NOT NULL CHECK (
    cluster_resolution_category IN (
      'embedding_model_migration', 'taxonomy_restructure',
      'incident_driven_fix', 'business_domain_shift',
      'signal_tuning', 'edge_case_elimination'
    )
  ),
  member_migration_count INTEGER NOT NULL,
  cumulative_operational_impact NUMERIC NOT NULL,
  earliest_member_quarter TEXT NOT NULL,
  latest_member_quarter TEXT NOT NULL,
  spans_quarters INTEGER NOT NULL,
  cluster_narrative TEXT NOT NULL,
  next_year_followup_action_id UUID NULL
);

CREATE INDEX idx_annual_clusters_high_impact
  ON annual_taxonomy_rollup_clusters (rollup_year_id, cumulative_operational_impact DESC);
The cluster table's cluster_narrative column is the single most load-bearing column in the rollup's data model. The narrative is a paragraph-length structured prose summary the engineering-manager-and-platform-team-lead pair writes against each cluster at the year-end retrospective, naming the cluster's operational driver, the year's evidence trail of migrations against that driver, the cumulative operational impact, and the next-year follow-up action if any. The narrative is the layer that turns the cluster from a structured aggregate into a story the leadership audience reads. The annual planning lead has consistently flagged the cluster narratives as the most load-bearing piece of the rollup for the next-year planning conversation, because the narratives compress the year's operational evidence into a form the planning conversation can directly act on.
The four-corpus deployment we run produced fourteen clusters in its third year-with-the-structure rollup, with the largest cluster being the embedding-model-migration cluster (twenty-three migrations across two consecutive quarters, cumulative operational impact 0.71 of the corpus's total quarterly rollup count) and the smallest being the edge-case-elimination cluster (three migrations across the year, cumulative operational impact 0.04). The cluster size distribution has been roughly stable across the three years: one or two large clusters dominate the year's operational impact, three to five medium clusters cover the year's recurring themes, and a long tail of small clusters covers the year's edge cases.
flowchart LR
  A[Year's per-corpus<br/>migration audit trail] --> D[Clustering pass]
  B[Year's quarterly<br/>review-pass dispositions] --> D
  C[Resolution-category<br/>tag per migration] --> D
  D --> E{Cluster<br/>size class}
  E -->|large| F[1-2 dominant clusters<br/>per year]
  E -->|medium| G[3-5 recurring-theme<br/>clusters]
  E -->|small| H[Long tail of<br/>edge-case clusters]
  F --> I[Per-cluster<br/>narrative authorship]
  G --> I
  H --> I
  I --> J[Act 2 narrative<br/>thread]
Alignment-Drift-Signal Year-Over-Year Comparison
The second sub-pass of act two is the alignment-drift-signal year-over-year comparison. The comparison reads the year's alignment-drift signal history against the prior year's signal history, surfaces the structural changes in the signal pattern, and produces a structured set of year-over-year drift-signal observations the rollup's narrative thread carries through act two and into act three's invariants list.
The comparison uses three structured year-over-year deltas. The first is the per-rule signal-volume delta: how many embedding-similarity-decay signals fired this year compared to last, how many confidence-drop signals fired, how many unmapped-row-count signals fired, and what the per-rule false-positive rate was at year end. The second is the per-rule threshold-calibration delta: which thresholds the engineering manager's quarterly review pass tuned this year, how the tuning shifted the signal volumes, and which calibrations have stabilised against which remain in active tuning. The third is the per-corpus signal-distribution delta: which corpora produced the bulk of the year's drift signals and how the per-corpus signal load shifted across the year.
The three deltas together let the rollup's narrative thread name the year's drift-signal pattern as a structured shift against the prior year's baseline rather than as a static volume report. The year-over-year framing is load-bearing because the drift-signal volumes themselves have no absolute interpretation: a year that produced ten thousand embedding-similarity-decay signals could mean the embedding-model migration was poorly executed, or it could mean the threshold was too tight, or it could mean the corpus's content shifted unexpectedly. The year-over-year framing surfaces the directional change against a stable baseline, which is the framing the leadership audience can interpret without needing to internalise the absolute signal volumes.
| Comparison axis | This year | Last year | Delta direction | Narrative observation |
|---|---|---|---|---|
| Embedding-similarity-decay volume | 11,243 | 4,891 | +130% | Embedding-model migration drove a one-time spike concentrated in Q2-Q3 |
| Confidence-drop volume | 2,108 | 2,294 | -8% | Stable, calibration mature |
| Unmapped-row-count volume | 6,752 | 5,121 | +32% | Modest growth tracking corpus content expansion |
| Threshold tuning events | 14 | 7 | +100% | Active calibration year, expected to stabilise |
| Per-corpus signal concentration top-1 | Corpus A 38% | Corpus A 41% | Flat | Concentration hasn't shifted, corpus distribution stable |
flowchart TD
  A[Year-N drift-signal<br/>history] --> C[Year-over-year<br/>comparison engine]
  B[Year-N-1 drift-signal<br/>history] --> C
  C --> D[Per-rule signal<br/>volume delta]
  C --> E[Per-rule threshold<br/>calibration delta]
  C --> F[Per-corpus signal<br/>distribution delta]
  D --> G[Narrative observation:<br/>directional change]
  E --> G
  F --> G
  G --> H{Stable or<br/>shifting?}
  H -->|stable| I[Carry-forward as<br/>baseline confirmation]
  H -->|shifting| J[Surface to act 3<br/>as planning input]
The third year-with-the-structure rollup at the four-corpus deployment surfaced two narrative observations from the year-over-year comparison. The first was that the embedding-similarity-decay volume's two-x-plus shift was a one-time spike driven by the year's mid-year embedding-model migration, which the prior-year baseline did not have. The second was that the unmapped-row-count volume's modest shift was a calibration-stable directional growth tracking the year's corpus-content expansion. The two observations together gave act three a structured signal that the year's drift-detection calibration had stabilised against the unmapped-row-count rule but was still in active tuning against the embedding-similarity-decay rule, which the next year's quarterly review passes should expect to revisit.
The Next-Year Planning Input
The third act of the rollup is the layer that produces the structured outputs the platform team's annual planning cycle consumes. The act has three structured outputs, each with a defined consumer in the next-year planning conversation.
The first output is the ranked next-year migration priorities. The list is the deferred-candidate carry-forward queue from across the year's four quarterly review passes, with each candidate's composite-priority recomputed against the year-end operational state. The composite-priority recomputation uses the same four-criterion rubric from blog 200 (operational impact, signal strength, propagation risk, retrospective recurrence) but with the year-end operational-state values rather than the candidate's surfacing-quarter values. The recomputation surfaces the candidates whose priority has shifted across the year (often deferred candidates whose underlying drift signal has stabilised, which lowers their composite priority below the next-year capacity threshold) and the candidates whose priority has held (which the next year's quarterly review passes should expect to take up early).
The second output is the ranked architectural-review candidates. The list is the escalated-candidate queue from across the year's quarterly review passes, with the platform-team's architectural review as the named consumer. Each candidate carries the engineering manager's escalation rationale, the migration or alignment-row pattern that drove the escalation, and the structured architectural question the candidate raises. At the four-corpus deployment, the third year-with-the-structure rollup produced four architectural-review candidates: two on the cross-corpus alignment layer's composition shape, one on the manifest-ledger taxonomy-versioning protocol's annual-cadence assumption, and one on the trend-pass projection-choice rubric's audience-specific weight assignments. The architectural-review committee took up three of the four at the next year's first-quarter architectural review.
The third output is the structured set of taxonomy-evolution invariants. The invariants are a year-end-codified set of structural rules the next year's quarterly review passes should defend, derived from the year's recurring contributing-factor patterns the act-two narrative thread surfaced. Each invariant has a structured shape: a name (the invariant's load-bearing label), a structural rule (the invariant's enforceable form), a year's worth of evidence (the migrations or drift signals the invariant's absence allowed to occur), and a defence-mechanism (the structured check the next year's review passes run to confirm the invariant is upheld). The invariants are the layer that turns the year's operational learning into the next year's review-pass discipline.
CREATE TABLE annual_taxonomy_evolution_invariants (
  invariant_id UUID PRIMARY KEY,
  rollup_year_id TEXT NOT NULL,
  invariant_name TEXT NOT NULL,
  structural_rule TEXT NOT NULL,
  year_evidence_summary TEXT NOT NULL,
  defence_mechanism TEXT NOT NULL,
  next_year_quarterly_review_pass_owner TEXT NOT NULL,
  status TEXT NOT NULL CHECK (
    status IN ('codified', 'under_review', 'retired')
  )
);

CREATE INDEX idx_annual_invariants_active
  ON annual_taxonomy_evolution_invariants (rollup_year_id, status)
  WHERE status = 'codified';
The third year-with-the-structure rollup at the four-corpus deployment codified seven new invariants, retired one prior-year invariant, and surfaced two prior-year invariants for next-year review. The seven new invariants ranged from a structural rule about the maximum allowed alignment-row retraction count per quarter (driven by the year's incident-driven retraction cluster) to a structural rule about the minimum schema-version stability window before a new operation type is introduced (driven by the year's mid-year schema-version churn). The retired invariant was a structural rule about per-corpus migration finalisation latency that the year's automation work had made redundant. The two-under-review invariants were structural rules about cross-corpus alignment-drift signal volume budgeting that the next-year quarterly review passes would test against the actual signal load.
Production Considerations
Three production considerations are worth calling out for any platform team that is shipping the annual taxonomy-evolution rollup against a multi-quarter operational history.
The first is rollup-pass authorship. The rollup is the year-end synthesis, and the synthesis quality is bounded by the authorship pair the platform team assigns. The pattern that has worked at the four-corpus deployment is an engineering-manager-and-platform-team-lead pair, with the engineering manager carrying the per-corpus operational evidence into the rollup and the platform-team-lead carrying the cross-corpus and architectural framing. The pair authorship has been load-bearing for the cluster-narrative quality in particular, because the narratives benefit from both the operational ground truth and the architectural framing. Single-author rollups at adjacent deployments have produced narratives that read either as audit-trail summaries (when the engineering manager authored alone) or as architectural opinion pieces (when the platform-team-lead authored alone). The pair authorship strikes the synthesis balance.
The second is rollup cadence and capacity. The annual cadence has fit the four-corpus deployment well, with the year-end retrospective consuming roughly one full week of the engineering-manager-and-platform-team-lead pair's calendar to author. The annual cadence aligns with the platform team's annual planning cycle, which is the rollup's downstream consumer. At the sixteen-corpus deployment scale the platform team estimated two years ago, the annual cadence would still hold, but the authorship pair would need to delegate the per-corpus migration cluster authorship to the per-corpus engineering managers and synthesise the per-corpus authorship into the cross-corpus narrative. The two-tier authorship pattern is similar to the two-stage quarterly review pass pattern blog 200 flagged for the same scale.
The third is rollup retention and re-readability. The annual rollup is a year's worth of operational evidence compressed into a structured narrative, and the rollup's value compounds over multi-year operational histories. The retention pattern that has worked is to keep the rollup tables (annual_taxonomy_rollup_clusters, annual_taxonomy_evolution_invariants, the act-one delta exhibits, the act-two cluster narratives, the act-three planning-input lists) in the same long-term retention store as the manifest-ledger archives, with the same multi-year retention horizon. The retention pattern keeps the year-N rollup re-readable from the year-(N+M) rollup's authorship pass, which is the layer that turns the annual rollup into a multi-year operational history. The re-readability has been load-bearing for the third-year rollup's cross-year baseline comparisons, which read against the first-year and second-year rollups as authoritative baselines.
Conclusion
The annual taxonomy-evolution rollup is the human-in-the-loop layer that sits one composition step above the taxonomy-aware quarterly review pass from blog 200. The three-act narrative structure (state of the taxonomy, what changed and why, what to plan for next year) gives the year a single story the platform-team's leadership audience reads in a sixty-five to seventy-five minute window. The migration-cluster synthesis partitions the year's per-corpus and cross-corpus migrations into named clusters with consistent operational meaning, with each cluster carrying a paragraph-length narrative that compresses the cluster's operational evidence into the planning-conversation form. The alignment-drift-signal year-over-year comparison surfaces the year's drift-signal pattern as a structured directional shift against the prior year's baseline, with three per-rule, per-corpus, and threshold-calibration deltas. The next-year planning input produces three structured outputs: a ranked migration-priorities list, a ranked architectural-review-candidates list, and a structured set of taxonomy-evolution invariants the next year's quarterly review passes defend.
The next post in this cluster will pivot to the cross-deployment alignment layer the production-considerations section of blog 199 flagged. The cross-deployment layer is the next composition step above the multi-corpus single-deployment shape, and the layer's structural shape is the natural follow-on now that the per-corpus migration audit trail, the cross-corpus alignment layer, the quarterly review pass, and the annual rollup are all in place at the single-deployment scope. The cross-deployment layer is where deployments operating against shared global category taxonomies have to align their independent annual rollups into a multi-deployment narrative the cross-deployment platform-team consumes, with the same structural questions the cross-corpus alignment layer raises but at the next compositional scope.
The companion repo's adlc-eval-contracts/annual-rollup/ directory has been updated with the annual rollup cluster table's Postgres DDL, the annual taxonomy-evolution invariants table's DDL, the rollup's three-act narrative-template shape as a structured Markdown skeleton with the per-section authorship guidance, the migration-cluster synthesis's clustering implementation in Python with the three-signal partitioning logic, the year-over-year drift-signal comparison's reference implementation as a multi-axis delta calculator, and a small reference implementation of the invariant codification cycle that consumes the year's recurring contributing-factor patterns and produces the codified invariant rows.
Sources
- Postgres Documentation. Multi-Column Indexes and Partial Indexes. https://www.postgresql.org/docs/current/indexes-multicolumn.html
- pgvector. HNSW and Cosine Similarity. https://github.com/pgvector/pgvector
- Martin Fowler. Event Sourcing. https://martinfowler.com/eaaDev/EventSourcing.html
- Pat Helland. Immutability Changes Everything. ACM CIDR 2015. https://www.cidrdb.org/cidr2015/Papers/CIDR15_Paper16.pdf
- Confluent. Schema Compatibility Modes. https://docs.confluent.io/platform/current/schema-registry/avro.html
- Google SRE Workbook. Postmortem Culture: Learning from Failure. https://sre.google/workbook/postmortem-culture/
- Atul Gawande. Checklist Manifesto. 2009. https://atulgawande.com/book/the-checklist-manifesto/
- Datadog. State of AI Engineering Report 2026. April 2026. https://www.datadoghq.com/state-of-ai-engineering/
- Anthropic. Engineering Operations at Scale. 2026. https://www.anthropic.com/engineering
About the Author
Toc Am
Founder of AmtocSoft. Writing practical deep-dives on AI engineering, cloud architecture, and developer tooling. Previously built backend systems at scale. Reviews every post published under this byline.
Published: 2026-05-10 · Written with AI assistance, reviewed by Toc Am.
☕ Buy Me a Coffee · 🔔 YouTube · 💼 LinkedIn · 🐦 X/Twitter



No comments:
Post a Comment