Introduction
Every production system fails. Disks corrupt. Networks partition. Memory leaks. Containers crash. The question was never whether your system would experience failure — it was always how much failure is acceptable, who decides, and what happens when you cross that line.
Site Reliability Engineering (SRE) is Google's answer to that question, and since the landmark Site Reliability Engineering book landed in 2016, it has reshaped how the industry thinks about operations, developer velocity, and what "uptime" actually means. A decade later, SRE principles have matured from Google-scale theory into practical tooling available to any team running production workloads — whether you're operating microservices on Kubernetes, managing a monolith on bare metal, or running serverless functions across a cloud provider's edge network.
In 2026, the SRE discipline has evolved considerably. Multi-cloud deployments, AI-assisted incident response, chaos engineering as a standard practice, and the proliferation of PromQL-native observability stacks have pushed SLO-based reliability from a "nice to have" into a baseline expectation for teams shipping at velocity. If your team is still running on "we aim for 99.9% uptime" without tracking error budgets or burn rates, you are flying blind — and your users already know it before you do.
This guide is written for senior developers, platform engineers, and architects who understand distributed systems but haven't yet formalized their reliability practice. We'll cover the full SRE lifecycle: SLIs, SLOs, and SLAs defined clearly; error budget mechanics and what they actually unlock; burn rate alerting with real PromQL; incident management and blameless postmortems; chaos engineering practices; and a complete production-grade SLO monitoring stack using Prometheus and Grafana. Real configs, real queries, no hand-waving.
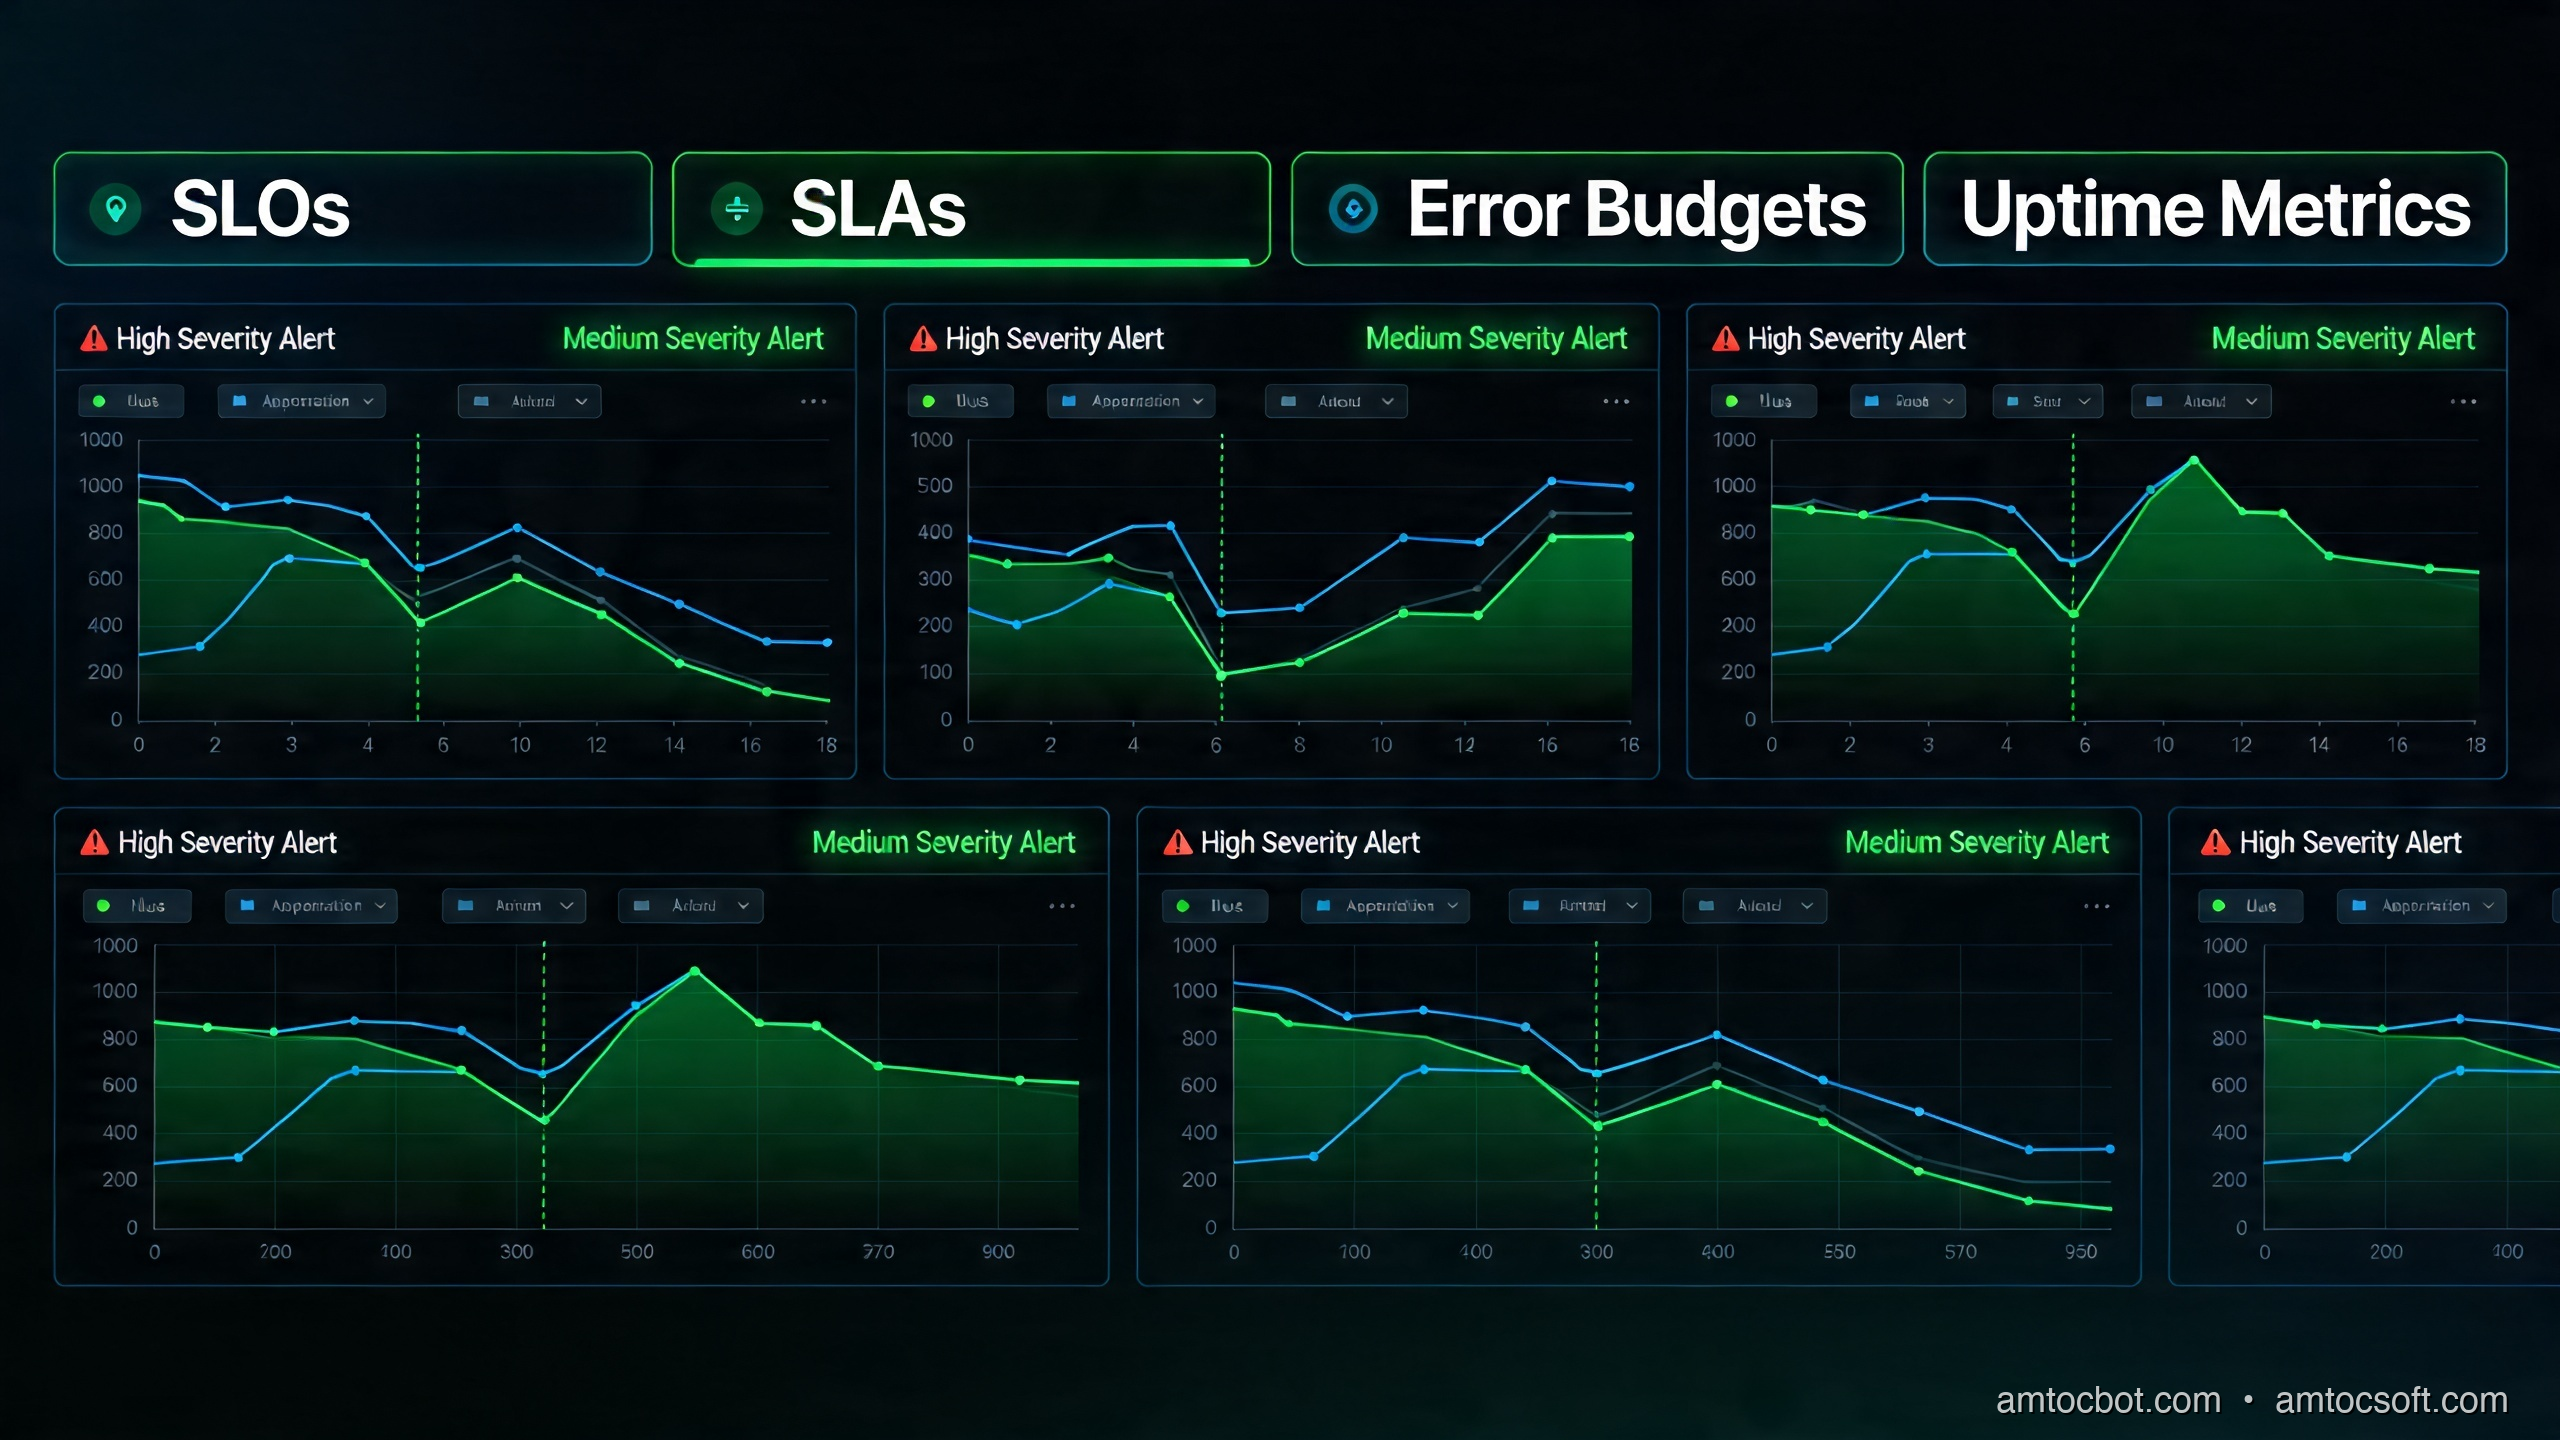
The Problem: "Uptime" Is a Lie
Ask any operations team what their availability target is and you'll almost certainly hear "five nines" — 99.999%, or about 5.26 minutes of downtime per year. It sounds impressive. It's also nearly useless as an operational target for most systems.
The problem is that raw uptime hides what users actually experience. A service can be technically "up" while:
- Returning HTTP 200 responses with error payloads buried in the JSON body
- Responding in 30 seconds instead of 300 milliseconds
- Processing only 60% of submitted jobs successfully
- Returning stale cached data that is 48 hours out of date
None of these scenarios register as "downtime" in a traditional uptime monitor. Your ping check passes. Your status page stays green. Your SLA says you're compliant. But your users are experiencing a degraded, broken product — and they're churning.
The second failure mode is operational paralysis. Teams that promise "five nines" often achieve it through the wrong mechanism: they stop shipping features because every deploy is a risk. The deployment frequency drops. The release batch size grows. The blast radius of each release expands. Eventually a six-month mega-release drops and takes down production for two hours. Ironically, the obsession with uptime created the conditions for the worst outage of the year.
SRE solves both problems simultaneously. By defining reliability in terms of user-visible behavior (not infrastructure health), and by treating acceptable unreliability as a budget to spend on development velocity, SRE aligns the incentives of operations and product engineering in a way that pure uptime monitoring never could.
The Three-Letter Acronym Clarified
Before going further, let's establish precise definitions — because SLI, SLO, and SLA are commonly conflated:
SLI (Service Level Indicator): A quantitative measure of a specific aspect of service behavior, as experienced by users. Good SLIs are directly measurable, clearly tied to user experience, and expressed as a ratio (good events / total events). Examples: request success rate, latency at p99, data freshness age, pipeline throughput.
SLO (Service Level Objective): An internal target for an SLI over a rolling time window. The SLO is your team's commitment to itself: "We will maintain a success rate of ≥ 99.5% over any 30-day rolling window." SLOs are operational targets, not contractual obligations.
SLA (Service Level Agreement): A contractual commitment to external parties (customers, business units, partners), typically with financial consequences for breach. SLAs are almost always less stringent than SLOs — the gap between them is your safety margin.
Error Budget: The inverse of your SLO. If you target 99.5% availability, your error budget is 0.5% of requests — over 30 days, that's roughly 3.6 hours of equivalent downtime. This budget is the core mechanism that makes SRE work: it converts abstract reliability targets into a concrete, time-bounded resource that both developers and operations share.
How It Works: The SRE Reliability Model
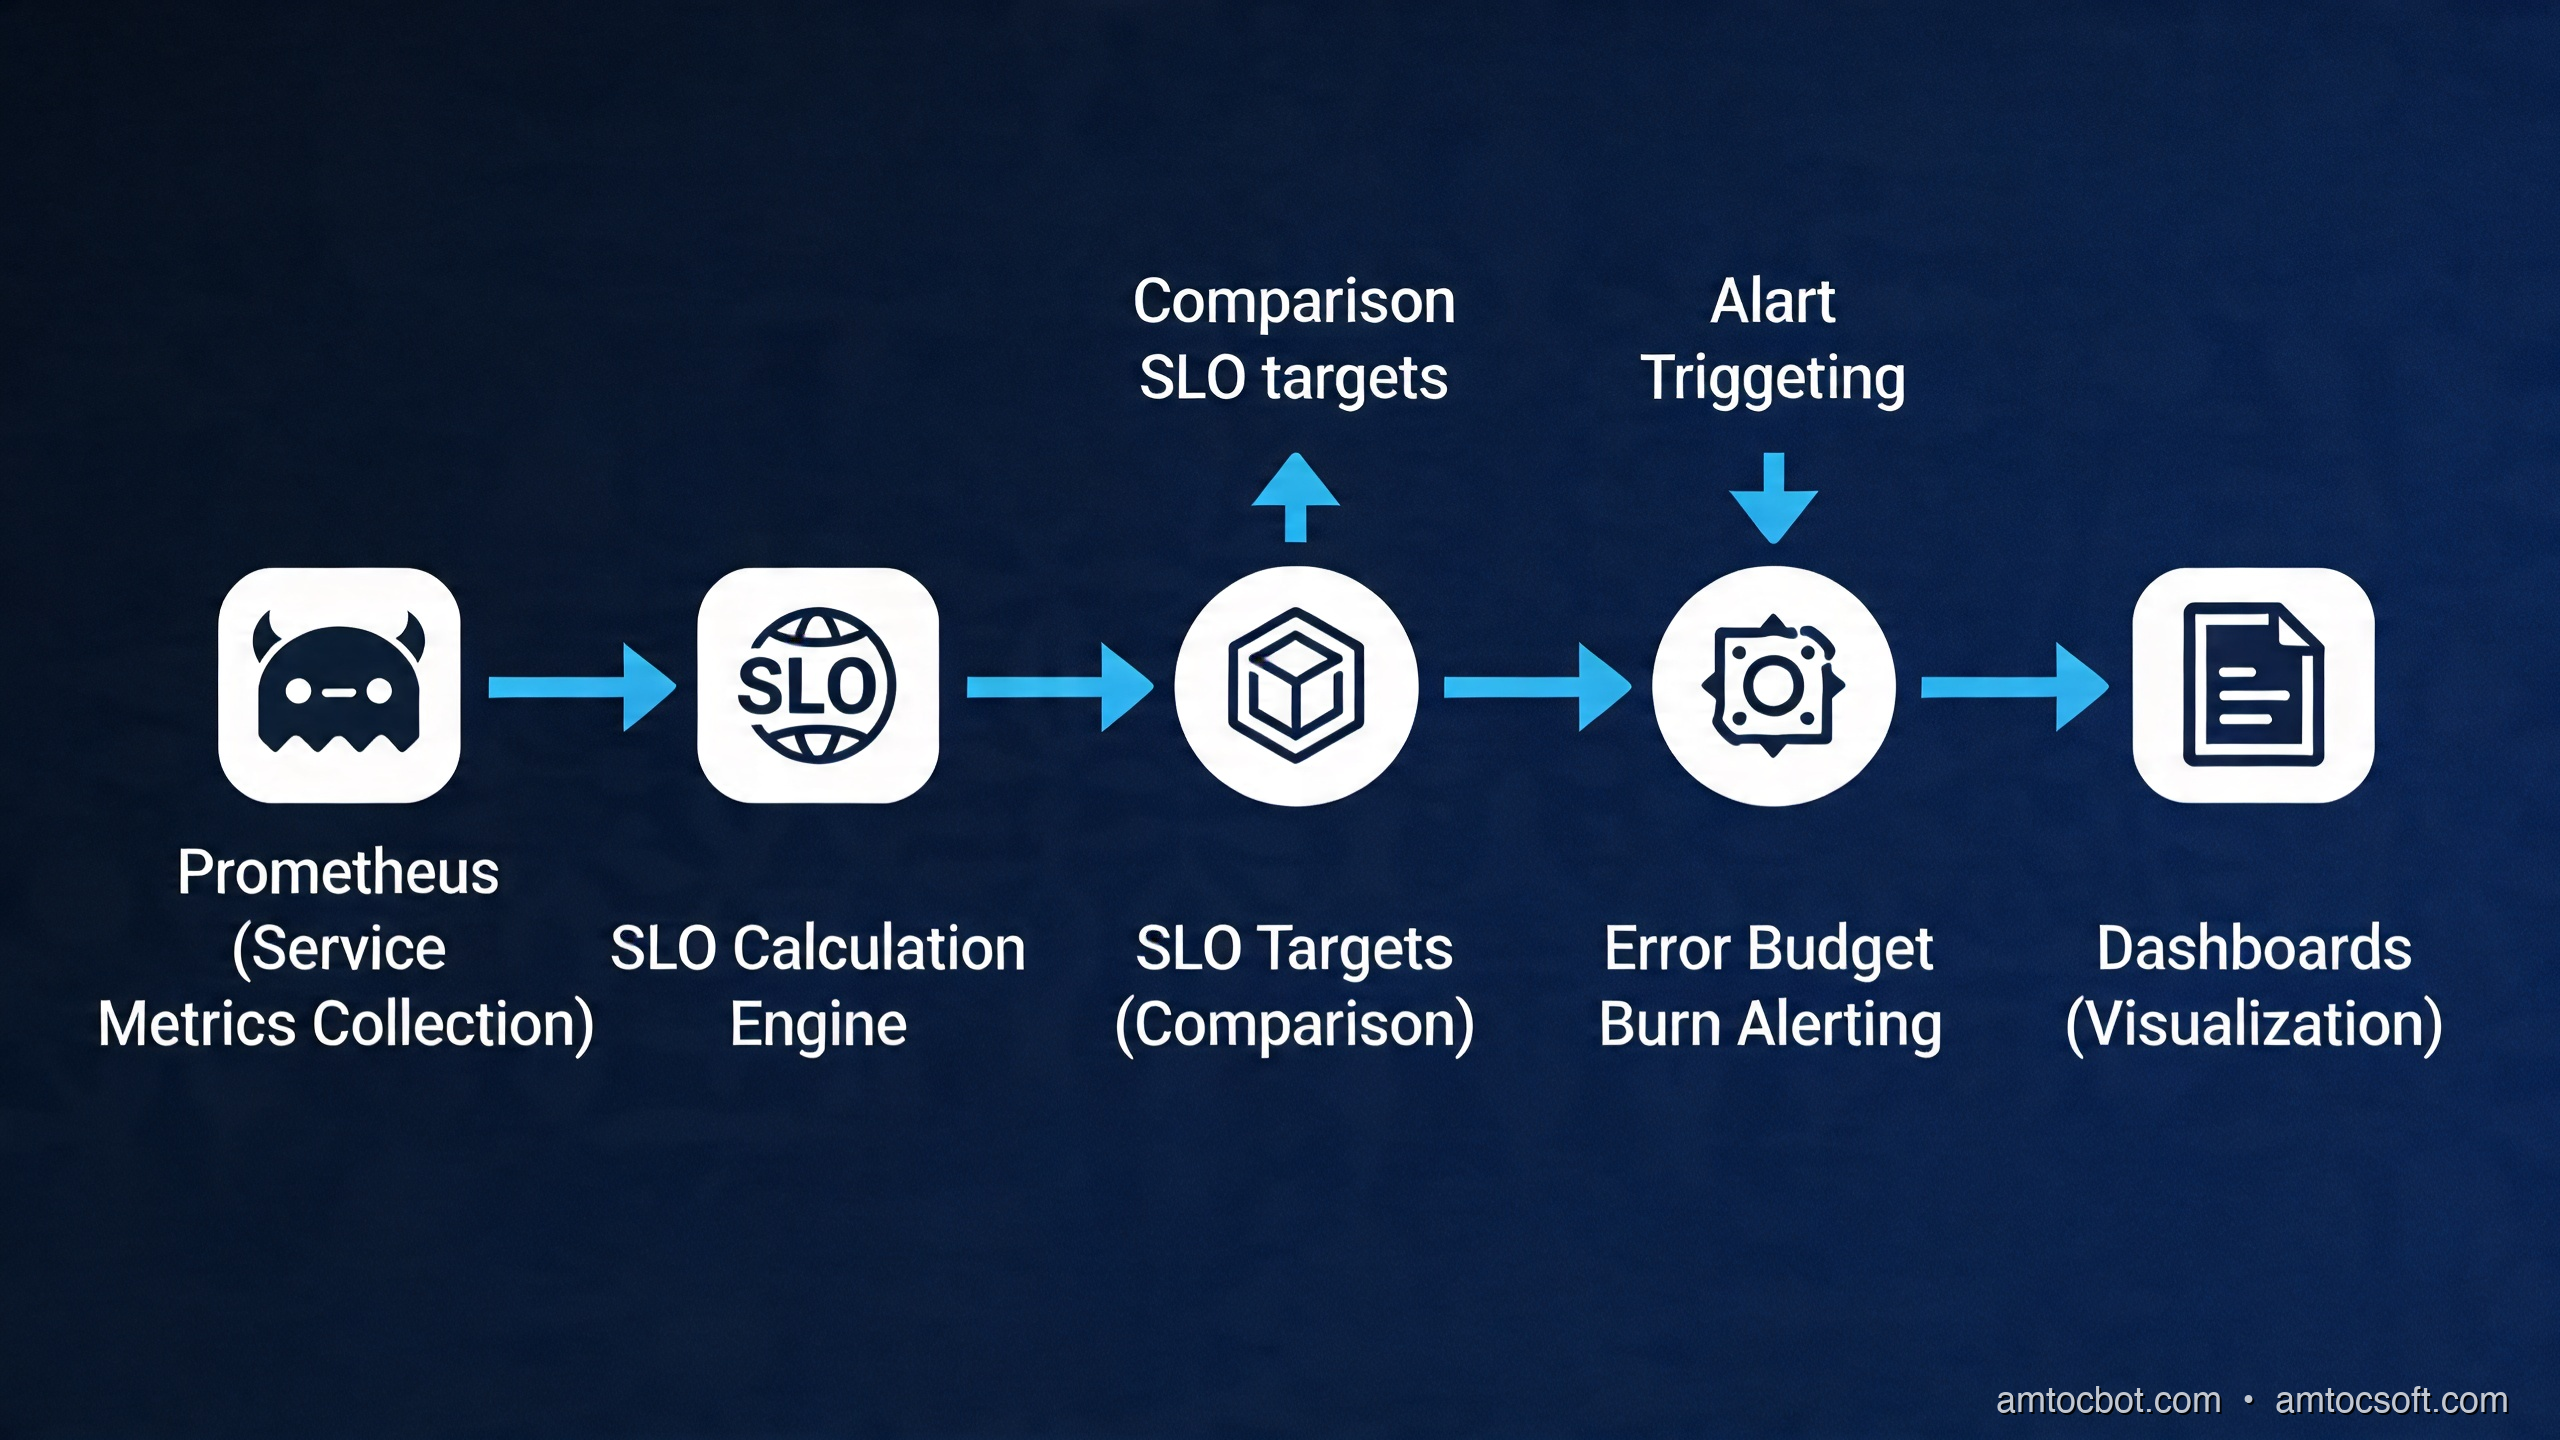
The SLO Lifecycle
The operational loop at the heart of SRE is simple to describe and surprisingly nuanced to execute correctly.
Each phase of this loop has specific practices:
1. Define SLIs: Start by asking "What does a good interaction with this service look like from a user's perspective?" For an HTTP API, a good interaction is a request that returns a non-5xx response within an acceptable latency threshold. For a data pipeline, a good run is one that completes within SLA and produces correct output. For a streaming service, good delivery is a message consumed within X milliseconds of publication. SLIs must be user-visible, quantifiable, and measurable from existing telemetry.
2. Set SLO Targets: Target the SLO at the level your users actually need, not the highest number you think you can achieve. A common mistake is setting SLOs aspirationally ("we want 99.99%") rather than empirically ("our users complain when we're below 99.5%, so we'll target 99.7% and build toward 99.9%"). Use historical data. Look at your current error rates. If you're currently at 99.2%, committing to 99.9% without a reliability investment roadmap will immediately exhaust your error budget and freeze all development.
3. Implement Measurement: SLOs are meaningless without instrumentation. This typically means instrumenting your application to emit request counters (success/failure), latency histograms, and domain-specific metrics. Prometheus + instrumentation libraries are the de-facto standard in 2026.
4. Burn Rate Alerting: Don't alert on error rate directly — alert on burn rate, which measures how fast you're consuming your error budget relative to the expected rate. A burn rate of 1.0 means you're consuming budget at exactly the pace your SLO expects. A burn rate of 14.4 means you'll exhaust your 30-day budget in 50 hours. This framing is what enables actionable, calibrated alerting.
5. Incident → Postmortem: When incidents occur, the SRE model treats them as learning opportunities, not blame opportunities. Blameless postmortems focus on systemic causes: what in the system design, tooling, process, or environment allowed this failure to happen? Action items address root causes, not individuals.
6. Toil Reduction: Toil — the repetitive, manual, automatable operational work that scales linearly with traffic — is tracked and bounded. SRE teams at Google have an explicit cap: no more than 50% of engineering time on toil. The rest goes to engineering work that improves reliability, reduces future toil, or builds features.
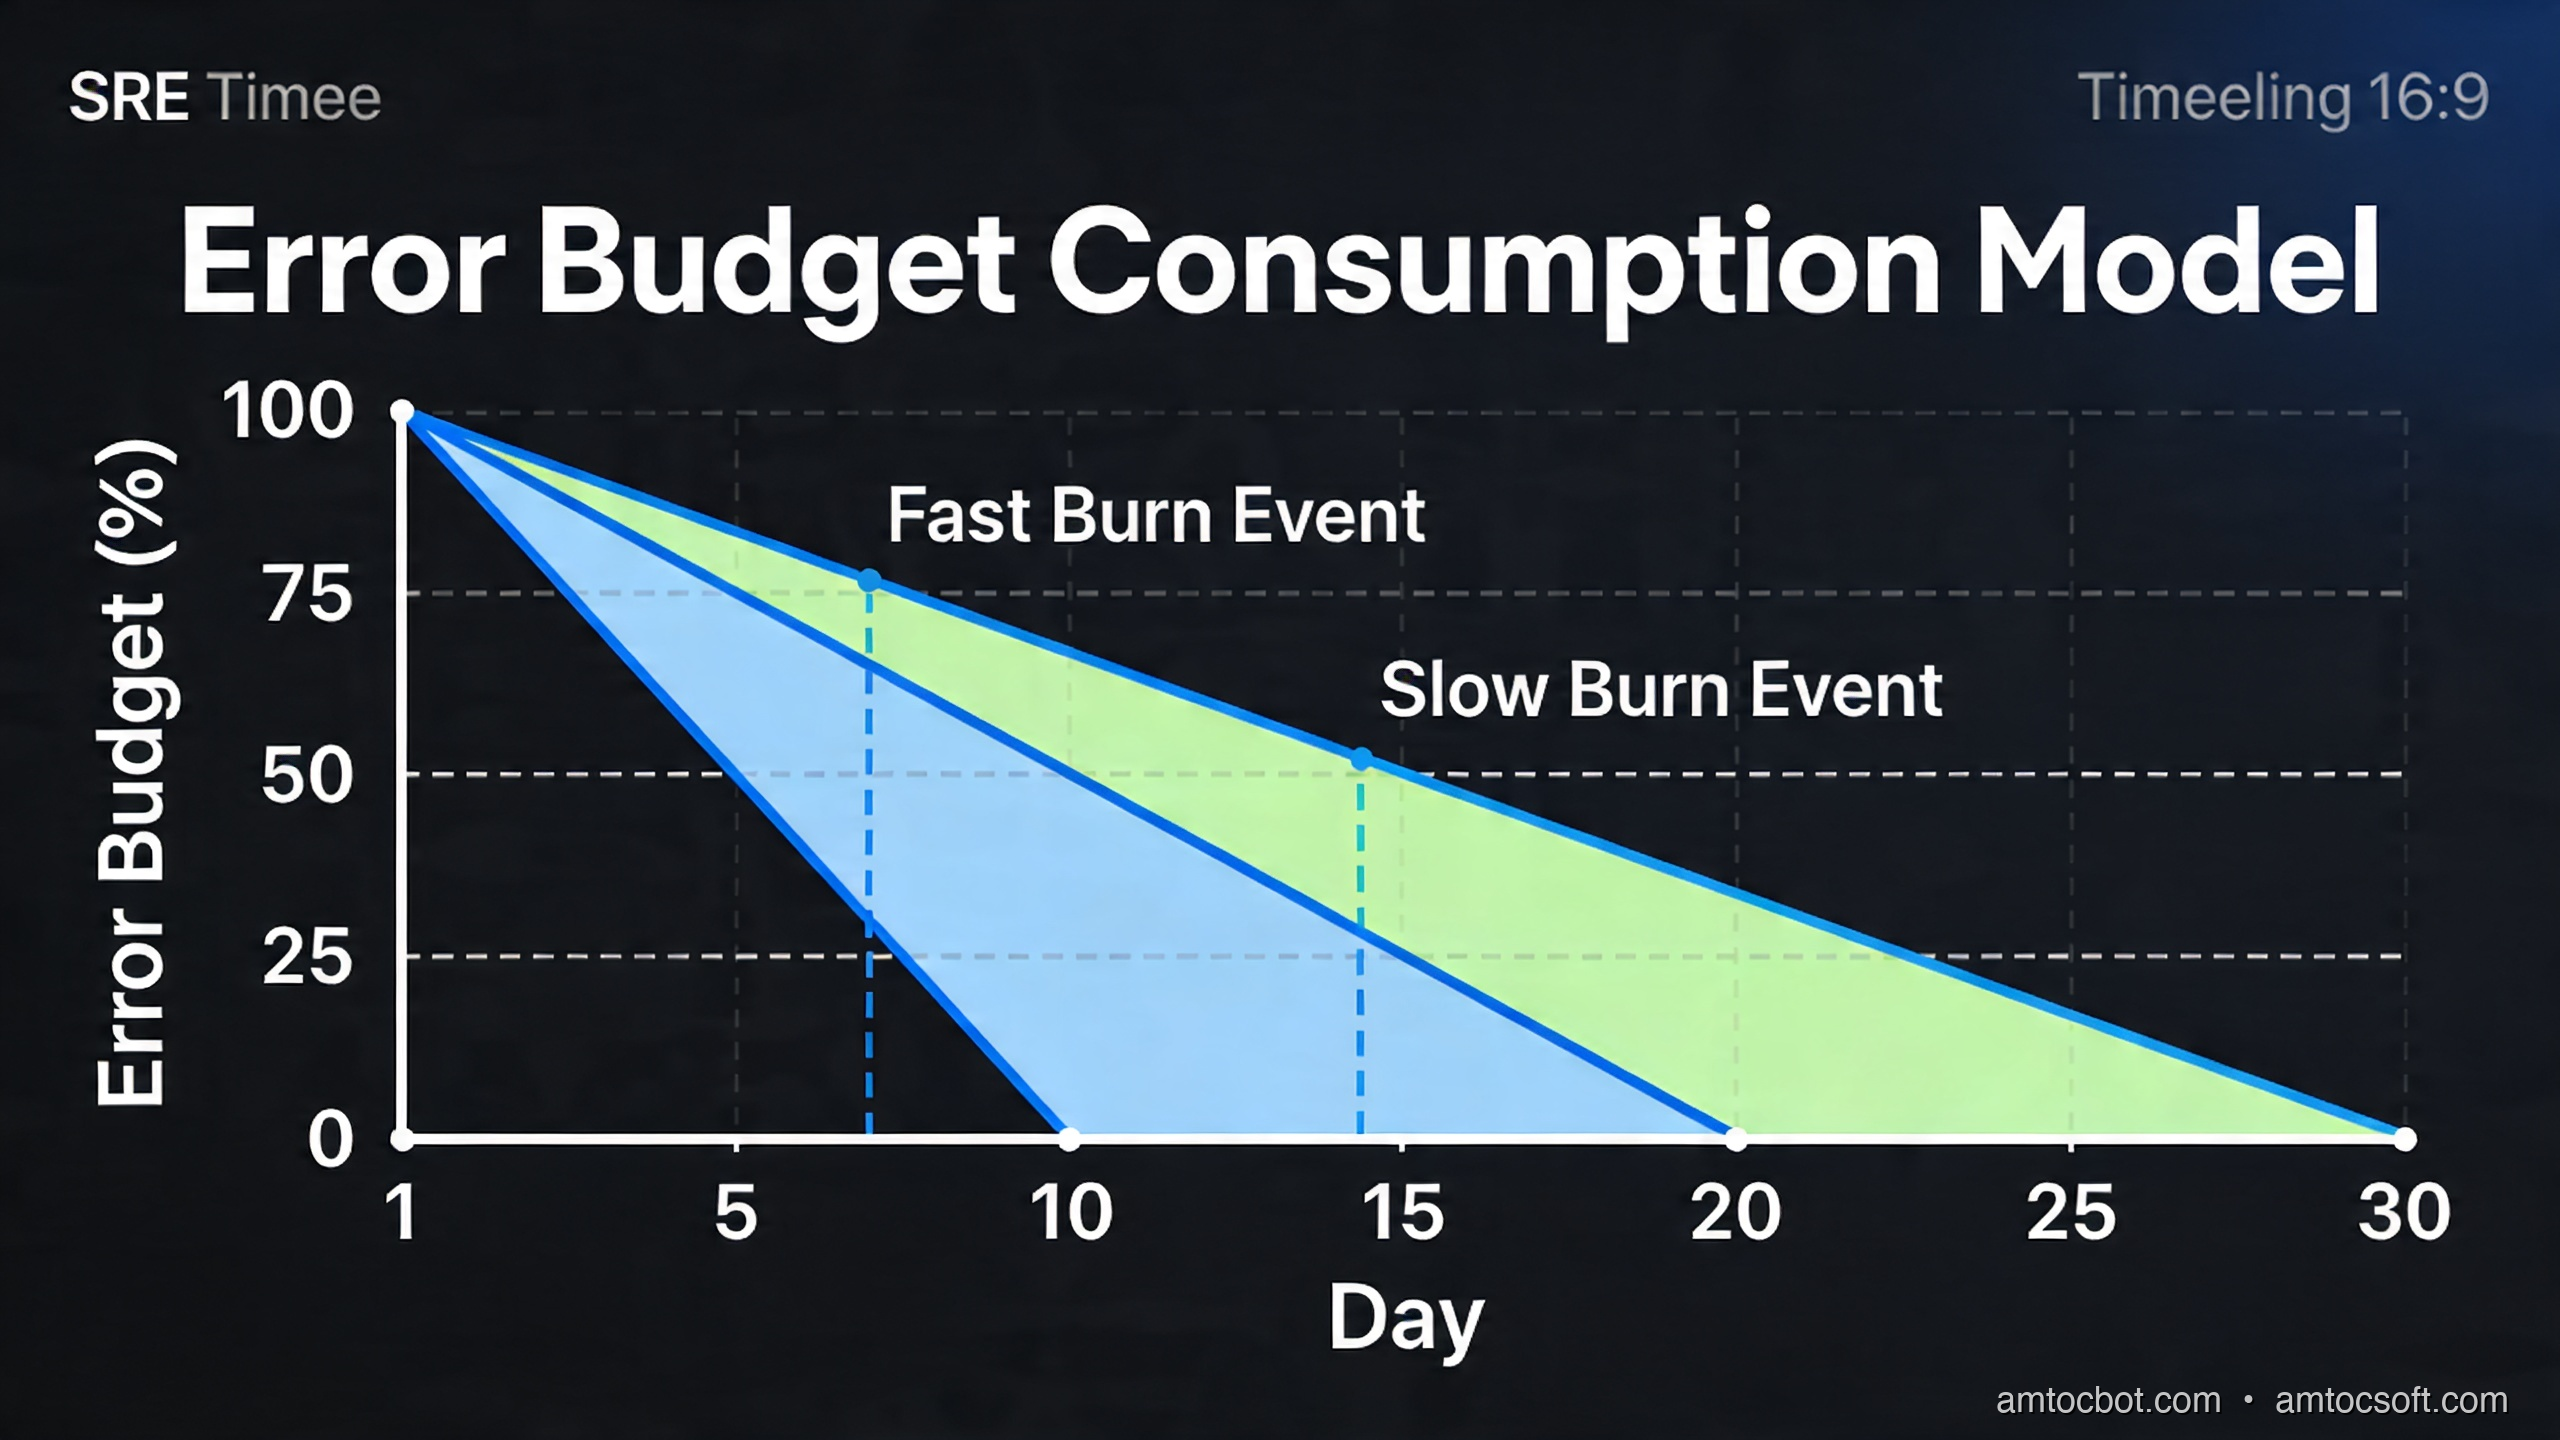
Error Budget Mechanics
The error budget is what transforms SRE from a philosophy into an operational practice. Here's how the decision model works:
The practical implication of this model: when your error budget is healthy, development teams have organizational cover to ship fast, experiment, and accept some risk. When the budget runs low, it's not "operations saying no to releases" — it's a shared, objective signal that the system needs reliability investment before more features can be safely added.
This is what makes SRE politically effective inside organizations. Decisions about release freezes are no longer subjective ("the ops team is being paranoid") — they're driven by a shared metric that both product and engineering signed off on.
Implementation Guide: SLOs with Prometheus and Grafana
Step 1: Instrument Your Application
Start with request counters and latency histograms using the Prometheus client library for your language. Here's a complete example for a Go HTTP service:
package middleware

import (
    "net/http"
    "strconv"
    "time"

    "github.com/prometheus/client_golang/prometheus"
    "github.com/prometheus/client_golang/prometheus/promauto"
)

var (
    httpRequestsTotal = promauto.NewCounterVec(
        prometheus.CounterOpts{
            Name: "http_requests_total",
            Help: "Total number of HTTP requests by status class and endpoint",
        },
        []string{"method", "route", "status_class"},
    )

    httpRequestDuration = promauto.NewHistogramVec(
        prometheus.HistogramOpts{
            Name:    "http_request_duration_seconds",
            Help:    "HTTP request latency distribution",
            Buckets: []float64{0.005, 0.01, 0.025, 0.05, 0.1, 0.25, 0.5, 1, 2.5, 5, 10},
        },
        []string{"method", "route"},
    )
)

// SLOMiddleware wraps handlers to emit SLO-relevant metrics
func SLOMiddleware(route string, next http.HandlerFunc) http.HandlerFunc {
    return func(w http.ResponseWriter, r *http.Request) {
        start := time.Now()
        rw := &responseWriter{ResponseWriter: w, statusCode: http.StatusOK}

        next.ServeHTTP(rw, r)

        duration := time.Since(start).Seconds()
        statusClass := strconv.Itoa(rw.statusCode/100) + "xx"

        httpRequestsTotal.WithLabelValues(r.Method, route, statusClass).Inc()
        httpRequestDuration.WithLabelValues(r.Method, route).Observe(duration)
    }
}

type responseWriter struct {
    http.ResponseWriter
    statusCode int
}

func (rw *responseWriter) WriteHeader(code int) {
    rw.statusCode = code
    rw.ResponseWriter.WriteHeader(code)
}
Step 2: Define Recording Rules
Raw Prometheus metrics need pre-computation for SLO evaluation. Recording rules materialize expensive aggregations into new time series, making dashboard queries fast and alert evaluation reliable:
# prometheus/rules/slo-recording-rules.yaml
groups:
  - name: slo_recording_rules
    interval: 30s
    rules:

      # === Availability SLI: ratio of successful requests ===

      # 5-minute availability (for short-window burn rate)
      - record: job:http_request_success:rate5m
        expr: |
          sum(rate(http_requests_total{status_class!="5xx"}[5m])) by (job)
          /
          sum(rate(http_requests_total[5m])) by (job)

      # 30-minute availability
      - record: job:http_request_success:rate30m
        expr: |
          sum(rate(http_requests_total{status_class!="5xx"}[30m])) by (job)
          /
          sum(rate(http_requests_total[30m])) by (job)

      # 1-hour availability
      - record: job:http_request_success:rate1h
        expr: |
          sum(rate(http_requests_total{status_class!="5xx"}[1h])) by (job)
          /
          sum(rate(http_requests_total[1h])) by (job)

      # 6-hour availability (for slow-burn detection)
      - record: job:http_request_success:rate6h
        expr: |
          sum(rate(http_requests_total{status_class!="5xx"}[6h])) by (job)
          /
          sum(rate(http_requests_total[6h])) by (job)

      # === Latency SLI: ratio of requests under 500ms threshold ===

      - record: job:http_request_latency_ok:rate5m
        expr: |
          sum(rate(http_request_duration_seconds_bucket{le="0.5"}[5m])) by (job)
          /
          sum(rate(http_request_duration_seconds_count[5m])) by (job)

      - record: job:http_request_latency_ok:rate30m
        expr: |
          sum(rate(http_request_duration_seconds_bucket{le="0.5"}[30m])) by (job)
          /
          sum(rate(http_request_duration_seconds_count[30m])) by (job)

      # === Error Budget Burn Rate ===
      # SLO target = 99.5% → allowed error rate = 0.005
      # Burn rate = (1 - SLI) / (1 - SLO)

      - record: job:http_slo_burn_rate:5m
        expr: |
          (1 - job:http_request_success:rate5m) / (1 - 0.995)

      - record: job:http_slo_burn_rate:30m
        expr: |
          (1 - job:http_request_success:rate30m) / (1 - 0.995)

      - record: job:http_slo_burn_rate:1h
        expr: |
          (1 - job:http_request_success:rate1h) / (1 - 0.995)

      - record: job:http_slo_burn_rate:6h
        expr: |
          (1 - job:http_request_success:rate6h) / (1 - 0.995)
Step 3: Multi-Window Multi-Burn-Rate Alerting
This is the most important concept in production SLO alerting. Google's SRE workbook defines a four-tier alerting strategy using two time windows at each tier:
| Tier | Short Window | Long Window | Burn Rate | Pages? | Budget Consumed in... |
|---|---|---|---|---|---|
| Critical | 5m | 1h | 14.4x | Yes (P1) | ~2 hours |
| High | 30m | 6h | 6x | Yes (P2) | ~5 hours |
| Medium | 2h | 24h | 3x | Ticket | ~10 hours |
| Low | 6h | 72h | 1x | Tracking | 30 days (baseline) |
The two-window requirement prevents false positives (short spikes trigger the short window but not the long window, so no alert fires) while ensuring responsiveness to sustained burns.
# prometheus/rules/slo-alerts.yaml
groups:
  - name: slo_burn_rate_alerts
    rules:

      # CRITICAL: Fast burn — page immediately
      # Both 5m AND 1h windows must exceed 14.4x burn rate
      - alert: SLOFastBurn
        expr: |
          job:http_slo_burn_rate:5m > 14.4
          and
          job:http_slo_burn_rate:1h > 14.4
        for: 2m
        labels:
          severity: critical
          team: platform
        annotations:
          summary: "CRITICAL: SLO fast burn on {{ $labels.job }}"
          description: |
            Service {{ $labels.job }} is burning error budget at {{ $value | printf "%.1f" }}x
            the sustainable rate. At this rate, the 30-day budget will be exhausted in
            approximately {{ (720 / $value) | printf "%.0f" }} hours.
            Current error rate: see Grafana SLO dashboard.
          runbook_url: "https://wiki.amtocsoft.com/runbooks/slo-fast-burn"

      # HIGH: Moderate fast burn — page with lower urgency
      - alert: SLOModerateHighBurn
        expr: |
          job:http_slo_burn_rate:30m > 6
          and
          job:http_slo_burn_rate:6h > 6
        for: 15m
        labels:
          severity: warning
          team: platform
        annotations:
          summary: "WARNING: SLO elevated burn on {{ $labels.job }}"
          description: |
            Service {{ $labels.job }} burn rate is {{ $value | printf "%.1f" }}x sustainable.
            30-day budget exhaustion in approximately {{ (120 / $value) | printf "%.0f" }} hours.
          runbook_url: "https://wiki.amtocsoft.com/runbooks/slo-elevated-burn"

      # MEDIUM: Slow burn — create ticket, no page
      - alert: SLOSlowBurn
        expr: |
          job:http_slo_burn_rate:2h > 3
          and
          job:http_slo_burn_rate:24h > 3
        for: 1h
        labels:
          severity: info
          team: platform
          action: ticket
        annotations:
          summary: "INFO: SLO slow burn on {{ $labels.job }}"
          description: |
            Service {{ $labels.job }} burn rate {{ $value | printf "%.1f" }}x —
            budget will exhaust in approximately 10 days at this rate.
            Review recent deploys, error trends, and infrastructure changes.
Step 4: Grafana Dashboard Configuration
The Grafana dashboard should expose four key panels for each service:
- SLI Trend — the raw availability/latency ratio over the SLO window
- Error Budget Remaining — percentage of budget left in the current window
- Burn Rate — current multi-window burn rate as a gauge
- Request Volume — total request rate to contextualize error counts
Here's the core PromQL for the Error Budget Remaining panel:
# Error budget remaining as a percentage (30-day window)
# SLO = 99.5%, so total budget = 0.5% of requests

(
  1 - (
    (
      sum(increase(http_requests_total{status_class="5xx", job="$service"}[30d]))
    )
    /
    (
      sum(increase(http_requests_total{job="$service"}[30d]))
      * (1 - 0.995)
    )
  )
) * 100
Set thresholds: green above 50%, yellow 10-50%, red below 10%. This gives engineers an at-a-glance signal they can act on without reading the burn rate math themselves.
Comparison and Tradeoffs
SLO Approaches: Pros, Cons, and When to Use Each
| Approach | Best For | Limitations |
|---|---|---|
| Request-based SLOs | HTTP APIs, gRPC services | Requires instrumented request counters |
| Time-based SLOs | Infrastructure health, batch jobs | Less granular, misses partial failures |
| Composite SLOs | Complex multi-service flows | Harder to implement, more maintenance |
| Synthetic SLOs | External-facing availability testing | Doesn't capture backend degradation |
| Latency SLOs | Latency-sensitive user flows | Need histogram buckets at SLO thresholds |
Request-based SLOs are the right default for most backend services. They measure what users actually experience (success or failure of individual interactions), they aggregate naturally over time windows, and they map cleanly onto the burn rate model.
Time-based SLOs work better for batch systems and infrastructure components where "requests" aren't meaningful. A database backup job either completes successfully in its window or it doesn't — that's better modeled as "minutes of successful operation" than as request success rate.
Composite SLOs attempt to capture end-to-end user journeys across multiple services. They're powerful for complex e-commerce or financial workflows where upstream service availability doesn't tell the full story, but they require careful dependency modeling and are significantly harder to maintain.
SLO Window Length Tradeoffs
| Window | Advantages | Disadvantages |
|---|---|---|
| 7-day rolling | Reacts faster to trends | More alert noise, budget recovered quickly |
| 28/30-day rolling | Standard, maps to billing cycles | Slow to respond to slow burns |
| Quarter | Strategic reliability view | Too slow for operational response |
| Calendar month | Maps to business reporting | Budget "resets" create perverse incentives |
Most teams use 30-day rolling windows for operational SLOs and quarterly aggregates for business reporting. Avoid calendar months — the "it resets on the 1st" dynamic encourages teams to exhaust their budget in the last week of the month.
SRE vs. Traditional Ops vs. DevOps
| Dimension | Traditional Ops | DevOps | SRE |
|---|---|---|---|
| Reliability target | Maximize uptime | Shared responsibility | Error budget |
| Dev velocity | Constrained by ops | Teams own their stack | Budget-gated |
| Failure response | Blame assignment | Post-deploy runbooks | Blameless postmortem |
| Toil management | Ad-hoc | Some automation | Explicit 50% cap |
| Alerting model | Threshold-based | Threshold-based | Burn rate / SLO-based |
| Relationship model | Dev vs Ops | Shared but informal | Embedded SREs, SLO contracts |
Production Considerations
Chaos Engineering as SLO Validation
In 2026, chaos engineering has moved from Netflix-scale curiosity to mainstream practice. Tools like Chaos Mesh, Litmus, and AWS Fault Injection Simulator make it straightforward to inject failures in production (or production-like staging) and validate that your SLO monitoring detects them correctly.
A chaos experiment workflow integrated with SLOs looks like this:
#!/bin/bash
# chaos-experiment.sh — validate SLO alerting responds to injected failures

EXPERIMENT_NAME="latency-injection-api-gateway"
TARGET_SERVICE="api-gateway"
CHAOS_DURATION="300"  # 5 minutes

echo "[chaos] Starting experiment: $EXPERIMENT_NAME"
echo "[chaos] Recording baseline error budget..."

BASELINE_BUDGET=$(curl -s "http://prometheus:9090/api/v1/query" \
  --data-urlencode 'query=job:http_slo_error_budget_remaining:30d{job="api-gateway"}' \
  | jq -r '.data.result[0].value[1]')

echo "[chaos] Baseline budget remaining: ${BASELINE_BUDGET}%"

# Inject 200ms latency using Chaos Mesh
cat <<EOF | kubectl apply -f -
apiVersion: chaos-mesh.org/v1alpha1
kind: NetworkChaos
metadata:
  name: ${EXPERIMENT_NAME}
  namespace: default
spec:
  action: delay
  mode: all
  selector:
    namespaces: [default]
    labelSelectors:
      "app": "${TARGET_SERVICE}"
  delay:
    latency: "200ms"
    jitter: "50ms"
  duration: "${CHAOS_DURATION}s"
EOF

echo "[chaos] Latency injection active — monitoring for burn rate alert..."

# Wait and check if alert fired
sleep 360
ALERTS=$(curl -s "http://alertmanager:9093/api/v2/alerts" \
  | jq '[.[] | select(.labels.alertname == "SLOModerateHighBurn")]')

echo "[chaos] Alerts fired during experiment:"
echo "$ALERTS" | jq '.[].annotations.summary'

# Clean up
kubectl delete networkchaos ${EXPERIMENT_NAME}
echo "[chaos] Experiment complete. Check Grafana for budget impact."
Run chaos experiments at least quarterly, targeting different failure modes: latency injection, error injection, dependency outages, resource exhaustion. Document results in your runbooks — this is how you build confidence that your SLO monitoring will actually catch real incidents.
Toil Measurement and Reduction
SRE teams track toil explicitly. A simple toil ledger captures the recurring work that scales with service growth:
## Toil Inventory — Q2 2026

| Task | Frequency | Time/occurrence | Monthly hours | Automatable? |
|------|-----------|-----------------|---------------|--------------|
| Manual deployment approval for non-prod | Daily | 15min | 5h | Yes — auto-approve staging |
| Certificate rotation reminders | Monthly | 2h | 2h | Yes — cert-manager |
| Log archive cleanup | Weekly | 30min | 2h | Yes — lifecycle policy |
| Capacity scaling review | Weekly | 1h | 4h | Partial — HPA covers 80% |
| On-call handoff documentation | Weekly | 45min | 3h | Partial — auto-generated report |
| Manual SLO report for stakeholders | Monthly | 3h | 3h | Yes — Grafana reporting |

Total tracked toil: ~19h/month out of ~80h engineering = 24% (within 50% cap)
Priority automation targets: cert-manager, log lifecycle policy, Grafana reporting
Automation that eliminates toil directly improves reliability by reducing human error in repetitive operations. Every hour of toil eliminated is an hour recovered for reliability engineering that compounds over time.
Blameless Postmortem Structure
The postmortem is the most culturally significant artifact in SRE. A well-executed postmortem converts an incident into organizational learning. A poorly executed one (with blame) teaches engineers to hide problems. Here's the template structure that works:
# Postmortem: [Incident Title]

**Date**: YYYY-MM-DD
**Duration**: HH:MM — HH:MM UTC (X hours Y minutes)
**Severity**: P1 / P2 / P3
**Error Budget Impact**: X% of monthly budget consumed
**Author(s)**: [Names]
**Status**: Draft / In Review / Final

## Summary
One paragraph. What happened, what the user impact was, and what resolved it.
Written for an executive audience — no jargon.

## Timeline (UTC)
| Time | Event |
|------|-------|
| HH:MM | Anomaly first detectable in metrics |
| HH:MM | SLO burn rate alert fired |
| HH:MM | On-call acknowledged |
| HH:MM | Impact confirmed, incident declared |
| HH:MM | Root cause identified |
| HH:MM | Mitigation applied |
| HH:MM | Service fully recovered |
| HH:MM | Incident closed |

## Root Cause Analysis
What was the technical cause? Describe the contributing factors:
- Immediate cause (what triggered the failure)
- Contributing factors (what made it possible)
- Detection gaps (what slowed discovery)
- Response gaps (what slowed recovery)

Do NOT name individuals. Focus on systems, processes, and tooling.

## Impact Assessment
- User-visible impact: describe what users experienced
- Affected services: list impacted services and dependencies
- Error budget consumed: X of Y requests failed (Z% of monthly budget)

## What Went Well
- List things the team did right during the incident
- Include tooling, processes, and individual decisions

## What Could Be Improved
- Systemic gaps revealed by this incident
- Process breakdowns or missing automation

## Action Items
| Item | Owner | Due | Priority |
|------|-------|-----|----------|
| Add retry logic to dependent service calls | Platform team | 2026-05-01 | High |
| Add circuit breaker to payment service | Payments team | 2026-05-15 | High |
| Tune SLO alert thresholds for this failure mode | SRE | 2026-04-30 | Medium |
Track action items in your issue tracker with due dates. Review completion in the next monthly SRE review. Postmortems that generate action items that go nowhere are worse than no postmortem — they teach engineers that the process is theater.
Scaling SLO Monitoring: The Full Stack
In 2026, the reference stack for production SLO monitoring is:
- Instrumentation: OpenTelemetry SDK (language-native) exporting to Prometheus format
- Collection: Prometheus with recording rules for SLI/burn rate pre-computation
- Long-term storage: Thanos or Grafana Mimir for multi-month retention (required for 30-day SLOs)
- Alerting: Alertmanager with multi-window burn rate rules → PagerDuty/OpsGenie for P1/P2
- Dashboards: Grafana with Pyrra or Sloth for SLO dashboard generation
- Chaos testing: Chaos Mesh (Kubernetes) or AWS FIS for regular validation
Pyrra and Sloth deserve a special mention. These tools take SLO definitions as CRDs (Custom Resource Definitions) and automatically generate the Prometheus recording rules, alerting rules, and Grafana dashboards:
# pyrra/slo-api-gateway.yaml
apiVersion: pyrra.dev/v1alpha1
kind: ServiceLevelObjective
metadata:
  name: api-gateway-availability
  namespace: monitoring
spec:
  description: "API Gateway HTTP availability SLO"
  target: "99.5"
  window: 30d
  serviceMonitorSelector:
    matchLabels:
      app: api-gateway
  indicator:
    ratio:
      errors:
        metric: http_requests_total{job="api-gateway",status_class="5xx"}
      total:
        metric: http_requests_total{job="api-gateway"}
Pyrra reads this definition and generates all the recording rules, burn rate alerts, and a pre-built Grafana dashboard. For teams managing dozens of services, this is the difference between SLO practice being sustainable or becoming a maintenance burden.
Conclusion
SRE is not a role — it's a practice, a set of principles, and a cultural shift in how engineering organizations think about reliability. The core insight that unlocked it all: reliability has a cost, unreliability has a cost, and the right amount of each depends on your users, your business, and your engineering velocity.
SLIs give you a precise, user-focused measure of reliability. SLOs give your team a shared target and the operational tools to make good decisions. Error budgets convert that target into a currency that aligns development velocity with reliability investment. Burn rate alerting gives you early warning before users notice. Blameless postmortems convert failures into learning. Toil reduction converts manual work into engineering capacity.
For developers making the transition to reliability thinking, the practical starting point is simple: instrument your service, define one SLI, set one SLO, and build a burn rate alert. You don't need the full Pyrra stack on day one. You need one dashboard that tells you whether your service is burning budget faster than it can recover, and one alert that wakes someone up when it is.
From that foundation, every piece of this guide builds naturally. Run a chaos experiment to validate your alerting. Write your first postmortem. Track your first toil item and automate it away. Expand to latency SLOs. Add composite SLOs for critical user journeys. Adopt Pyrra or Sloth to scale SLO management across dozens of services.
The teams that do this well don't just have more reliable services — they ship faster, have fewer midnight incidents, and spend their engineering time on work that matters. That's the real promise of SRE in 2026.
Sources
- Google SRE Book — Site Reliability Engineering — Free online; Chapters 2 (Production Environment), 4 (SLOs), and 13 (Emergency Response) are particularly relevant
- Google SRE Workbook — Practical examples for SLI/SLO implementation and error budget policy
- DORA Research — Accelerate State of DevOps — Elite performer deployment frequency and MTTR metrics referenced in the intro
- Sloth — SLO generator for Prometheus — Prometheus rule-generation tool used in the SLO-as-code section
- Pyrra — SLO framework — Multi-window, multi-burn-rate alerting framework demonstrated in the alerting section
- Prometheus — Alerting on SLOs (multi-window, multi-burn-rate) — Prometheus documentation behind the burn-rate alert design
- Chaos Monkey — Netflix — Chaos engineering tool referenced in the fault injection section
- AWS — Well-Architected Reliability Pillar — Cloud-specific reliability patterns and failure mode analysis
About the Author
Toc Am
Founder of AmtocSoft. Writing practical deep-dives on AI engineering, cloud architecture, and developer tooling. Previously built backend systems at scale. Reviews every post published under this byline.
Published: 2026-04-15 · Written with AI assistance, reviewed by Toc Am.
Get These In Your Inbox
Weekly deep-dives on AI engineering, no fluff. Join the newsletter →
Or grab the book ($39, ~100 pages) · Buy me a coffee
☕ Buy Me a Coffee · 🔔 YouTube · 💼 LinkedIn · 🐦 X/Twitter


No comments:
Post a Comment