
Introduction
The Kubernetes documentation will teach you how to write a Deployment. The tutorials will show you how to expose it with a Service. The YouTube videos will walk you through setting up a local cluster with Minikube. None of them will prepare you for 3am when your cluster autoscaler is not scaling, your nodes are out of capacity, half your pods are in OOMKilled loops, and your on-call engineer is staring at Grafana trying to figure out which of the six different resource limit configurations is lying to them.
Kubernetes has a remarkably well-documented surface. The parts nobody writes about are the operational realities that only become visible when your cluster is running real workloads at real scale: the resource request and limit traps that cause cascading failures, the subtle differences between liveness and readiness probes that turn a single unhealthy pod into a cluster-wide outage, the RBAC anti-patterns that quietly give service accounts more access than they need, and the cost optimization levers that most teams leave untouched until their cloud bill reaches a number that cannot be ignored.
This post is a collection of hard-won production knowledge. It is written for engineers who understand Kubernetes fundamentals — they can write Deployments, Services, and ConfigMaps — and want to understand what it actually means to run Kubernetes responsibly at scale. We will cover resource management, autoscaling architectures, pod scheduling, disruption budgets, probe configuration, secrets and ConfigMap rotation, network policy fundamentals, and real incident scenarios with their root causes and fixes.
This is not the documentation. This is what happens after you follow the documentation.
Resource Requests and Limits: The OOMKilled Trap
Of all the Kubernetes configuration mistakes that cause production incidents, the most common by a wide margin is incorrect resource requests and limits. The confusing part is that the documentation explains the mechanics clearly — the damage comes from not understanding the downstream effects.
What Requests and Limits Actually Do
A resource request is a scheduling hint. The Kubernetes scheduler places your pod on a node that has at least that much CPU and memory available. Once the pod is running, the request does not enforce anything — a pod with a 100m CPU request can use 4000m CPU if the node has spare capacity.
A resource limit is an enforcement boundary. CPU limits are implemented via Linux cgroups and result in CPU throttling when a container exceeds its limit. Memory limits are enforced strictly: when a container exceeds its memory limit, it is killed immediately with an OOMKilled exit code. The pod will restart (per its restart policy), hit the memory limit again, restart again, and enter a CrashLoopBackOff death spiral.
This asymmetry is the source of most production resource incidents:
| CPU | Memory | |
|---|---|---|
| Exceeds request | Allowed (uses spare capacity) | Allowed |
| Exceeds limit | Throttled (slows down) | Killed immediately |
| Effect | Performance degradation | Pod restart / crash loop |
| Detection | High throttle ratio in metrics | OOMKilled in pod events |
The Three Anti-Patterns
Anti-pattern 1: Memory limit = memory request. Setting requests.memory: "512Mi" and limits.memory: "512Mi" looks clean and predictable. In practice, many applications have unpredictable memory usage — a JVM application's memory usage includes heap, metaspace, direct memory, and thread stacks, all of which fluctuate. Setting the limit exactly equal to the request means any spike above your estimated steady-state usage kills the container. Instead, set the limit 1.5x to 2x the request for applications with variable memory usage, and monitor actual memory usage to tune both over time.
Anti-pattern 2: No requests set at all. Without resource requests, all your pods land in the BestEffort QoS class. Kubernetes will evict BestEffort pods first when a node is under memory pressure. This means your application silently disappears when any node gets busy — no alerts, no CrashLoopBackOff, just pods gone. Always set at least memory requests on every container.
Anti-pattern 3: CPU limits in latency-sensitive services. CPU limits are implemented via CFS (Completely Fair Scheduler) bandwidth control. At high request rates, CPU throttling introduces latency spikes that are difficult to diagnose because the application's CPU usage metrics look fine (they show utilization, not throttle time). For latency-sensitive services, consider setting CPU requests without CPU limits — this gives the scheduler accurate placement information while allowing bursting. Monitor container_cpu_cfs_throttled_seconds_total to detect throttling.
# Good resource configuration for a latency-sensitive API
resources:
  requests:
    memory: "256Mi"   # Conservative estimate — scheduler uses this
    cpu: "200m"       # Accurate estimate — affects scheduling quality
  limits:
    memory: "512Mi"   # 2x request — room for GC spikes, caching, etc.
    # No CPU limit — avoids throttle-induced latency spikes
    # Monitor cpu_cfs_throttled_seconds if you add one later
# Good resource configuration for a batch/background worker
resources:
  requests:
    memory: "512Mi"
    cpu: "500m"
  limits:
    memory: "1Gi"     # 2x request
    cpu: "2000m"      # Limit is acceptable for batch — latency is less critical
Diagnosing Resource Problems in Production
# Check which pods are being OOMKilled
kubectl get pods -A | grep -i oom
kubectl get events -A | grep OOMKill

# Check actual memory usage vs limits (requires metrics-server)
kubectl top pods -A --sort-by=memory

# Check CPU throttle ratio (requires Prometheus)
# High values (>0.25) indicate CPU limit is too low
rate(container_cpu_cfs_throttled_seconds_total[5m]) /
rate(container_cpu_cfs_periods_total[5m])

# Find pods with no resource requests (BestEffort QoS)
kubectl get pods -A -o json | jq -r '
  .items[] |
  select(.spec.containers[].resources.requests == null) |
  "\(.metadata.namespace)/\(.metadata.name)"
'
Autoscaling: HPA vs VPA vs KEDA
Kubernetes provides three autoscaling mechanisms that operate at different layers. Understanding when to use each — and how they interact — is essential for cost-efficient, reliable production deployments.
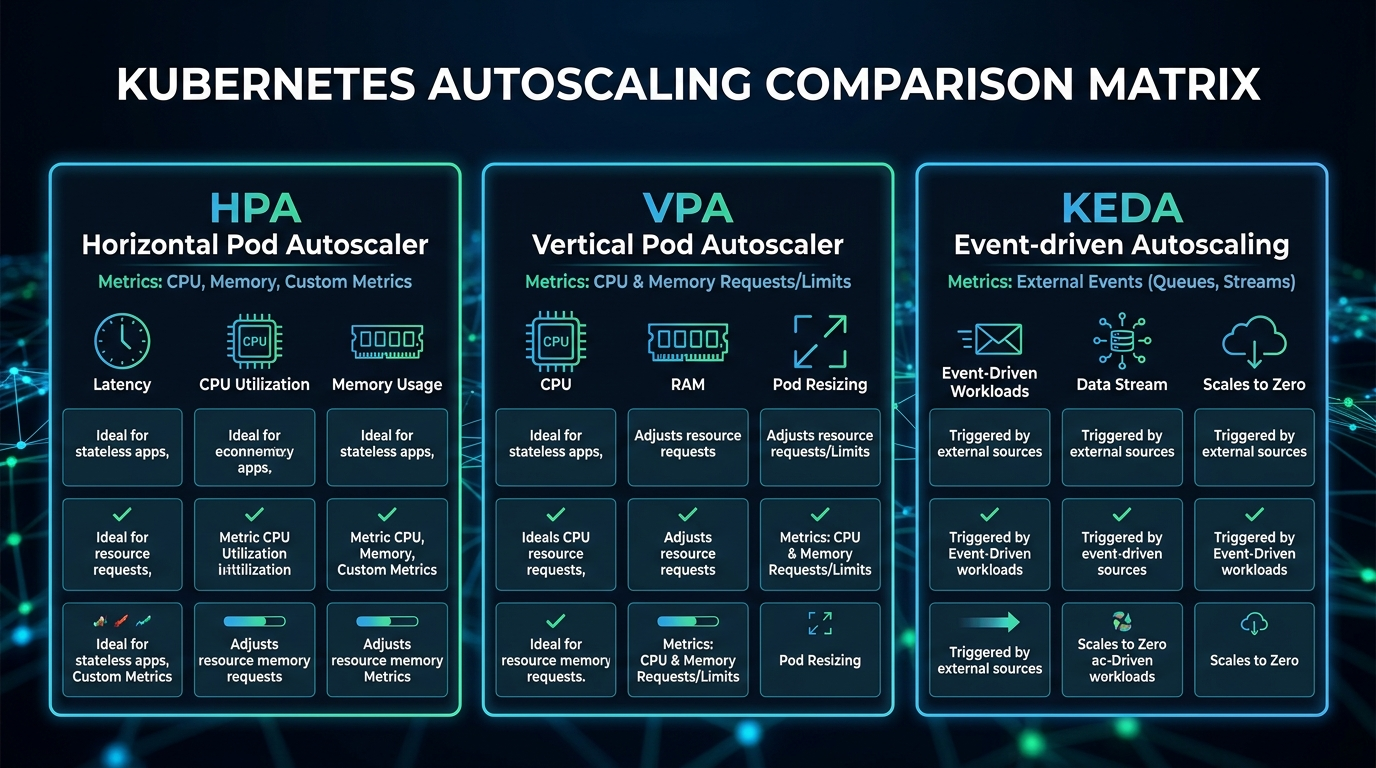
HPA: Horizontal Pod Autoscaler
HPA adds or removes pod replicas based on observed metrics. It is the right tool when your workload can be horizontally distributed (stateless APIs, workers) and when traffic varies significantly over time.
# hpa.yaml — scale based on CPU and custom metrics simultaneously
apiVersion: autoscaling/v2
kind: HorizontalPodAutoscaler
metadata:
  name: api-service-hpa
  namespace: production
spec:
  scaleTargetRef:
    apiVersion: apps/v1
    kind: Deployment
    name: api-service
  minReplicas: 3          # Never go below 3 — one per AZ minimum
  maxReplicas: 50
  metrics:
    # Primary: CPU utilization
    - type: Resource
      resource:
        name: cpu
        target:
          type: Utilization
          averageUtilization: 70   # Scale up when average CPU hits 70%
    # Secondary: custom metric from Prometheus
    - type: Pods
      pods:
        metric:
          name: http_requests_per_second
        target:
          type: AverageValue
          averageValue: "1000"     # 1000 req/s per pod before scaling up
  behavior:
    scaleUp:
      stabilizationWindowSeconds: 60    # Wait 60s before scaling up again
      policies:
        - type: Pods
          value: 4                       # Add at most 4 pods at a time
          periodSeconds: 60
    scaleDown:
      stabilizationWindowSeconds: 300   # Wait 5 min before scaling down — avoid flapping
      policies:
        - type: Percent
          value: 10                      # Remove at most 10% of pods per minute
          periodSeconds: 60
HPA gotcha: HPA reads resource metrics from the metrics-server (for CPU/memory) or from a custom metrics adapter (for Prometheus metrics). If the metrics-server is unavailable or slow, HPA stops scaling. Always monitor your metrics-server's availability, and make sure it has enough resources — it is a critical path component for autoscaling.
VPA: Vertical Pod Autoscaler
VPA adjusts CPU and memory requests automatically based on observed usage, rather than adding replicas. It is useful for singleton services (databases, stateful sets), batch jobs, and any workload where you do not know the right resource requests at deployment time.
VPA has three operating modes:
Off(recommendation mode): VPA calculates recommendations but does not apply them. Useful for right-sizing existing deployments.Initial: VPA only sets resources when a pod is first created. Existing pods are not affected.Auto: VPA evicts and recreates pods to apply new resource recommendations. This causes pod restarts.
# vpa.yaml — recommendation mode for right-sizing
apiVersion: autoscaling.k8s.io/v1
kind: VerticalPodAutoscaler
metadata:
  name: api-service-vpa
  namespace: production
spec:
  targetRef:
    apiVersion: apps/v1
    kind: Deployment
    name: api-service
  updatePolicy:
    updateMode: "Off"   # Recommendation only — inspect with kubectl describe vpa
  resourcePolicy:
    containerPolicies:
      - containerName: api-service
        minAllowed:
          memory: "128Mi"
          cpu: "50m"
        maxAllowed:
          memory: "2Gi"
          cpu: "4000m"
        controlledResources: ["cpu", "memory"]
Important: Do not run HPA and VPA in Auto mode on the same deployment for the same metrics. HPA and VPA can conflict — VPA wants to resize pods while HPA wants to scale replicas, leading to thrashing. The safe combination: HPA on CPU/custom metrics for scaling replicas, VPA in Off mode for right-sizing recommendations that you apply manually.
KEDA: Kubernetes Event-Driven Autoscaling
KEDA extends HPA to scale based on event sources — Kafka consumer group lag, RabbitMQ queue depth, AWS SQS queue length, Prometheus queries, cron schedules, and 50+ other scalers. Critically, KEDA can scale to zero, which HPA cannot do.
# keda-scaledobject.yaml — scale workers based on Kafka lag
apiVersion: keda.sh/v1alpha1
kind: ScaledObject
metadata:
  name: kafka-consumer-scaler
  namespace: production
spec:
  scaleTargetRef:
    apiVersion: apps/v1
    kind: Deployment
    name: order-processor
  minReplicaCount: 0    # Scale to zero when queue is empty — saves cost
  maxReplicaCount: 20
  pollingInterval: 15   # Check every 15 seconds
  cooldownPeriod: 300   # Wait 5 min before scaling down after queue drains
  triggers:
    - type: kafka
      metadata:
        bootstrapServers: kafka-broker:9092
        consumerGroup: order-processors
        topic: orders
        lagThreshold: "100"      # One worker per 100 messages of lag
        offsetResetPolicy: latest
KEDA is the right choice for:
- Queue/event-driven consumers where idle capacity is pure waste
- Batch workloads with predictable schedules (cron-based scaling)
- Any workload where true scale-to-zero makes economic sense
Pod Scheduling: Affinity, Anti-Affinity, and Disruption Budgets
Why Anti-Affinity Is Not Optional for Production
If you run three replicas of a critical service and all three land on the same node, your "three-replica HA setup" is actually a single point of failure. Node hardware failure, kernel panic, or a bad kubectl drain wipes all three pods simultaneously.
# Pod anti-affinity: spread pods across availability zones
spec:
  affinity:
    podAntiAffinity:
      # Hard rule: never schedule two pods of this app on the same AZ
      requiredDuringSchedulingIgnoredDuringExecution:
        - labelSelector:
            matchLabels:
              app: api-service
          topologyKey: topology.kubernetes.io/zone
      # Soft rule: prefer different nodes within an AZ
      preferredDuringSchedulingIgnoredDuringExecution:
        - weight: 100
          podAffinityTerm:
            labelSelector:
              matchLabels:
                app: api-service
            topologyKey: kubernetes.io/hostname
In 2026, topologySpreadConstraints is the preferred approach over pod anti-affinity for most use cases — it gives you more precise control:
# Topology spread: distribute pods evenly across zones and nodes
spec:
  topologySpreadConstraints:
    # Spread across availability zones
    - maxSkew: 1                          # At most 1 more pod in any zone than others
      topologyKey: topology.kubernetes.io/zone
      whenUnsatisfiable: DoNotSchedule    # Hard requirement
      labelSelector:
        matchLabels:
          app: api-service
    # Also spread across individual nodes
    - maxSkew: 2                          # Allow up to 2 more pods on any node
      topologyKey: kubernetes.io/hostname
      whenUnsatisfiable: ScheduleAnyway   # Soft preference
      labelSelector:
        matchLabels:
          app: api-service
Pod Disruption Budgets: Your Last Line of Defense
A PodDisruptionBudget (PDB) defines the minimum number of pods that must remain available during voluntary disruptions — node drains for maintenance, cluster upgrades, and kubectl drain operations. Without a PDB, kubectl drain will evict all pods from a node simultaneously, potentially taking your entire service offline during what should be a routine maintenance operation.
# pdb.yaml — always configure this for production workloads
apiVersion: policy/v1
kind: PodDisruptionBudget
metadata:
  name: api-service-pdb
  namespace: production
spec:
  # Require that at least 2 pods are always available
  # For a 3-replica deployment, this means at most 1 can be disrupted at a time
  minAvailable: 2
  # Alternative: maxUnavailable: 1  (same result for 3 replicas, more flexible for HPA)
  selector:
    matchLabels:
      app: api-service
PDB gotcha: If your HPA scales down to minReplicas and your PDB requires minAvailable: 2, the PDB will block node drains because there is no slack. Either set minAvailable as a percentage (minAvailable: "50%") or ensure your HPA minReplicas is always greater than your minAvailable count.
Probes: The Configuration Mistakes That Cause Outages
The three Kubernetes probe types — liveness, readiness, and startup — are conceptually simple but operationally treacherous. Misconfiguring them is one of the most common causes of self-inflicted production incidents.
The Three Probes and Their Distinct Roles
Liveness probe: Answers "Is this container alive and worth keeping?" A failing liveness probe causes the container to be killed and restarted. Use this for detecting deadlocks and zombie states — conditions where the application process is running but cannot make progress and will never recover on its own. Do NOT use the liveness probe to check upstream dependencies (databases, caches). If your database goes down, failing the liveness probe causes all your pods to restart in a loop, turning a recoverable database outage into a full application outage.
Readiness probe: Answers "Is this container ready to accept traffic?" A failing readiness probe removes the pod from Service endpoints so no new requests are routed to it, but the container is not killed. Use this to signal that the application is warming up (loading caches, establishing connection pools, processing a backlog), or that it is temporarily overwhelmed and wants to stop receiving new traffic. It is appropriate to check upstream dependencies in the readiness probe.
Startup probe: Answers "Has this container finished starting up?" It runs exclusively until it succeeds (after which the liveness and readiness probes begin). It is essential for slow-starting applications (JVM applications, applications loading large ML models) where you need generous startup time without making the liveness probe's failureThreshold so high that it delays detection of runtime failures.
# Well-configured probes for a Node.js API
livenessProbe:
  httpGet:
    path: /health/live    # Returns 200 if process is running and not deadlocked
    port: 3000            # Does NOT check database connectivity
  initialDelaySeconds: 30 # Grace period after container starts
  periodSeconds: 10
  timeoutSeconds: 5
  failureThreshold: 3     # Kill after 3 consecutive failures (30s window)

readinessProbe:
  httpGet:
    path: /health/ready   # Returns 200 only if DB connection is healthy,
    port: 3000            # cache is warm, and service is accepting load
  initialDelaySeconds: 10
  periodSeconds: 5
  timeoutSeconds: 3
  failureThreshold: 3     # Stop receiving traffic after 3 failures (15s)
  successThreshold: 2     # Require 2 consecutive passes before re-adding to LB

startupProbe:
  httpGet:
    path: /health/live
    port: 3000
  failureThreshold: 30    # 30 attempts × 10s = 5 minutes for startup
  periodSeconds: 10
The corresponding health check implementation in Node.js:
// health.js — production-grade health check implementation
const express = require('express');
const router = express.Router();

// Liveness: is the process alive and responsive?
// Keep this CHEAP and independent of external dependencies.
router.get('/health/live', (req, res) => {
  // Check for internal deadlock indicators
  const memUsage = process.memoryUsage();
  const heapUsedMB = memUsage.heapUsed / 1024 / 1024;

  // Fail liveness if heap usage is suspiciously high (possible memory leak)
  if (heapUsedMB > 1800) { // 1.8GB — approaching our 2GB limit
    return res.status(503).json({
      status: 'unhealthy',
      reason: 'heap_near_limit',
      heapUsedMB: Math.round(heapUsedMB)
    });
  }

  res.json({ status: 'alive', uptime: process.uptime() });
});

// Readiness: is the service ready to accept requests?
// Check external dependencies here — it is safe to do so.
router.get('/health/ready', async (req, res) => {
  const checks = await Promise.allSettled([
    checkDatabase(),
    checkRedisConnection(),
    checkWarmupComplete()
  ]);

  const allHealthy = checks.every(c => c.status === 'fulfilled' && c.value === true);

  if (!allHealthy) {
    const failures = checks
      .map((c, i) => ({ name: ['database', 'redis', 'warmup'][i], ok: c.status === 'fulfilled' }))
      .filter(c => !c.ok)
      .map(c => c.name);

    return res.status(503).json({ status: 'not_ready', failing: failures });
  }

  res.json({ status: 'ready' });
});

// Internal: check if cache warmup is complete
let warmupComplete = false;
async function runWarmup() {
  // Load frequently-accessed data into memory cache
  await prefetchTopCategories();
  await prefetchConfigFromDB();
  warmupComplete = true;
  console.log('Warmup complete — pod is now ready');
}

function checkWarmupComplete() {
  return Promise.resolve(warmupComplete);
}

runWarmup(); // Run on startup — readiness probe will fail until complete
ConfigMap and Secret Rotation Without Restarts
A frustrating default Kubernetes behavior: when you update a ConfigMap or Secret, pods that have mounted them as volumes will see the updated values on disk within ~60 seconds (the kubelet's sync interval). But pods using envFrom or individual env.valueFrom.secretKeyRef entries will never see the updated values without a pod restart.
For most configuration, this is fine — you trigger a rolling restart as part of the deploy. But for secrets that rotate automatically (TLS certificates, database credentials rotated by AWS Secrets Manager), requiring a pod restart every time a secret rotates is operationally painful and can cause brief unavailability.
Pattern 1: Volume Mounts for Rotating Secrets
Mount the Secret as a volume instead of injecting it as an environment variable. The application reads the file at runtime, detecting changes and reloading without restart:
spec:
  containers:
  - name: api-service
    volumeMounts:
    - name: db-credentials
      mountPath: /etc/secrets/db
      readOnly: true
  volumes:
  - name: db-credentials
    secret:
      secretName: db-credentials
      # Optional: set defaultMode to restrict file permissions
      defaultMode: 0400
// Reload credentials from file on each connection (not just at startup)
const fs = require('fs');

function getDatabaseCredentials() {
  // Read fresh credentials on every pool creation
  // This handles automatic secret rotation gracefully
  const creds = JSON.parse(
    fs.readFileSync('/etc/secrets/db/credentials.json', 'utf8')
  );
  return {
    host: creds.host,
    username: creds.username,
    password: creds.password,  // Picks up rotated password automatically
    database: creds.database
  };
}
Pattern 2: Reloader for Environment Variable Secrets
For applications that cannot easily reload configuration at runtime, Reloader is a Kubernetes controller that watches ConfigMaps and Secrets and triggers rolling restarts of Deployments when they change:
# Deployment with Reloader annotation
apiVersion: apps/v1
kind: Deployment
metadata:
  name: api-service
  annotations:
    # Trigger rolling restart when this specific Secret changes
    secret.reloader.stakater.com/reload: "api-service-secrets"
    # Or: trigger on ANY configmap/secret change
    reloader.stakater.com/auto: "true"
RBAC Patterns: Least Privilege at Scale
The most dangerous RBAC mistake in Kubernetes is giving workloads cluster-admin or overly broad permissions "to make it work." A compromised pod with cluster-admin can read all Secrets, delete all Deployments, and create new privileged pods across the entire cluster.
Follow these RBAC rules in production:
Rule 1: Namespace-scoped Roles, not ClusterRoles, for application service accounts. Most application workloads only need to read their own ConfigMaps or create Jobs in their own namespace. Use Role (namespace-scoped) rather than ClusterRole (cluster-wide).
Rule 2: Never bind cluster-admin to a service account. If a controller genuinely needs cluster-wide access (ArgoCD, cert-manager, the cluster autoscaler), create a minimal ClusterRole with exactly the resources and verbs required.
Rule 3: Audit all ServiceAccount token mounts. By default, Kubernetes mounts a ServiceAccount token into every pod at /var/run/secrets/kubernetes.io/serviceaccount/token. For pods that do not need to call the Kubernetes API at all, set automountServiceAccountToken: false.
# Minimal RBAC for an application that only reads its own ConfigMaps
apiVersion: v1
kind: ServiceAccount
metadata:
  name: api-service
  namespace: production
automountServiceAccountToken: false  # Disable default token mount
---
apiVersion: rbac.authorization.k8s.io/v1
kind: Role
metadata:
  name: api-service-role
  namespace: production
rules:
  - apiGroups: [""]
    resources: ["configmaps"]
    resourceNames: ["api-service-config"]  # Scope to specific resource by name
    verbs: ["get", "watch"]
---
apiVersion: rbac.authorization.k8s.io/v1
kind: RoleBinding
metadata:
  name: api-service-binding
  namespace: production
subjects:
  - kind: ServiceAccount
    name: api-service
    namespace: production
roleRef:
  kind: Role
  name: api-service-role
  apiGroup: rbac.authorization.k8s.io
Cost Optimization: Spot Nodes and the Cluster Autoscaler
Running Kubernetes on cloud-managed clusters (EKS, GKE, AKS) without cost optimization can be expensive. The most impactful levers are spot/preemptible instances and the Cluster Autoscaler.
Mixed Instance Groups with Spot Nodes
On AWS EKS, a common pattern is to use two node groups:
- On-demand group (small): 2-3 nodes, always running, for critical system components (monitoring, ingress controllers, GitOps controllers)
- Spot group (large): scales from 0 to many nodes, for application workloads
This architecture can reduce EC2 costs by 60-80% for variable workloads. The key is making your application pods tolerate spot interruptions gracefully:
# Deployment tolerating spot nodes with graceful disruption handling
spec:
  template:
    spec:
      # Allow scheduling on spot nodes
      tolerations:
        - key: "spot-instance"
          operator: "Equal"
          value: "true"
          effect: "NoSchedule"
      # Prefer spot nodes but fall back to on-demand
      affinity:
        nodeAffinity:
          preferredDuringSchedulingIgnoredDuringExecution:
            - weight: 90
              preference:
                matchExpressions:
                  - key: node-lifecycle
                    operator: In
                    values: ["spot"]
      # Give pods 60 seconds to finish in-flight requests on spot interruption
      terminationGracePeriodSeconds: 60
  strategy:
    rollingUpdate:
      maxUnavailable: 1     # Never take more than 1 pod offline during disruption
      maxSurge: 2           # Allow 2 extra pods during rollout for fast replacement
Real Incident Scenarios
Incident 1: The Silent OOMKill Loop
Symptoms: API response rate drops 40% during peak traffic. No errors in application logs. Pod restart count climbs steadily.
Root cause: Memory limit was set at 256Mi based on startup measurements. Under peak load, the Node.js heap grew to 280Mi during a cache miss storm. Pods were being OOMKilled every 8-12 minutes, just infrequently enough that no alert fired, but frequently enough to significantly impact capacity.
Fix: Doubled memory limit to 512Mi. Added container_oom_events_total alert. Added heap size telemetry to application metrics.
Incident 2: The Readiness Probe Cascade
Symptoms: During a database maintenance window, 100% of API pods became unavailable within 60 seconds. Load balancer returned 503 to all traffic.
Root cause: The liveness probe (not readiness) was checking database connectivity. When the database went into maintenance mode, liveness probes failed, Kubernetes restarted all pods, the new pods immediately failed their liveness probes, and the restart loop prevented any pods from reaching Running state.
Fix: Separated liveness (process health only) from readiness (dependency health). Database connectivity check moved to readiness probe only. Liveness probe reduced to checking an in-process health flag.
Incident 3: The Node Drain Outage
Symptoms: Routine EKS node version upgrade caused a 90-second full outage of the payments service.
Root cause: kubectl drain evicted all three payment service pods simultaneously. No PDB was configured. The rolling restart of the Deployment took 90 seconds as new pods passed health checks.
Fix: Added PDB with minAvailable: 2. Updated cluster upgrade runbook to validate all critical services have PDBs before any drain operation.
Conclusion
The gap between "running Kubernetes" and "running Kubernetes well in production" is wider than most teams expect. The challenges in this post — resource tuning, autoscaling architecture, probe configuration, RBAC hygiene, secret rotation, and cost optimization — are not edge cases. They are the table stakes for operating a cluster that your organization can rely on.
The pattern that emerges from all of these lessons is the same: Kubernetes defaults are optimized for developer experience and ease of getting started, not for production resilience. Every production cluster needs deliberate configuration to add the safety margins and operational controls that the defaults omit.
Start with the fundamentals: set resource requests and limits on every container, configure all three probe types for every service, add PDBs to everything critical, and implement pod anti-affinity to spread across zones. These four changes alone will make your cluster significantly more resilient than the typical Kubernetes deployment.
Layer in GitOps (covered in the companion post on ArgoCD and Flux), observability with OpenTelemetry, and KEDA-based autoscaling as your operational maturity grows. The investment pays compound returns: every incident you prevent is a production outage your team does not have to debug at 3am.
The best Kubernetes clusters are the boring ones — the ones where nothing exciting ever happens, because every failure mode was anticipated and handled before it could become an incident.
Sources
- Kubernetes — Configure Quality of Service for Pods — Official reference for Guaranteed/Burstable/BestEffort QoS classes used throughout the resource-tuning section
- Kubernetes — Resource Management for Pods and Containers — Requests, limits, and eviction semantics
- Kubernetes — Configure Liveness, Readiness and Startup Probes — Canonical probe reference behind the cascade-failure incident
- Kubernetes — Specifying a Disruption Budget (PDB) — Reference for the
minAvailable: 2fix in Incident 3 - KEDA — Kubernetes Event-Driven Autoscaling — Scalers and scaling architecture used in the autoscaling section
- Kubernetes — Horizontal Pod Autoscaler — HPA v2 metrics and behavior tuning
- External Secrets Operator — Pattern used for secret rotation without kubelet restarts
- SPIFFE/SPIRE documentation — Workload-identity pattern referenced in the RBAC and service-to-service auth discussion
- Kubernetes — Pod Security Standards — Baseline/Restricted profiles behind the securityContext hardening advice
- Cilium Network Policies — eBPF-based policy engine referenced in the network-policy examples
- OpenCost — CNCF project used for per-namespace and per-workload cost attribution
About the Author
Toc Am
Founder of AmtocSoft. Writing practical deep-dives on AI engineering, cloud architecture, and developer tooling. Previously built backend systems at scale. Reviews every post published under this byline.
Published: 2026-04-15 · Updated: 2026-04-18 · Written with AI assistance, reviewed by Toc Am.
Get These In Your Inbox
Weekly deep-dives on AI engineering, no fluff. Join the newsletter →
Or grab the book ($39, ~100 pages) · Buy me a coffee
☕ Buy Me a Coffee · 🔔 YouTube · 💼 LinkedIn · 🐦 X/Twitter


No comments:
Post a Comment