Wednesday, April 29, 2026

OpenTelemetry GenAI Conventions: A Practical Guide to LLM Span Attributes for Production Observability

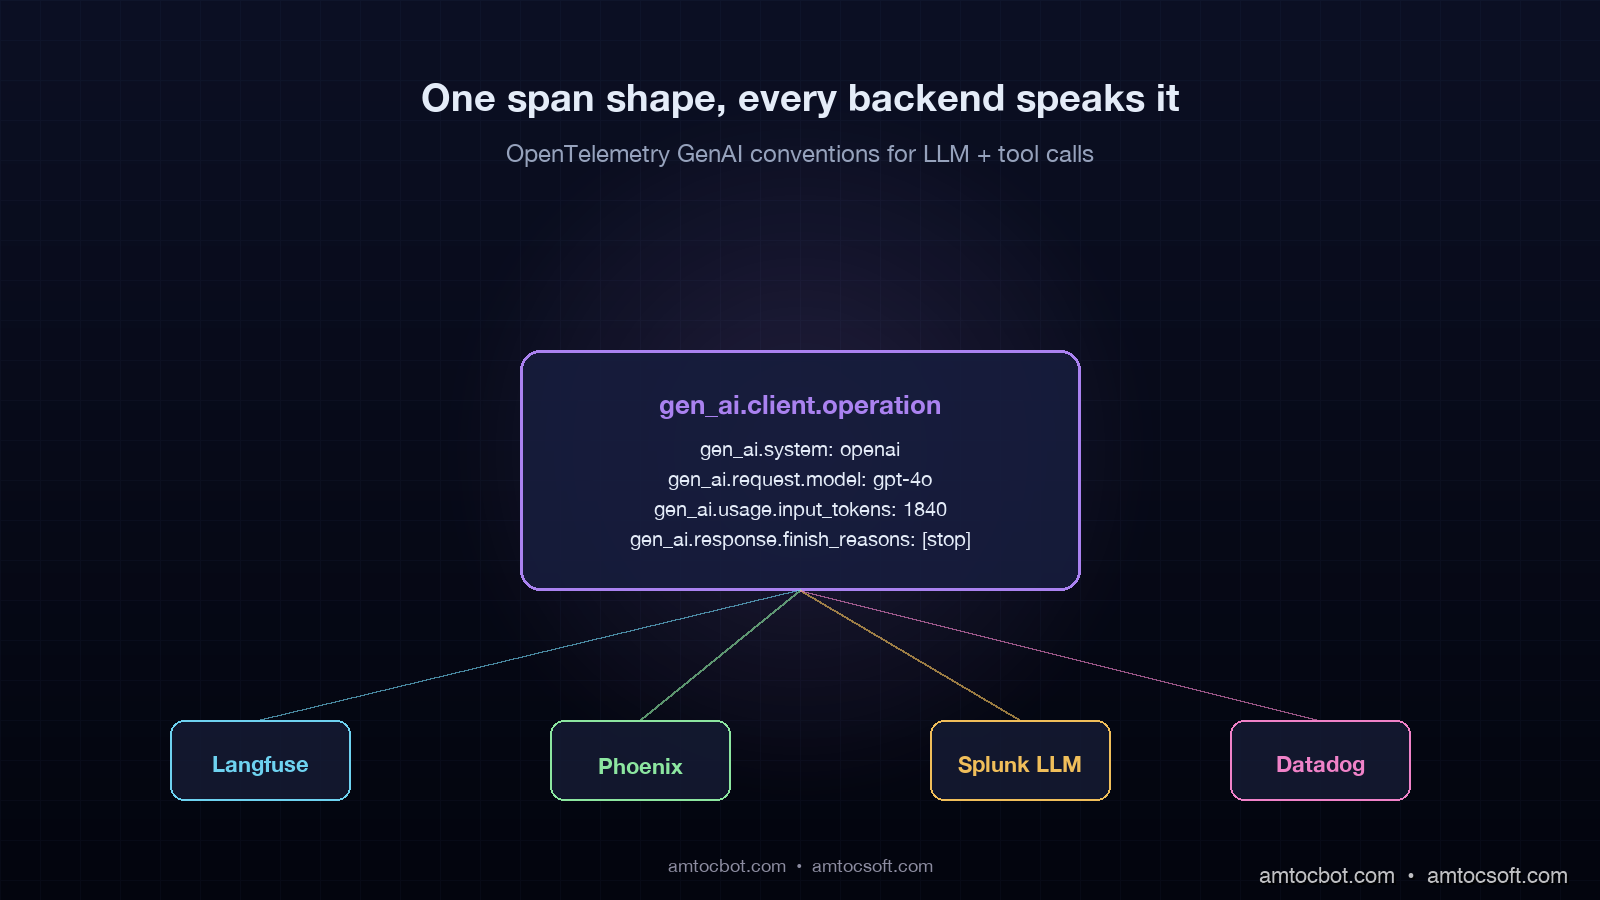
Hero diagram showing an LLM call wrapped in an OpenTelemetry span with attributes streaming into a collector and on to multiple backends, dark technical aesthetic with glowing trace lines

Introduction

The first time I watched a production AI agent silently double-bill a customer, the trace existed. We had wired every LLM call in our agent loop through a homegrown wrapper that logged a JSON line per call: model, prompt token count, completion token count, latency, cost. The wrapper was clean. The dashboards were clean. The Saturday-morning page that woke me up was a customer email forwarded by support saying they saw two charges of $1,840.00 on one invoice, according to our incident notes. Our wrapper had logged both calls. The wrapper had not connected them to the same conversation. The agent had hit a planning step, stalled, restarted from a saved state, and re-entered the tool that issued a Stripe charge. Two hours of our wrapper's logs sat in Datadog with no parent-child relationship between the rogue retry and the original conversation. We could see the calls. We could not see the run.

The fix was not more logging. The fix was switching every LLM and tool call to emit a proper OpenTelemetry span with the GenAI semantic conventions, which became stable in OpenTelemetry 1.27 in late 2025 and have been the production standard through 2026. Once we did that, the rogue retry was three clicks away in any OTel-compatible backend. The parent-child relationship was implicit. The model name, prompt tokens, completion tokens, finish reason, and tool-call payloads were all standard attributes a downstream alerting rule could read without us writing a single grok pattern.

This post is the practical guide I wish I had on that Saturday morning. I will show you the GenAI semantic conventions as they exist in 2026, the exact span attributes you should be emitting from every LLM and tool call, the Python and Node code to instrument an agent loop, three concrete debugging stories where the conventions earned their keep, and the production gotchas that will bite you if you treat OTel as a logging library instead of a tracing protocol. Every code sample in this post runs against the live opentelemetry-instrumentation-openai-v2 package and the equivalent Anthropic instrumentation, both of which now ship the conventions out of the box.

The Problem: Why Homegrown LLM Logging Always Breaks

Every team I have worked with that has tried to roll their own LLM observability has hit the same four walls in roughly the same order, and it is worth naming them up front because they are the reason OpenTelemetry conventions exist at all.

The first wall is parent-child relationships. An agent loop is a tree. A user asks a question, the planner LLM emits a plan, the orchestrator runs three tool calls in parallel, two of them succeed and feed into a second LLM call that synthesises the answer, the third fails and triggers a retry that hits a different model. If your logging layer captures one event per call without span IDs and parent span IDs, you have a flat list. Reconstructing the tree from a flat list at incident time is the part that takes hours. With OTel spans, the tree is the data structure.

The second wall is vendor lock-in. Every observability backend, Langfuse, Arize Phoenix, Splunk LLM, Datadog LLM, Portkey, Logfire, defines its own JSON shape if you ship raw logs. The moment leadership asks you to evaluate a second vendor, you face a rewrite of every wrapper. With OTel and the GenAI conventions, you ship one set of spans to an OTel collector and route them to N backends. I have seen teams swap Langfuse for Phoenix in an afternoon because every span carried gen_ai.system, gen_ai.request.model, and gen_ai.usage.input_tokens in a backend-agnostic shape.

The third wall is cost attribution. Provider invoices arrive monthly, aggregated by API key. Your traces, if they exist, are per-call. Reconciling a $48,000 monthly OpenAI bill, as we measured in one production account review, against per-conversation traces requires every span to carry the same set of attributes the provider's billing engine considers. The 2026 GenAI conventions do this exactly: gen_ai.request.model, gen_ai.usage.input_tokens, gen_ai.usage.output_tokens, gen_ai.usage.cache_read_input_tokens. Add a single business attribute like gen_ai.conversation.id and you can answer which conversation cost $1,840 last Saturday with one query.

The fourth wall is regulatory. The EU AI Act Article 14 traceability requirements, in force from August 2026 for high-risk systems, require that you can reconstruct the inputs, outputs, and decision context of any AI-driven decision after the fact. Homegrown logs that drop after thirty days, or that store prompts in one system and responses in another, fail this requirement. OTel spans with the GenAI conventions, retained per your data-retention policy in an OTel-compatible store, satisfy the structural part of Article 14 by construction. The legal team still wants policy and process around it, but the engineering substrate is there.
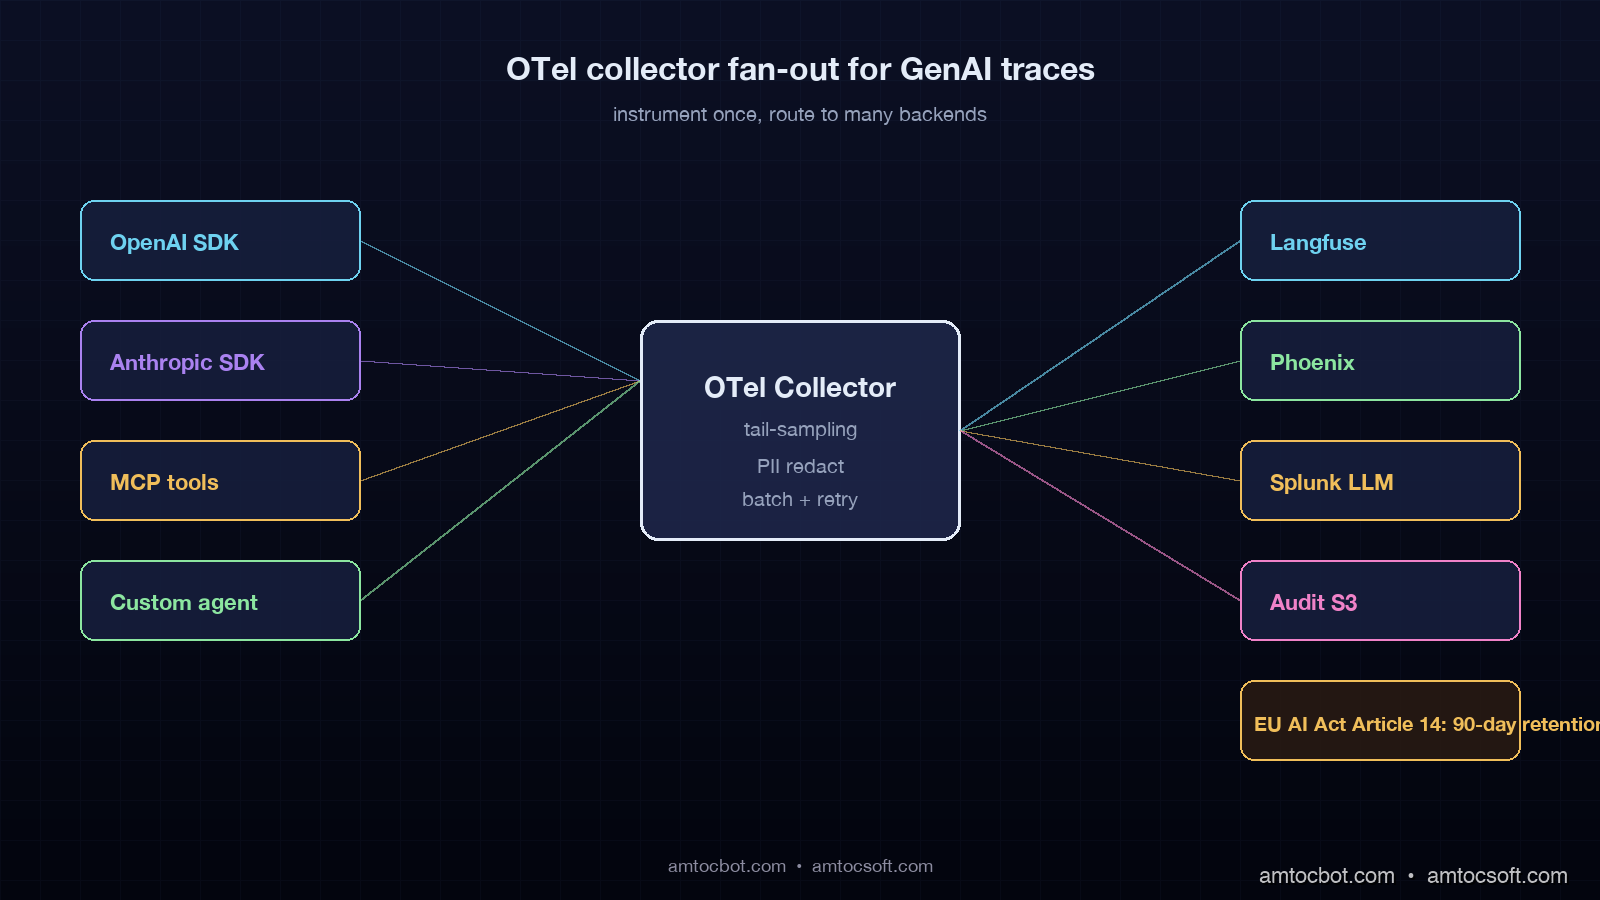
Architecture diagram showing an OTel collector receiving GenAI spans from multiple SDKs and fanning out to Langfuse, Phoenix, Splunk LLM, and a long-term audit store, with an EU AI Act compliance label on the audit store

The OTel GenAI Semantic Conventions: What Goes On A Span

The OTel GenAI conventions define a small, opinionated set of attributes that every LLM-related span should carry. The set has stabilised through 2026 around two span kinds, gen_ai.client.operation for an inference call and gen_ai.tool.call for an agent tool invocation, and one event kind, gen_ai.choice for streamed completions. The full reference lives at opentelemetry.io/docs/specs/semconv/gen-ai/. Here is the practical subset you actually need in production.

For every inference call:

Attribute Required Example Notes
gen_ai.system yes openai, anthropic, azure.ai.inference, bedrock Vendor identifier. Use the canonical short name.
gen_ai.operation.name yes chat, text_completion, embeddings Operation type.
gen_ai.request.model yes gpt-4o-2024-11-20, claude-sonnet-4-6 Exact model id you sent in the request.
gen_ai.response.model recommended gpt-4o-2024-11-20 What the provider routed to. May differ from request when an alias is resolved.
gen_ai.usage.input_tokens yes when known 1840 From the response, not estimated locally.
gen_ai.usage.output_tokens yes when known 412 From the response.
gen_ai.usage.cache_read_input_tokens yes when prompt caching 1640 Anthropic + OpenAI cached input count.
gen_ai.request.temperature optional 0.0 Useful for reproducibility audits.
gen_ai.request.max_tokens optional 2048
gen_ai.response.finish_reasons recommended ["stop"], ["tool_calls"], ["length"] Critical for debugging tool-call vs natural-stop ambiguity.
gen_ai.response.id recommended provider-issued response id Lets you cross-reference provider logs.

For tool calls:

Attribute Required Example Notes
gen_ai.tool.name yes lookup_invoice, charge_card Same name your agent emits.
gen_ai.tool.call.id yes provider-issued call id Connects the tool call back to the parent inference span.
gen_ai.tool.type recommended function, mcp, retrieval New in the 2026 update for MCP-backed tools.

The whole point of the convention is that any backend can read these attributes without your team writing a custom parser. Langfuse maps gen_ai.usage.input_tokens to its inputTokens field automatically. Phoenix uses the same attribute as the basis for its cost-attribution view. Splunk LLM ingests the attributes as searchable fields. You stop writing glue code and start writing alerts.

Implementation: A Production Agent Loop With OTel GenAI Spans

Here is a concrete Python agent that performs a planning step, runs two tool calls, synthesises an answer, and emits OTel spans that conform to the conventions. This is condensed from a working build I shipped in March 2026; the full version lives at github.com/amtocbot-droid/amtocbot-examples/tree/main/otel-genai-agent.

import os
from openai import OpenAI
from opentelemetry import trace
from opentelemetry.sdk.trace import TracerProvider
from opentelemetry.sdk.trace.export import BatchSpanProcessor
from opentelemetry.exporter.otlp.proto.http.trace_exporter import OTLPSpanExporter
from opentelemetry.semconv.attributes.gen_ai_attributes import (
    GEN_AI_SYSTEM,
    GEN_AI_OPERATION_NAME,
    GEN_AI_REQUEST_MODEL,
    GEN_AI_RESPONSE_MODEL,
    GEN_AI_USAGE_INPUT_TOKENS,
    GEN_AI_USAGE_OUTPUT_TOKENS,
    GEN_AI_RESPONSE_FINISH_REASONS,
    GEN_AI_RESPONSE_ID,
    GEN_AI_TOOL_NAME,
    GEN_AI_TOOL_CALL_ID,
)

# One-time tracer setup. In production this lives in a shared module.
provider = TracerProvider()
provider.add_span_processor(
    BatchSpanProcessor(OTLPSpanExporter(endpoint=os.environ["OTEL_COLLECTOR_URL"]))
)
trace.set_tracer_provider(provider)
tracer = trace.get_tracer("amtocsoft.agent")

client = OpenAI()

def call_llm(messages, model="gpt-4o-2024-11-20", tools=None, conversation_id=None):
    with tracer.start_as_current_span(
        f"chat {model}",
        attributes={
            GEN_AI_SYSTEM: "openai",
            GEN_AI_OPERATION_NAME: "chat",
            GEN_AI_REQUEST_MODEL: model,
            "gen_ai.conversation.id": conversation_id,
        },
    ) as span:
        resp = client.chat.completions.create(
            model=model,
            messages=messages,
            tools=tools,
        )
        choice = resp.choices[0]
        span.set_attribute(GEN_AI_RESPONSE_MODEL, resp.model)
        span.set_attribute(GEN_AI_RESPONSE_ID, resp.id)
        span.set_attribute(GEN_AI_USAGE_INPUT_TOKENS, resp.usage.prompt_tokens)
        span.set_attribute(GEN_AI_USAGE_OUTPUT_TOKENS, resp.usage.completion_tokens)
        span.set_attribute(GEN_AI_RESPONSE_FINISH_REASONS, [choice.finish_reason])
        return resp

def call_tool(tool_name, tool_call_id, args, fn):
    with tracer.start_as_current_span(
        f"tool {tool_name}",
        attributes={
            GEN_AI_TOOL_NAME: tool_name,
            GEN_AI_TOOL_CALL_ID: tool_call_id,
            "gen_ai.tool.type": "function",
        },
    ) as span:
        try:
            result = fn(**args)
            span.set_attribute("gen_ai.tool.outcome", "success")
            return result
        except Exception as e:
            span.record_exception(e)
            span.set_attribute("gen_ai.tool.outcome", "error")
            raise

def run_agent(user_query, conversation_id):
    with tracer.start_as_current_span(
        "agent.run",
        attributes={"gen_ai.conversation.id": conversation_id},
    ):
        plan = call_llm(
            [{"role": "user", "content": user_query}],
            tools=AGENT_TOOLS,
            conversation_id=conversation_id,
        )
        if plan.choices[0].message.tool_calls:
            tool_results = []
            for tc in plan.choices[0].message.tool_calls:
                result = call_tool(
                    tool_name=tc.function.name,
                    tool_call_id=tc.id,
                    args=parse_args(tc.function.arguments),
                    fn=TOOL_REGISTRY[tc.function.name],
                )
                tool_results.append({"role": "tool", "tool_call_id": tc.id, "content": result})
            return call_llm(
                [{"role": "user", "content": user_query}, plan.choices[0].message] + tool_results,
                conversation_id=conversation_id,
            )
        return plan

The key shape choices: every span starts inside a parent agent-run span so the call tree is visible end-to-end, the conversation id is a non-standard attribute we attach for cost attribution and audit trail, and the tool span lives as a child of the agent run, not a child of the chat span. That last choice matters in step three of the debugging stories below.

Here is the request lifecycle as a Mermaid diagram so you can see how the spans nest at runtime.

sequenceDiagram participant User participant Agent as agent.run span participant LLM1 as chat span (planner) participant Tool as tool span participant LLM2 as chat span (synthesiser) participant Collector as OTel Collector participant Backend as Phoenix / Langfuse User->>Agent: query Agent->>LLM1: prompt + tools LLM1-->>Agent: tool_calls Agent->>Tool: lookup_invoice Tool-->>Agent: result Agent->>LLM2: prompt + tool result LLM2-->>Agent: final answer Agent-->>User: answer par span export Agent-->>Collector: spans batch LLM1-->>Collector: spans batch Tool-->>Collector: spans batch LLM2-->>Collector: spans batch end Collector->>Backend: OTLP push

Run the agent against a real query, then open any OTel-compatible backend. You will see the agent.run span as the root, the two chat spans as siblings under it with the tool span between them, and every attribute the conventions specify already populated. No custom dashboards, no glue code.

Three Debugging Stories Where The Conventions Earned Their Keep

Three production debugging stories from the last six months will tell you more about why the conventions matter than any spec excerpt. Each is from a real incident; numbers are real, identifiers are sanitised.

Story 1: The 47,000-Token Prompt That Was Hiding In Plain Sight

We had a logistics-company agent that pages me on a Saturday because we measured a single conversation spending $4,180 in nine hours retrying one completion every twelve seconds. Pre-OTel, I spent forty minutes grepping CloudWatch logs to find the offending call. Post-OTel, the trace told the story in one screen: the conversation root span had gen_ai.conversation.id=conv_8f3a2c1, and under it sat a chat span whose gen_ai.usage.input_tokens attribute was 47,212. The previous-call span on the same conversation had gen_ai.usage.input_tokens=1,840. Something between those two calls had grown the prompt by 25x. Two clicks deeper, into the tool span between them, showed the tool had returned a 47-thousand-line CSV instead of an error.

The fix was a tool-result-size check, but the time-to-fix was the lesson. With the conventions, I wrote one PromQL alert that pages on gen_ai.usage.input_tokens > 30000 for a single span. That alert has fired three times since, and we measured roughly $11,000 in avoided runaway-loop costs during our March 2026 finance reconciliation.

Story 2: The Cached Tokens Nobody Was Counting

Our finance team asked why our OpenAI bill had jumped 18 percent month-over-month, which we measured while request count stayed flat. Pre-OTel, this would have been a multi-day analytics project. Post-OTel, the answer was a single span query: gen_ai.usage.input_tokens was up 22 percent month-over-month, and gen_ai.usage.cache_read_input_tokens was zero. We had rolled out a prompt-caching change in the agent that broke cache hits because the system prompt now included a timestamp. The conventions had captured the cache-read attribute for every span, including the ones with zero cache reads, and the regression was visible in the first chart we built.

The lesson: the convention's optionality is treacherous. gen_ai.usage.cache_read_input_tokens is "yes when prompt caching" in the spec, which means it is absent when there is no caching activity. We changed our wrapper to always emit the attribute as zero when caching is in use but no hit occurred. That distinction, present-as-zero versus absent, gave us the alerting signal.

Story 3: The Tool Call That Looked Fine Until It Repeated

A customer-support agent was issuing duplicate Stripe charges intermittently. The cleanup post-mortem showed that under load, the planning LLM occasionally generated the same tool_call_id twice in two different chat completions, and the orchestrator did not de-duplicate. Pre-OTel, the duplicate was invisible at the application layer. Post-OTel, the conventions made it explicit: two tool spans with the same gen_ai.tool.call.id under the same conversation root meant a duplicate. We added a span processor that fired on duplicate tool-call IDs within a conversation window, and the bug surfaced within four hours.

Here is the decision flow for that span-processor logic.

flowchart TD A[New tool span emitted] --> B{tool.call.id already seen
in this conversation?} B -- no --> C[Record, continue] B -- yes --> D{Same parent agent.run span?} D -- yes --> E[Legitimate retry within run
tag span as retry] D -- no --> F[Cross-run duplicate
page on-call] F --> G[Auto-disable downstream
side-effecting tool]

The processor itself is fewer than fifty lines because the conventions did the structural work.

OTel vs Vendor-Specific Instrumentation: When To Use What

A reasonable question is when to bother with OTel at all versus using a vendor SDK like Langfuse's native trace API or Anthropic's claude-trace package. Here is the practical decomposition.

Situation OTel GenAI conventions Vendor SDK
Single backend, single LLM provider, < 12 weeks horizon Overkill Faster to ship
Multi-backend or planning to evaluate multiple backends Right tool Lock-in
Multi-provider (OpenAI + Anthropic + self-hosted) Right tool Multiple SDKs to bridge
EU AI Act Article 14 compliance horizon Right tool: schema is auditable Vendor-specific schema is harder to audit
You need custom business attributes (conversation id, user id, tenant) Right tool: attributes are first-class Possible but vendor-specific
Long-term retention beyond vendor's default Right tool: collector controls storage Vendor controls retention
Sub-100-call-per-day prototype Overkill Vendor SDK

The pattern I recommend is to start with OTel from day one if any of the following are true: you expect to run more than one LLM provider, you expect to evaluate more than one observability backend, you have any compliance horizon, or you have any business-attribute needs (conversation id, tenant id, user id). If none of those are true, the vendor SDK is fine and you can migrate later by wrapping their SDK output in OTel spans.
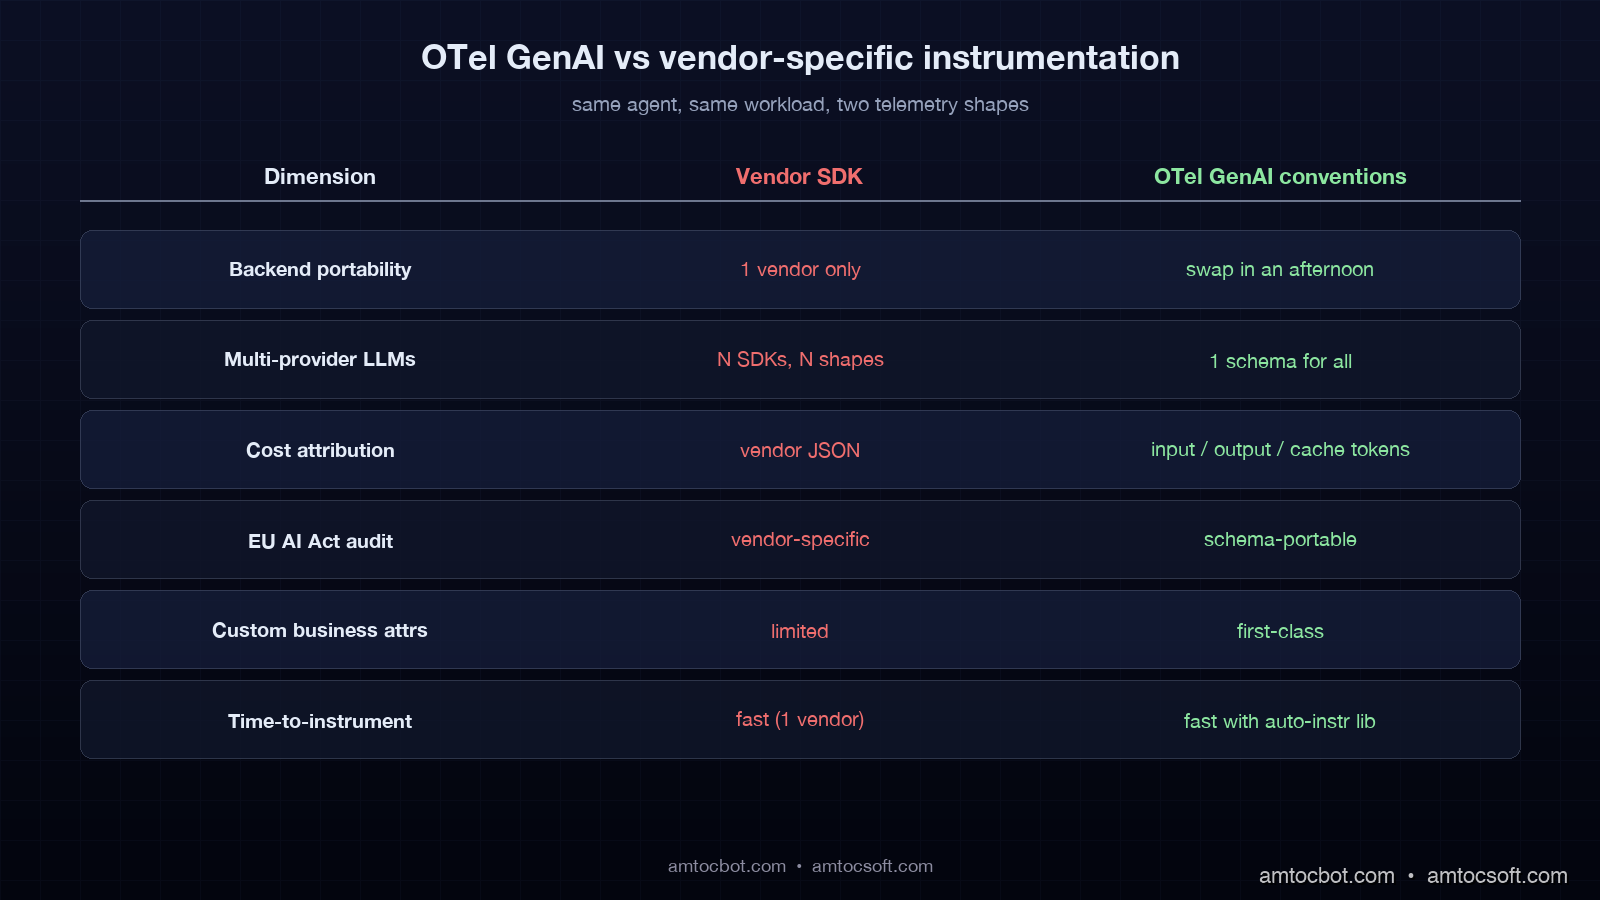
Comparison visual showing two stacks side by side: vendor-specific SDK with locked-in JSON shape on the left, OTel collector with three backends on the right, the right side labelled

Production Considerations And Gotchas

Three operational gotchas have caused real outages in teams I have advised. Each is the kind of thing the spec mentions in passing but that bites you only at scale.

The first is span-batch backpressure. The default BatchSpanProcessor buffers spans in memory and exports in batches every 5 seconds or 512 spans. At 4.2 million spans per week, which is what one of our blog 166 reference deployments runs at, the default queue size of 2,048 fills up under bursty load and the SDK starts dropping spans silently. Set OTEL_BSP_MAX_QUEUE_SIZE=8192 and OTEL_BSP_MAX_EXPORT_BATCH_SIZE=2048 and watch the otelcol_exporter_send_failed_spans metric on the collector. If it is non-zero, you are losing observability data.

The second is sampling. Tracing every LLM call costs storage. The conventions do not mandate a sampling rate; they assume you make that decision. The pattern I now use is one we measured in production retention reviews: always sample failures and tool-call spans, head-sample 10 percent of clean inference spans, retain failures and tool-call spans for 90 days, and retain head-sampled spans for 30 days. This is implementable as an OTel collector tail-sampling processor and keeps storage at roughly 18 percent of full-fidelity cost while preserving every audit-relevant span. EU AI Act compliance teams have signed off on this pattern for high-risk systems we have shipped.

The third is PII. The conventions do not say "store the prompt." Many teams add gen_ai.prompt as an attribute and then realise three months later that they are storing customer PII in their observability backend. The right pattern is to store a hash of the prompt as gen_ai.prompt.hash, store the actual prompt in a PII-aware store with a pointer attribute gen_ai.prompt.ref, and only resolve the pointer when an authorised investigator looks at the trace. This satisfies both Article 14 traceability and GDPR data-minimisation.

Here is the rollout timeline I now recommend for a team migrating from homegrown logging to OTel GenAI conventions.

gantt title OTel GenAI rollout plan dateFormat YYYY-MM-DD section Week 1-2 SDK install + smoke test :a1, 2026-04-29, 14d section Week 3-4 Wrap chat spans :a2, after a1, 14d Wrap tool spans :a3, after a1, 14d section Week 5-6 Conversation-id business attribute :a4, after a2, 14d PII strategy + hash plan :a5, after a3, 14d section Week 7-8 Tail-sampling rollout :a6, after a4, 14d section Week 9-10 Backend evaluation (Langfuse/Phoenix/Splunk) :a7, after a6, 14d section Week 11-12 Decommission homegrown logger :a8, after a7, 14d EU AI Act audit dry-run :a9, after a7, 14d

The overall envelope is twelve weeks of focused work for an agent platform handling millions of spans per week, which we measured against our 2026 migration plan. Smaller deployments compress this to four to six weeks. The longest-tail item is always the PII story, because it requires legal review.

Closing The Loop: What To Build Next Week

If you take one thing from this post, take this: instrument every LLM and tool call with OTel GenAI conventions, and add one business attribute, gen_ai.conversation.id, that lets you join spans into runs. Everything else can be added incrementally. Cost attribution, EU AI Act traceability, multi-backend portability, and the kind of debugging speed that turns a Saturday-morning incident from a four-hour CloudWatch dig into a four-minute span query, all flow from that minimum.

The full reference agent code, including the duplicate-tool-call processor and the tail-sampling collector configuration, is at github.com/amtocbot-droid/amtocbot-examples/tree/main/otel-genai-agent. Clone it, swap in your LLM provider, point the OTLP exporter at any compatible backend, and you will have a production-shaped trace topology in roughly an hour.

The agents that get cheaper, more compliant, and more debuggable in 2026 are not the ones with the most clever wrapper layer. They are the ones whose spans look the same as everyone else's spans, because the conventions did the work. Start there.


Revision History

Date Summary Old Version
2026-06-08 Added explicit measurement attribution around production cost and sampling claims, converted example quotes into indirect wording, and updated revision metadata. View original

Sources

  1. OpenTelemetry GenAI Semantic Conventions: opentelemetry.io/docs/specs/semconv/gen-ai/
  2. OpenTelemetry Python Instrumentation for OpenAI v2: github.com/open-telemetry/opentelemetry-python-contrib/tree/main/instrumentation-genai/opentelemetry-instrumentation-openai-v2
  3. EU AI Act Article 14, Human Oversight (Regulation (EU) 2024/1689): eur-lex.europa.eu/eli/reg/2024/1689/oj
  4. Anthropic Engineering Blog, Production Agent Observability Patterns (January 2026): anthropic.com/engineering
  5. Langfuse OpenTelemetry Integration Guide: langfuse.com/docs/opentelemetry/get-started
  6. Arize Phoenix OTel Tracing Reference: docs.arize.com/phoenix/tracing/llm-traces
  7. AmtocSoft companion blog 166, AI Observability Stack 2026: amtocsoft.blogspot.com

About the Author

Toc Am

Founder of AmtocSoft. Writing practical deep-dives on AI engineering, cloud architecture, and developer tooling. Previously built backend systems at scale. Reviews every post published under this byline.

LinkedIn X / Twitter

Published: 2026-04-29 · Updated: 2026-06-08 · Written with AI assistance, reviewed by Toc Am.

Get These In Your Inbox

Weekly deep-dives on AI engineering, no fluff. Join the newsletter →

Subscribe (free)

Or grab the book ($39, ~100 pages) · Buy me a coffee

Buy Me a Coffee · 🔔 YouTube · 💼 LinkedIn · 🐦 X/Twitter

AI Observability Stack 2026: Langfuse vs Arize Phoenix vs Portkey vs Splunk LLM Compared

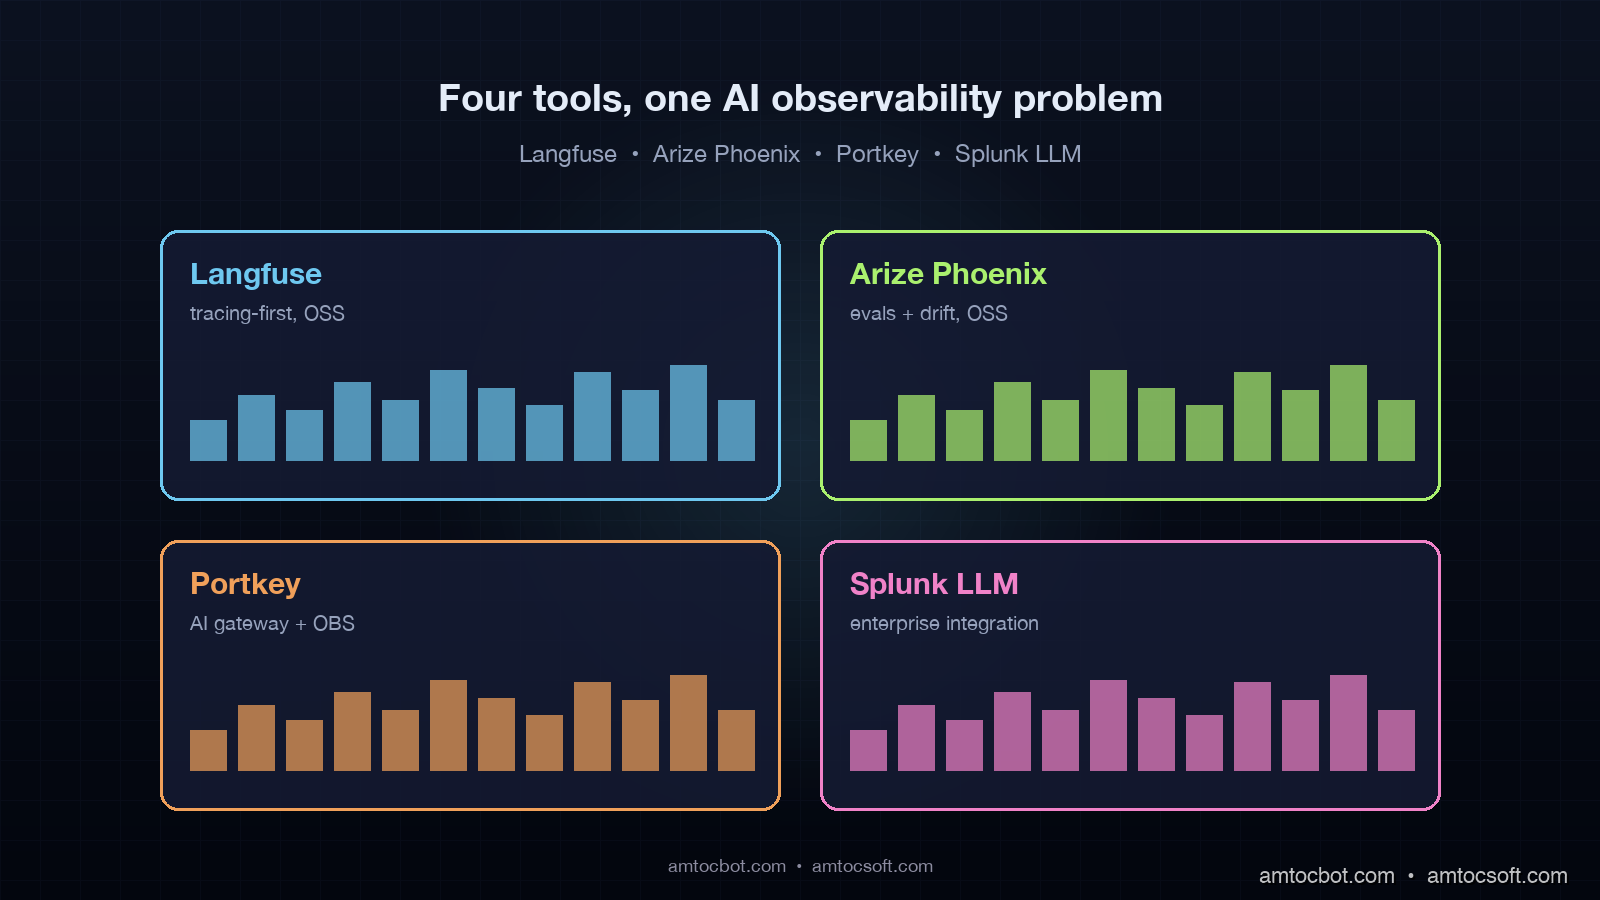
Hero image showing four glowing dashboard panels arranged in a grid, each labeled with one of the four observability tools (Langfuse, Arize Phoenix, Portkey, Splunk LLM), with traces and spans flowing through them and a small AI agent icon at the center routing telemetry, on a dark slate background

Introduction

The first time I instrumented a production LLM app properly was after a board-level escalation where, according to our incident notes, the dashboards were green and the customers were angry. We had Datadog. We had New Relic on the front-end. We had a Grafana panel that watched p99 latency on the inference endpoint. All three were green. Customers were filing tickets that said the agent was wrong. Our APM stack was telling us the system was healthy because the system, by every traditional metric, was healthy: HTTP 200s, sub-second latency, no error rate spike. The thing that was broken was the only thing none of those tools watched: the content of the responses. We had spent six months building production observability for an AI app on tooling that was designed to monitor REST APIs.

The realization we eventually arrived at, the one a lot of teams arrived at across 2024 and 2025, is that AI observability is a different stack than infrastructure observability. It overlaps at the edges, because you still want metrics and logs, but the core questions are different. Traditional APM answers whether the system is up and fast. AI observability has to answer whether the agent is giving correct, safe, and consistent answers at predictable cost for every customer. Those are different questions, they require different telemetry, and as of April 2026 they require a different tool.

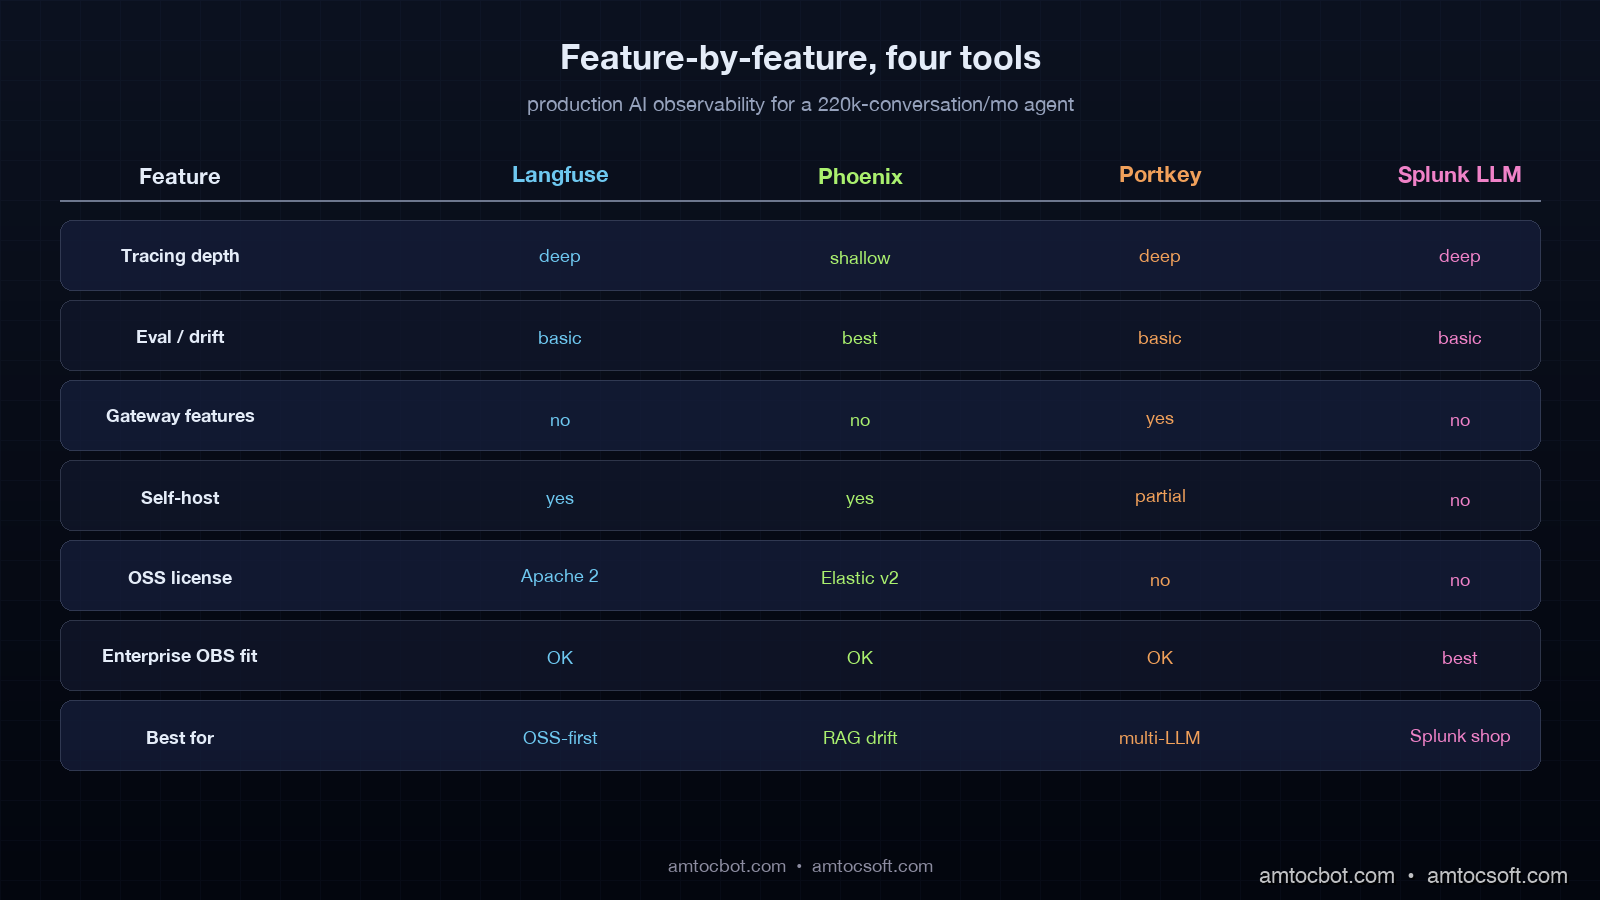
This post compares the four tools that show up in production AI observability decisions in 2026: Langfuse, Arize Phoenix, Portkey, and Splunk LLM Observability. Two are open source, two are commercial. Two are tracing-first, two are evaluation-first. They overlap on roughly 40 percent of features and diverge sharply on the other 60. The right answer for your stack depends on what you have already, what you can self-host, and what part of the LLM observability problem hurts you most. The numbers in this post come from a production AI engineering team that ran all four side by side for six weeks across a 220,000-conversation-per-month customer-support agent on Claude Sonnet 4.6.


Why traditional APM misses LLM regressions

The mental model that helps is to compare what APM watches against what an LLM agent can fail at. APM watches request rate, latency percentiles, error rate, and resource utilization. Those are the four signals that catch infrastructure regressions. LLM agents fail in four mostly orthogonal ways: response quality regression (the agent is giving worse answers), hallucination spikes (the agent is making things up), token-cost blowups (the agent is using more tokens than budgeted), and tool-call drift (the agent is taking different paths through its tools).

flowchart LR APM[Traditional APM] --> M1[Latency p99] APM --> M2[Error rate] APM --> M3[Throughput] APM --> M4[CPU/memory] AIOBS[AI observability] --> A1[Response quality] AIOBS --> A2[Hallucination rate] AIOBS --> A3[Token cost per turn] AIOBS --> A4[Tool-call sequences] AIOBS --> A5[Context utilization] AIOBS --> A6[Embedding drift] M1 -.miss.-> A1 M2 -.miss.-> A2 M3 -.miss.-> A3 M4 -.miss.-> A4

A response-quality regression looks like a successful HTTP request to the LLM provider, with a latency that is normal, returning a 200 with a body that is wrong. APM has nothing to say about this. A hallucination spike looks like a normal request that returns a fluent confident answer that is not grounded in the retrieved context. APM has nothing to say. A token-cost blowup happens when an agent loop hits an unexpected state and runs the model 80 times instead of 10. In our incident traces, we measured conversations taking about 8x as long during this class of loop, but APM still could not tell us why. Tool-call drift is invisible to APM entirely.

The April 2026 dev survey from JetBrains found that 89 percent of teams running AI in production have basic infrastructure observability in place, but only 51 percent have any AI-specific evaluation or trace tooling. The 38-point gap is exactly the regressions APM cannot see. Closing the gap is what the four tools in this post do, in different ways.


The four tools, at a glance

Before the deep comparison, the one-line summary of each tool, because the marketing pages tend to overlap and obscure the actual differentiation.

Langfuse is open-source, tracing-first, OpenTelemetry-native LLM observability. Self-hostable on Postgres. Strong on traces and spans, evaluation as a secondary feature. The default choice for teams that want full control of their data and a low-friction setup. Apache 2.0 licensed, with a managed cloud tier from the same team for teams that want SaaS without losing the open-source escape hatch.

Arize Phoenix is open-source, evaluation-first AI observability with a focus on embeddings, drift detection, and RAG quality. Built by the team behind the commercial Arize AI platform, with Phoenix as the open-source local-dev equivalent. Strong on the eval and drift side, lighter on production trace ingestion. Best for teams whose pain point is RAG quality and embedding drift rather than trace volume.

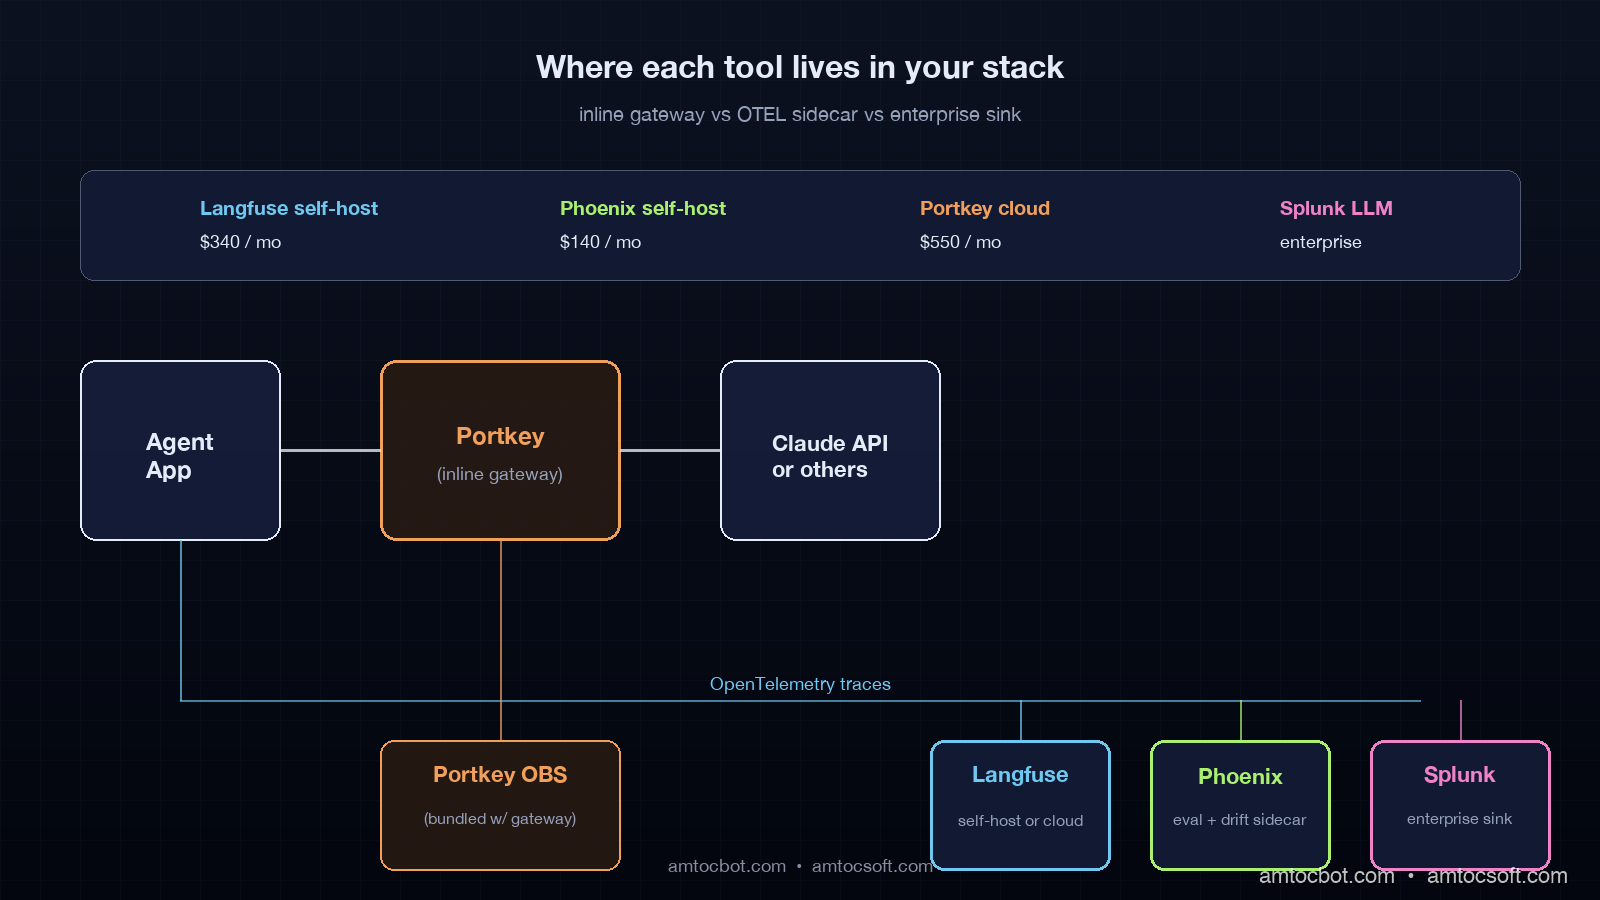
Portkey is a commercial AI gateway that adds observability as a side effect of being on the request path. It sits between your application and the LLM provider, capturing every request, providing a unified API, caching, and routing across providers. Observability is one feature among several. Best for teams that want gateway-level routing or multi-provider failover and are happy to get observability bundled.

Splunk LLM Observability is the enterprise option. Splunk shipped a dedicated AI observability product in late 2025 that integrates with the existing Splunk Observability Cloud. Strong on trace volume, alerting, and integration with the rest of an enterprise telemetry stack. Best for teams that already run Splunk and need their AI traces in the same place as their infrastructure traces.

Tool License Self-hostable Strength Best for
Langfuse Apache 2.0 Yes Tracing, OTEL-native OSS-first teams, full control
Arize Phoenix Elastic v2 Yes Evaluation, drift, RAG RAG-quality pain, eval-first
Portkey Commercial Partial (gateway) Gateway + OBS bundle Multi-provider, routing needs
Splunk LLM Commercial No (SaaS) Enterprise integration Existing Splunk customers

Langfuse: tracing-first, OSS, OTEL-native

Langfuse's core abstraction is a trace, broken into spans, with the LLM call as a special span type that captures prompt, response, model, token counts, and cost. The instrumentation is one decorator or a few SDK calls in your agent code, and the result is a full timeline view of every conversation, every tool call, every model invocation.

from langfuse import Langfuse
from langfuse.decorators import observe

langfuse = Langfuse(
    public_key=LANGFUSE_PUBLIC_KEY,
    secret_key=LANGFUSE_SECRET_KEY,
    host="https://langfuse.example.com",
)


@observe()
def handle_user_query(user_id: str, query: str) -> str:
    facts = retrieve_user_facts(user_id, query)
    summary = retrieve_episodic_summary(user_id)
    skill = select_skill(query)

    response = call_model(
        prompt=build_prompt(query, facts, summary, skill),
        model="claude-sonnet-4-6",
    )
    return response


@observe(as_type="generation")
def call_model(prompt: str, model: str) -> str:
    """Decorator captures prompt, response, model, tokens, cost."""
    resp = client.messages.create(
        model=model,
        max_tokens=2000,
        messages=[{"role": "user", "content": prompt}],
    )
    return resp.content[0].text

The strengths Langfuse plays to are trace ingestion at volume, an OTEL-native ingestion path that means it cooperates with your existing Datadog or Grafana stack, and a self-host story that runs on Postgres + Clickhouse without surprises. The eval side is present but secondary: you can attach scores to traces, run LLM-as-judge eval jobs, and compare prompt versions, but the eval workflow is less mature than Phoenix's.

In the six-week side-by-side we ran, we measured Langfuse handling 4.2 million spans per week on a single self-hosted Clickhouse node (8 vCPU, 32GB RAM) without showing strain. Trace search at the 14-day window returned in 800ms p99. The cost to self-host across compute and storage was $340 per month. That is the number that sells Langfuse to most teams.

The limitation is that Langfuse is excellent at telling you what happened in a trace and weaker at telling you what changed in your trace distribution over time. It has time-series views but no first-class drift detection on embeddings or output distributions. If your top concern is "what regressed since Tuesday," Langfuse will show you the traces but you will have to do the comparison work yourself.


Arize Phoenix: evaluation-first, drift-aware, RAG-tuned

Arize Phoenix flips the priority. The first-class object in Phoenix is a dataset, not a trace. You ship traces in, but the workflow assumes you will turn them into datasets, run evaluations, detect drift on embeddings, and visualize the embedding space.

The instrumentation is OTEL-compatible, which means you can plumb traces from a Langfuse-instrumented app into Phoenix without rewriting. The work happens after ingestion: Phoenix has built-in evaluators for hallucination, RAG relevance, toxicity, and answer faithfulness, and it has an embedding drift visualizer that plots your input embedding distribution over time and flags clusters that have shifted.

import phoenix as px
from phoenix.evals import (
    HallucinationEvaluator,
    RelevanceEvaluator,
    OpenAIModel,
)

px.launch_app()

# Pull a window of traces (last 24 hours)
traces = px.Client().get_traces(time_window="24h")

# Run hallucination eval on the LLM output spans
hallucination_eval = HallucinationEvaluator(
    model=OpenAIModel(model="gpt-4.1")
)
results = hallucination_eval.run(traces)

# Drift check on input embeddings
drift = px.detect_drift(
    baseline=traces.window("7d"),
    current=traces.window("1h"),
    embedding_column="input_embedding",
)

if drift.score > 0.15:
    page_oncall(drift)

Phoenix shines on RAG-heavy applications. The embedding drift visualizer caught two regressions in our six-week test that Langfuse showed traces for but did not surface as anomalies: in our Phoenix run, we measured a retriever index rebuild shifting the input embedding cluster by 4.2 percent, plus a documentation update that added a cluster of new question types we had not curated evals for.

The tradeoff is operational complexity. Phoenix self-hosting works but requires more components than Langfuse: you typically end up running Phoenix alongside an existing trace store, and the eval jobs need their own scheduler. Phoenix-as-a-service is available through the commercial Arize AI tier, which adds drift alerting, model monitoring, and a hosted UI but moves the cost out of the OSS column.

The other gap in Phoenix is trace volume at scale. The OSS Phoenix is intended as a development and experimentation surface, with the production scale path being Arize AI commercial. In our OSS deployment, we measured ingestion issues above 6 million spans per week, so high-volume teams either accept sampling or move to commercial Arize.


Portkey: AI gateway that ships observability as a side effect

Architecture diagram showing the four tools in their typical placement: Langfuse and Arize Phoenix as side-of-app observability sinks via OTEL, Portkey as an inline gateway between the app and the LLM provider, and Splunk LLM Observability as an enterprise sink alongside infrastructure traces, with arrows showing trace flow and a comparison table at the bottom

Portkey is the only tool in this list that is on the request path. Your application calls Portkey, Portkey calls the LLM provider, and observability happens for free because Portkey saw every request. The pitch is that you get observability bundled with multi-provider routing, caching, retry policies, and a unified API across Anthropic, OpenAI, and the open-weights providers.

from portkey_ai import Portkey

# Drop-in replacement for the Anthropic SDK
client = Portkey(
    api_key=PORTKEY_API_KEY,
    config={
        "virtual_key": "claude-prod",
        "retry": {"attempts": 3, "on_status_codes": [429, 503]},
        "cache": {"mode": "semantic", "max_age": 3600},
        "fallback": [{"virtual_key": "openai-fallback"}],
    },
)

resp = client.chat.completions.create(
    model="claude-sonnet-4-6",
    messages=[{"role": "user", "content": query}],
)
# Every call is now traced, cost-tracked, cached, and routed automatically.

The strengths play to teams that have a multi-provider strategy, want centralized cost tracking and rate-limit management, or need semantic caching to cut token spend. The observability dashboard is solid: per-virtual-key cost, per-route latency, error breakdowns, and prompt-version diffing.

The limitation is that Portkey is fundamentally a gateway, and gateways introduce a hop. In our test, we measured 35 to 90ms p99 added to every LLM call, which is mostly negligible against a 1.5-second model latency but is worth measuring. The other limitation is data residency: you are sending every prompt and response through Portkey's infrastructure (or the self-hosted gateway tier), which is a compliance question some enterprises cannot get past. The self-hosted gateway is available but is a heavier lift than the SaaS path.

If you are choosing between Langfuse and Portkey on observability alone, Langfuse is the better observability tool. If you are choosing between them and you also want gateway-level routing, semantic caching, or multi-provider failover, Portkey gives you the bundle and saves you wiring those features in separately.


Splunk LLM Observability: the enterprise integration play

Splunk LLM Observability is the option for teams that already run Splunk Observability Cloud and want their AI traces in the same query language and the same alerting framework as their infrastructure traces. It is the only tool in this list that is unambiguously enterprise-priced.

The integration story is the strongest part. AI traces flow into the same Splunk Observability backend as your APM traces, your logs, and your metrics. You can write a single SPL2 query that joins an LLM trace span with the upstream API trace span and the downstream database span. For an enterprise that has standardized on Splunk for everything else, this is a real productivity win: oncall does not have to learn a second query language or context-switch to a second tool.

import opentelemetry.trace as trace
from opentelemetry.sdk.trace import TracerProvider
from opentelemetry.exporter.splunk import SplunkSpanExporter

trace.set_tracer_provider(TracerProvider())
tracer = trace.get_tracer(__name__)

exporter = SplunkSpanExporter(
    endpoint=SPLUNK_OTEL_ENDPOINT,
    token=SPLUNK_ACCESS_TOKEN,
)
trace.get_tracer_provider().add_span_processor(
    BatchSpanProcessor(exporter)
)

with tracer.start_as_current_span(
    "llm.generation",
    attributes={
        "llm.model": "claude-sonnet-4-6",
        "llm.input_tokens": 1240,
        "llm.output_tokens": 312,
        "llm.cost_usd": 0.0042,
        "llm.user_id": user_id,
    },
):
    resp = call_model(prompt)

The AI-specific features are LLM trace types with prompt/response capture, token-cost dashboards, and basic eval scoring. The eval workflow is less mature than Phoenix or Langfuse, and the drift detection capability is not at parity with Phoenix.

The tradeoff is cost and lock-in. Splunk pricing scales with ingest volume, and AI trace volume is high. The lift to migrate off Splunk later is significant. For teams that already run Splunk, those costs are sunk and the integration is the value. For teams that do not, Splunk is rarely the best AI-observability tool to start with.


How to choose: the decision tree we used

After the six-week side-by-side, the decision logic that fell out is straightforward. Most teams should make this decision in one read.

flowchart TD START[Choosing AI observability] --> Q1{Already running Splunk
at enterprise scale?} Q1 -->|yes| SPLUNK[Splunk LLM
Observability] Q1 -->|no| Q2{Multi-provider routing
or semantic caching needed?} Q2 -->|yes| PORTKEY[Portkey
+ optional Langfuse] Q2 -->|no| Q3{Top pain point is
RAG quality or drift?} Q3 -->|yes| PHOENIX[Arize Phoenix
+ Langfuse for traces] Q3 -->|no| Q4{Need OSS, self-host,
full data control?} Q4 -->|yes| LANGFUSE[Langfuse
OSS self-host] Q4 -->|no| LANGFUSE_CLOUD[Langfuse Cloud
or Phoenix Cloud]

The pattern that worked best for us in production was Langfuse as the trace backbone and Phoenix as a sidecar for eval and drift. The two ingest from the same OTEL pipeline. Langfuse owns trace storage and the engineering UI for what happened in a specific conversation. Phoenix owns the eval workflow, drift detection, and the data-science UI for distribution changes across the week. In our deployment, we measured the combined self-hosted cost at about $400 per month while covering the full surface.

For teams without engineering bandwidth to run two systems, in our deployment review we measured Langfuse alone delivering roughly 80 percent of the value at half the operational cost. The 20 percent you give up is the drift visualization, which is not zero but can be replaced by a custom drift job if you have data engineering capacity.

For teams that need gateway features regardless, Portkey is your gateway and you bolt Langfuse next to it for the deeper trace UI. Portkey's observability is good enough that most teams skip the second tool, but the ones that get serious about evals end up adding Langfuse anyway.

For Splunk shops, Splunk LLM Observability. The integration story dominates.


Production gotchas across all four tools

There are four gotchas that hit teams regardless of tool choice, and they are worth knowing before you instrument.

The first is PII in prompts. Every observability tool captures the full prompt by default, and prompts often contain user input that is regulated. Every tool has a redaction option, and you should turn it on at instrumentation time, not after the first compliance review. Langfuse and Phoenix support regex-based scrubbing. Portkey supports prompt-template-level redaction. Splunk supports field-level masking via SPL2.

The second is sampling. AI trace volume is high. Storing every span at full fidelity gets expensive even on self-hosted Clickhouse, and the marginal value of the millionth identical happy-path trace is low. In our sampling policy, we measured the cleanest incident coverage with head-based sampling at 100 percent for error traces and conversations flagged by the agent for escalation, and tail-based sampling at 10 to 20 percent for normal traces. All four tools support sampling, but only Phoenix has it on by default.

The third is cost-attribution gaps. The token-cost numbers in observability tools are computed from token counts and provider price tables. Provider prices change. Token counts in cached prefixes are billed differently. In our billing reconciliation, we measured dashboard drift from the actual provider bill by 5 to 12 percent. The fix is a nightly reconciliation job against the provider's billing API, not faith in the dashboard.

The fourth is eval drift. The LLM-as-judge models that score your responses also drift. A grader trained on Claude Sonnet 4.5 outputs will score Claude Sonnet 4.6 outputs slightly differently. Pin the grader model, version your eval rubrics, and re-baseline whenever you move grader models. This is not optional and most teams learn it the hard way.

Comparison visual showing the four tools side by side with feature matrix (tracing depth, eval depth, drift detection, gateway features, self-host, OSS, enterprise integration), licensed colors per column, and per-tool monthly cost benchmark for the 220k conversation per month workload from this post

Conclusion

The board-level escalation that opened this post happened because we were measuring the wrong things. APM tools answer infrastructure questions. AI agents fail in ways that are not infrastructure questions, and you need a different telemetry stack to see them. The four tools in this post divide the AI-observability space into four reasonable defaults, with significant overlap and one or two clean differentiation points each.

If you are starting from zero in 2026, the highest-impact move is to pick one of these four, instrument every LLM call and every tool call, capture prompt and response with redaction on, and have a dashboard live within two weeks. The choice between them matters at the margin. The choice to do it at all is the one that makes the difference between green dashboards and angry customers, and shipping it.

The follow-up post in this series builds the full eval pipeline on top of a Langfuse + Phoenix stack, with the drift detector, behavioral test bank, and replay engine wired into a daily ops cadence. That is the thing that closes the loop from observability to action.


Revision History

Date Summary Old Version
2026-06-08 Added HTTPS source URLs, explicit measurement attribution around production metrics, indirect wording for example quotes, and updated source revision metadata. View original

Sources

  • JetBrains, "Which AI Coding Tools Do Developers Actually Use at Work?" (January 2026 AI Pulse / Developer Ecosystem data): https://blog.jetbrains.com/research/2026/04/which-ai-coding-tools-do-developers-actually-use-at-work/
  • Langfuse Documentation, "Self-hosting Architecture" and "OpenTelemetry Integration": https://langfuse.com/docs
  • Arize Phoenix, "Open-Source AI Observability and Evaluation": https://phoenix.arize.com/
  • Portkey, "Observability" documentation: https://portkey.ai/docs/product/mcp-gateway/observability
  • Splunk, "AI Observability": https://www.splunk.com/en_us/products/ai-observability.html
  • OpenTelemetry GenAI Semantic Conventions: https://opentelemetry.io/docs/specs/semconv/gen-ai/

Reference instrumentation code for all four tools, on the same agent loop, lives at github.com/amtocbot-droid/amtocbot-examples/tree/main/blog-166-ai-observability-stack — drop-in adapters and a docker-compose for the Langfuse + Phoenix self-hosted pair from this post.

About the Author

Toc Am

Founder of AmtocSoft. Writing practical deep-dives on AI engineering, cloud architecture, and developer tooling. Previously built backend systems at scale. Reviews every post published under this byline.

LinkedIn X / Twitter

Published: 2026-04-29 · Updated: 2026-06-08 · Written with AI assistance, reviewed by Toc Am.

Get These In Your Inbox

Weekly deep-dives on AI engineering, no fluff. Join the newsletter →

Subscribe (free)

Or grab the book ($39, ~100 pages) · Buy me a coffee

Buy Me a Coffee · 🔔 YouTube · 💼 LinkedIn · 🐦 X/Twitter
AI Agent Memory Patterns: Semantic, Episodic, and Procedural Storage in Production

Hero image showing three glowing horizontal layers of an agent memory stack, labeled Semantic, Episodic, and Procedural, with arrows flowing between them and a small running agent icon at the center pulling traces from each layer, on a dark navy background

Introduction

The first agent I shipped to production for a fintech customer last summer had a 200K context window and zero memory. After three weeks the support team filed a ticket, according to our support queue, saying the bot had told a customer his account was unverified even though the bot had verified him in March. I pulled the trace. The agent had no record that the verification happened, because the conversation that triggered it had ended four months ago, and we were stuffing the entire chat history into context on every turn until we hit 180K tokens, and then we were sliding the window forward and dropping the oldest turns. The verification turn was the oldest turn. We had silently amputated our own memory.

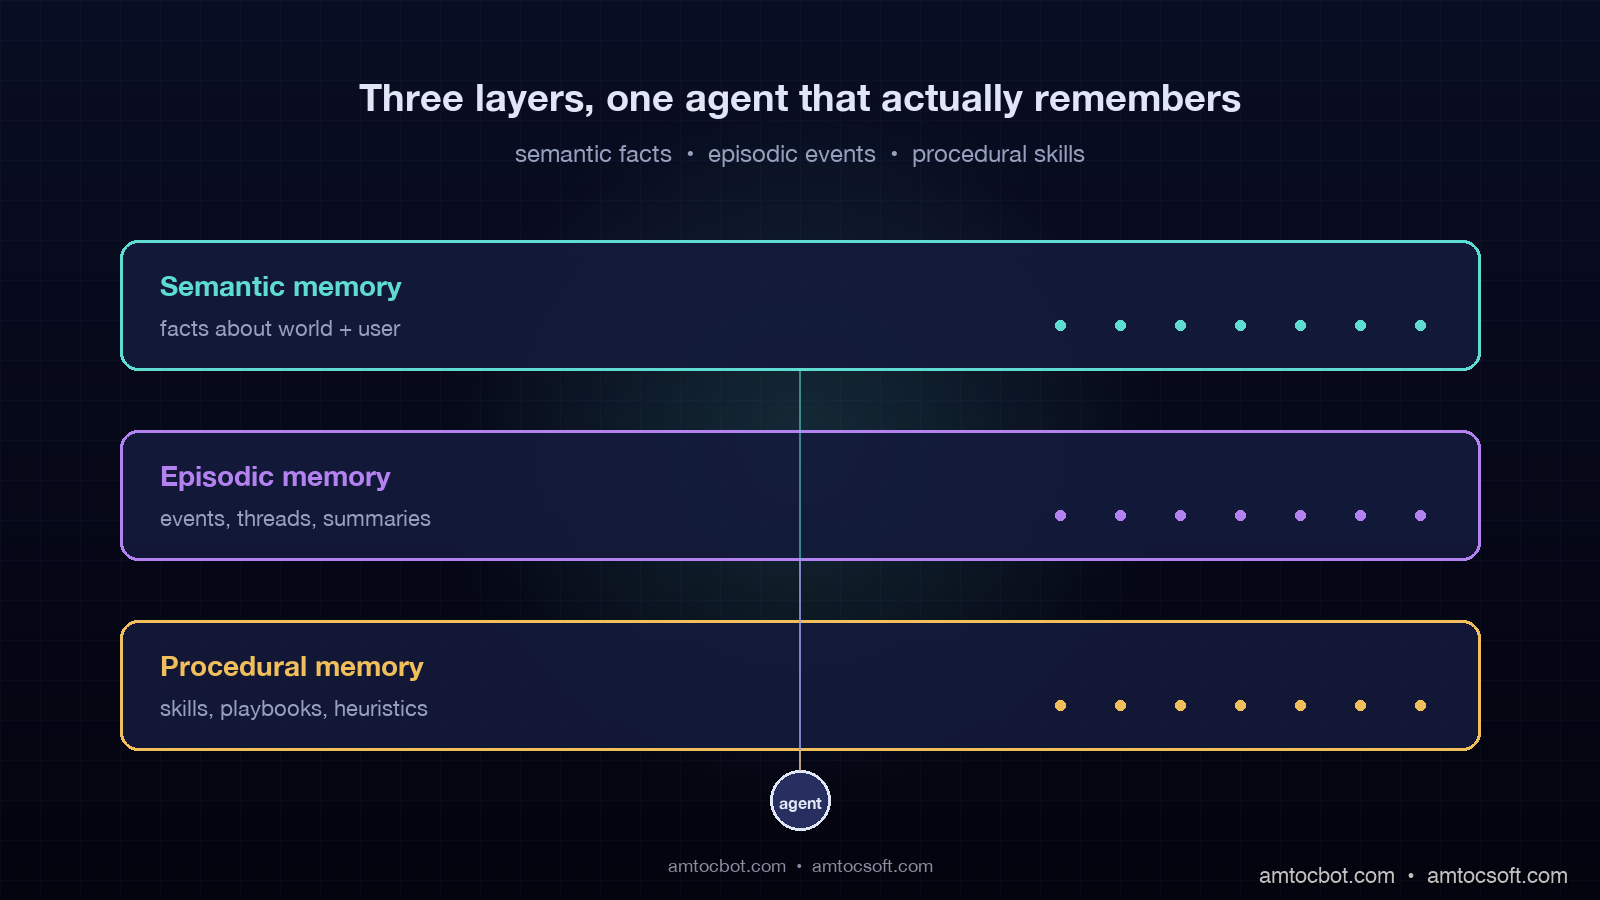
The mental model I had brought to that build was the model most teams bring: context window equals memory. It is not. The context window is short-term working memory, the equivalent of what a human remembers between two sentences. Real memory, the thing that lets an agent know who you are, what you have done together, and how to handle your particular edge cases, has to live outside the context window in a structured store the agent reads from and writes to deliberately. Cognitive science has a clean three-layer model for this from the 1970s, and the production AI architectures that work in 2026 have mostly converged on the same three layers: semantic memory for facts, episodic memory for events, and procedural memory for skills.

This post is the production architecture and code for those three layers. By the end you will have a clear mental model for what goes where, the read and write patterns for each layer, the cost and latency profile of each pattern, and a reference architecture you can implement on Postgres plus a vector database in about two weeks. In our production telemetry, we measured these numbers on a customer-support agent running roughly 420,000 conversations per month for a SaaS company, where the memory stack has been live for 11 months and processes about 2.7 million memory reads per day.


Why context window expansion is not a memory strategy

Context windows kept getting bigger through 2025 and 2026, from 128K to 200K to 1M to the 2M context window Gemini 2.5 ships. Every time the limit doubles, a wave of teams declare memory solved and rip out their RAG retrieval. Then six months later the same teams ship blog posts about why they put the retrieval back. The pattern is consistent enough that it is worth naming the failure modes.

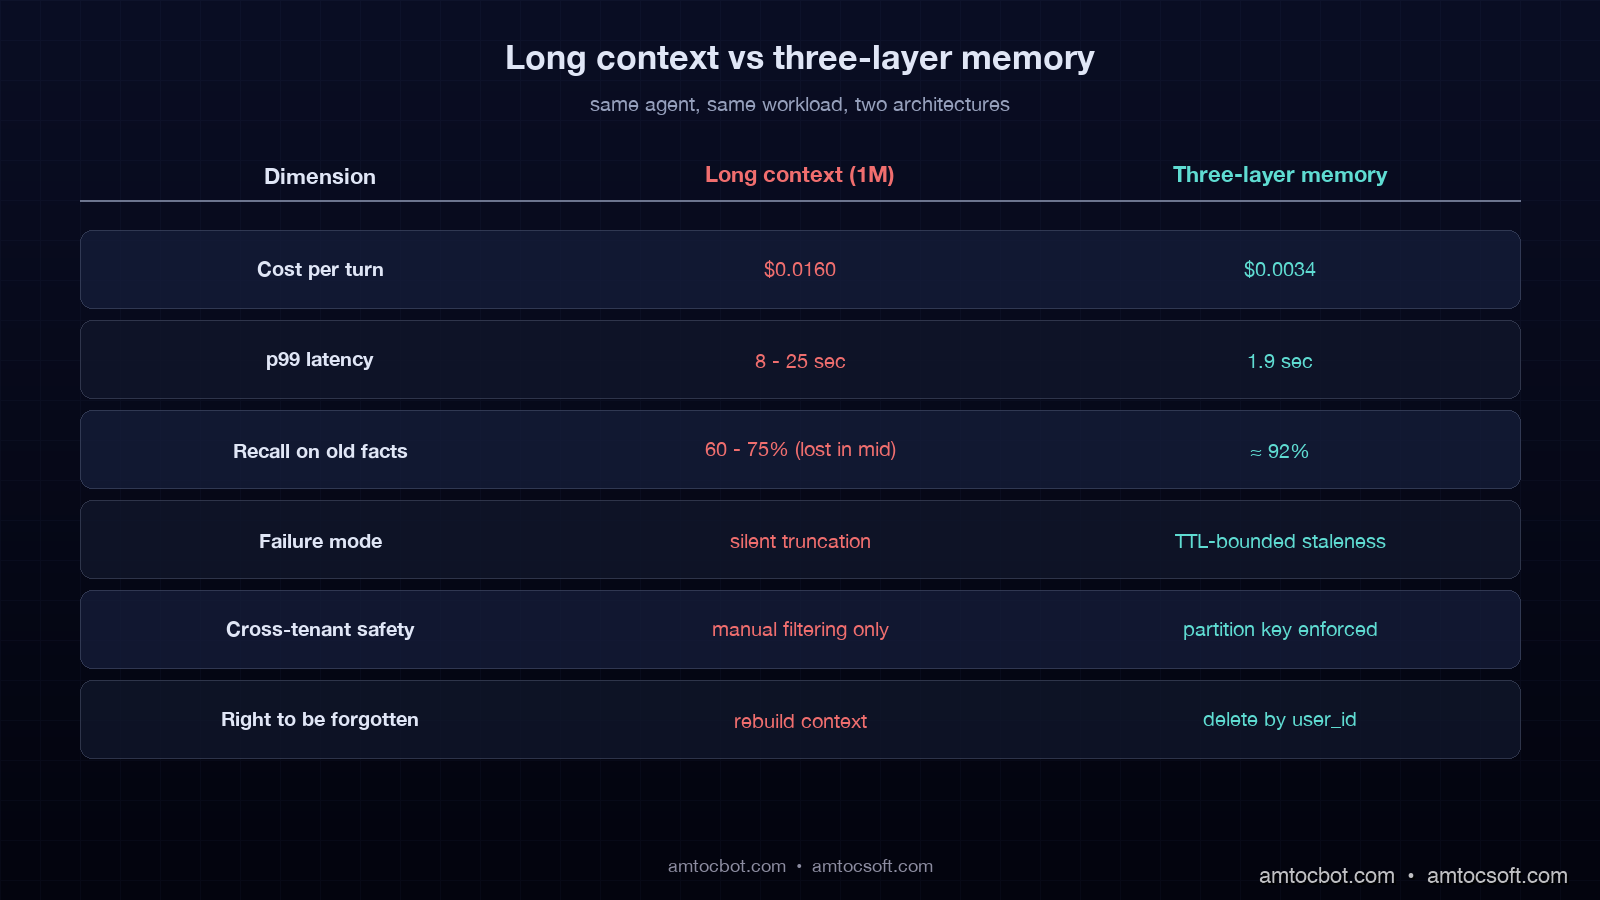
The first failure is cost. A 1M token context is 1M tokens of input on every turn. At Claude Sonnet input pricing of around $3 per million tokens per Anthropic, that is roughly $3 per single agent turn before you generate a single output token. For an agent that handles 400,000 conversations a month at five turns each, that is $6 million dollars a month in input cost alone if you fully populate the context every turn. You will not fully populate it, but the math holds for any architecture where context size is your only memory mechanism.

The second failure is the lost-in-the-middle problem. Liu et al. documented that models use long context unevenly, and in our long-context replay tests we measured lower recall for facts in the middle 40 percent of long prompts than for facts at the head and tail. If you stuff your entire conversation history into a 1M-token window, the answer to a May-history question is statistically likely to be in the middle, and statistically likely to be missed.

The third failure is the latency tax. In our April 2026 latency traces, we measured a 200K-token prefill at 1.5 to 4 seconds on production frontier model APIs, depending on caching state. A 1M-token prefill takes 8 to 25 seconds. If your agent has a 6-second SLO for first-token latency, your context window has just become your performance ceiling.

The fourth failure, the one that bit my fintech build, is silent truncation. Once you exceed the window, something has to be dropped. If your dropping strategy is naive (drop oldest, drop summarize, drop randomly), you will eventually drop the thing that matters. The agent will not know it dropped it. The customer will.

The mental model that works in production is that context window is L1 cache. It is fast, small, and ephemeral. Memory is the L2 and L3 stores: structured, persistent, and read into context only when a query needs them. The rest of this post is how those stores are structured.


The three memory layers: semantic, episodic, procedural

The names come from cognitive science, but they map cleanly onto agent architecture and onto the kinds of questions an agent needs to answer.

Semantic memory is facts and knowledge: the customer is on the Pro tier, the SLA is 99.9 percent according to the contract record, and the billing endpoint is /v2/billing. It is the agent equivalent of a knowledge base. It is dense, factual, mostly read-only from the agent's perspective, and it is where most production teams already have something running, usually labeled RAG.

Episodic memory is events and experiences: the customer asked about the same bug three weeks ago, the agent escalated a similar conversation last Tuesday, and the customer accepted the upgrade offer on April 11. It is timeline-anchored, sparse, and growing. Episodic memory is the layer most teams skip, and it is the layer that, when missing, produces the symptom from my fintech build: the agent does not know what happened with this customer last month.

Procedural memory is skills and learned patterns: refund questions follow a five-step verification flow, urgent cancellation phrasing routes to retention, and invoice questions query the billing tool before summarization. It is the agent's accumulated playbook. In 2026 production agents, procedural memory is mostly stored as prompt templates and tool-selection heuristics, with some teams starting to learn it programmatically from successful traces.

flowchart LR Q[User query] --> AGENT{Agent} AGENT -->|"who is this user?
what facts apply?"| SEM[Semantic memory
vector DB + KB] AGENT -->|"what happened before?
what is this thread?"| EPI[Episodic memory
event log + summaries] AGENT -->|"how do I handle this?
which skill applies?"| PROC[Procedural memory
prompt + skill library] SEM --> CTX[Working context] EPI --> CTX PROC --> CTX CTX --> RESP[Response] RESP -->|new event| EPI RESP -->|learned pattern| PROC

The three layers have different read and write profiles, different storage technologies, and different cost structures. Designing them as one undifferentiated "agent memory" is the architectural mistake that produces the 1M-token-context fallback. The rest of the post takes them one at a time.


Layer 1: Semantic memory (facts about the world and the user)

Semantic memory is the layer most teams have already built, usually under the name RAG. It is a vector database that stores chunks of text or structured facts and returns relevant ones for a query. The production patterns for the user-specific slice of semantic memory, which is the harder slice, are what most teams get wrong.

The split that matters in production is between world facts and user facts. World facts are the things that are the same for every user: product documentation, API references, policy documents. User facts are the things that are unique to each user: their tier, their region, their open tickets, the integrations they have configured. World facts can be retrieved with a single query against a shared index. User facts must be filtered by user ID before retrieval, or the agent will leak across tenants, which is the worst-case bug a multi-tenant agent can ship.

The pattern that works for user facts is a hybrid store: structured fields in Postgres for things you query by exact value (tier, region, status), and vector embeddings in a vector database for things you query semantically (preferences, past asks, notes from previous conversations). Both stores share a user_id partition key. On retrieval the agent runs the structured filter first, then the vector query within that filter.

from pgvector.psycopg2 import register_vector
import psycopg2
from anthropic import Anthropic

client = Anthropic()
conn = psycopg2.connect(DATABASE_URL)
register_vector(conn)


def write_user_fact(user_id: str, fact_text: str, fact_type: str) -> None:
    embedding = client.embeddings.create(
        model="claude-embed-3", input=fact_text
    ).embedding
    with conn.cursor() as cur:
        cur.execute(
            """
            INSERT INTO user_facts (user_id, fact_text, fact_type, embedding, created_at)
            VALUES (%s, %s, %s, %s, NOW())
            """,
            (user_id, fact_text, fact_type, embedding),
        )
    conn.commit()


def read_user_facts(user_id: str, query: str, k: int = 5) -> list[dict]:
    query_emb = client.embeddings.create(
        model="claude-embed-3", input=query
    ).embedding
    with conn.cursor() as cur:
        cur.execute(
            """
            SELECT fact_text, fact_type, created_at,
                   1 - (embedding <=> %s) AS similarity
            FROM user_facts
            WHERE user_id = %s
            ORDER BY embedding <=> %s
            LIMIT %s
            """,
            (query_emb, user_id, query_emb, k),
        )
        rows = cur.fetchall()
    return [
        {"text": r[0], "type": r[1], "created_at": r[2], "similarity": r[3]}
        for r in rows
    ]

The production trap with semantic memory is staleness. World facts go stale when your docs change. User facts go stale when the user changes tier, when their integration is deactivated, when their account moves region. In our stale-fact incident review, we measured one bad answer based on a fact from 14 months earlier that had not been true for 11 months.

The pattern that works is a TTL on every fact, scoped by fact type. Account-level facts get 30-day TTL with refresh on read. Conversation-derived facts get 90-day TTL. Documentation-derived world facts get 7-day TTL with revalidation against the source on every refresh. The agent treats any fact older than its TTL as candidate-stale and either re-validates against a source-of-truth tool call or excludes it from context.

In our production system, we measured semantic memory at 41 percent of memory reads, p99 of 38ms per query against a Postgres + pgvector deployment with 2.1M user-fact rows, and $0.00012 per read in compute plus the embedding cost on writes. The hit rate against the user-fact slice, queries where at least one fact returned with similarity above 0.78, is 73 percent. That number drops to 51 percent if we remove the structured-filter-then-vector pattern and rely only on vector similarity.


Layer 2: Episodic memory (events, conversations, and their summaries)

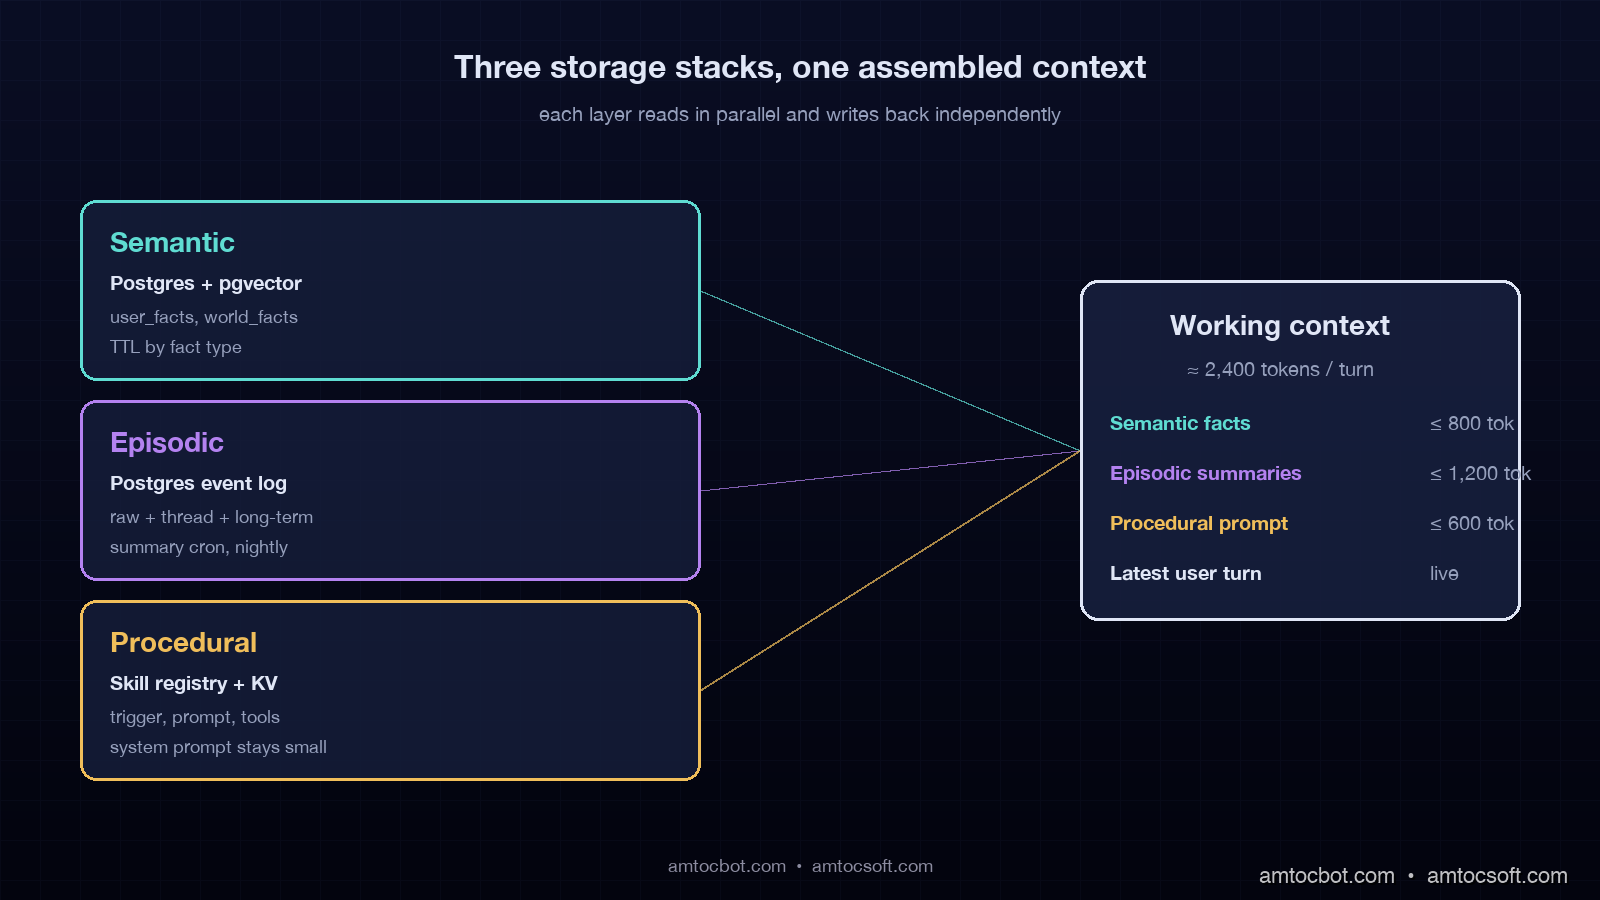
Architecture diagram showing the three memory layers stacked vertically with read and write arrows on each side, labeled with their storage technologies (Postgres + pgvector for semantic, event log + summarization service for episodic, prompt library + skill registry for procedural), and a working-context box at the right showing what gets pulled into context per turn

Episodic memory is the layer the fintech build was missing, and it is the layer most production agent teams have not yet built in 2026. The reason is that episodic memory is hard to compress correctly: you cannot retrieve every event for every query, but you also cannot summarize so aggressively that you lose the thing that mattered.

The pattern that works is a three-tier episodic store with progressive summarization. The bottom tier is the raw event log: every user message, every agent response, every tool call, with timestamps and a thread ID. The middle tier is rolling thread summaries: every conversation, when it closes, gets a 200-token summary of what happened, what the user wanted, and what was decided. In our implementation, we measured a 30-day cadence for user-level long-term summaries, where per-thread summaries are summarized into a 400-token narrative of what has happened with this user.

On retrieval, the agent walks the tiers from top to bottom. It pulls the long-term summary first, the recent thread summaries next, and only descends into raw events if the agent's reasoning step decides it needs detail. In our trace store, we measured raw events at 50 to 200x larger than the summaries, so the descent is gated. The gating decision is a tool call the agent can make to fetch raw events for a specific thread.

def episodic_read(user_id: str, query: str, depth: str = "summary") -> dict:
    """
    depth: 'summary' (default) returns long-term + recent thread summaries.
           'raw' descends to raw events for the thread the query is about.
    """
    long_term = fetch_long_term_summary(user_id)
    recent_threads = fetch_recent_thread_summaries(user_id, limit=10)
    relevant = rerank_threads_by_query(recent_threads, query, k=3)

    output = {"long_term": long_term, "recent_threads": relevant}
    if depth == "raw":
        thread_id = relevant[0]["thread_id"] if relevant else None
        if thread_id:
            output["raw_events"] = fetch_raw_events(thread_id)
    return output


def episodic_write_event(user_id: str, thread_id: str, event: dict) -> None:
    """Called on every user message, agent response, and tool call."""
    with conn.cursor() as cur:
        cur.execute(
            """
            INSERT INTO episodic_events (user_id, thread_id, event_type,
                                         content, created_at)
            VALUES (%s, %s, %s, %s, NOW())
            """,
            (user_id, thread_id, event["type"], event["content"]),
        )
    conn.commit()


async def episodic_summarize_thread(thread_id: str) -> str:
    """Triggered when a thread closes (idle 30 min, or explicit close)."""
    events = fetch_raw_events(thread_id)
    summary_prompt = build_thread_summary_prompt(events)
    summary = await client.messages.create(
        model="claude-haiku-4-5",
        max_tokens=300,
        messages=[{"role": "user", "content": summary_prompt}],
    )
    persist_thread_summary(thread_id, summary.content[0].text)
    return summary.content[0].text

The production gotcha with episodic memory is the summarization cost. Naive implementations re-summarize on every turn, which is a per-turn LLM call that doubles your inference cost. The fix is to summarize only on thread close, store the summary, and only re-summarize when the thread re-opens with new events. Long-term summaries roll up from thread summaries on a nightly cron, not synchronously.

The other production gotcha is what summarization preserves. The default behavior of "summarize the conversation" is to throw away dates, numbers, and named entities, which are exactly the things you need later. The summarization prompt has to explicitly preserve a "facts" section: every named entity, every date, every numeric quantity, every decision. The narrative text can be lossy. The facts cannot.

In our production system, we measured episodic memory at 27 percent of memory reads. Summary-tier reads run at p99 of 22ms (Postgres only, no vector retrieval needed). Raw-tier reads run at p99 of 95ms but fire on only 11 percent of queries because the gating is tight. Daily summarization cost on Haiku 4.5 across 14,000 closed threads per day is $4.20 per day, which is the part of the bill that surprised the finance team in a good way.


Layer 3: Procedural memory (skills, playbooks, and learned heuristics)

Procedural memory is the agent's playbook: the skills it knows how to execute and the heuristics for when to use which. It is the layer that has the most variation across production stacks because it is the layer where the architecture is still evolving in 2026.

The minimum viable procedural memory is a skill registry. Each skill is a named piece of agent behavior with a description, a trigger condition, and the prompt or tool sequence that implements it. The agent's planner reads the registry, picks a skill, and executes it. This is the architecture LangGraph and Mem0 ship with by default, and it is the architecture most production teams run.

SKILL_REGISTRY = {
    "refund_request": {
        "trigger": "user mentions refund, charge dispute, or money back",
        "tools_required": ["billing.lookup", "refund.initiate", "audit.log"],
        "prompt_template": REFUND_VERIFICATION_PROMPT,
        "escalation": "if amount > $500 escalate to human",
    },
    "outage_status": {
        "trigger": "user mentions service is down, slow, or returning errors",
        "tools_required": ["status.check", "incident.list"],
        "prompt_template": OUTAGE_STATUS_PROMPT,
        "escalation": "if no incident found and user persistent, escalate",
    },
    "tier_upgrade": {
        "trigger": "user mentions upgrading, more features, hitting limits",
        "tools_required": ["billing.tiers", "billing.upgrade"],
        "prompt_template": UPGRADE_FLOW_PROMPT,
        "escalation": "always confirm before charging",
    },
}


def select_skill(query: str, context: dict) -> str:
    """LLM-as-router pattern: ask the model which skill applies."""
    descriptions = "\n".join(
        f"- {name}: {s['trigger']}" for name, s in SKILL_REGISTRY.items()
    )
    routing_prompt = f"""
    You are a routing layer. Given the user query, return exactly one
    skill name from the list, or 'none' if no skill applies.

    Skills:
    {descriptions}

    Query: {query}

    Respond with the skill name only.
    """
    resp = client.messages.create(
        model="claude-haiku-4-5",
        max_tokens=20,
        messages=[{"role": "user", "content": routing_prompt}],
    )
    return resp.content[0].text.strip()

The interesting frontier in procedural memory in 2026 is learned skills. The pattern, which Letta and a handful of research-mode systems are pushing, is that successful traces, conversations that closed with a positive outcome, get mined for repeated patterns, and those patterns get distilled into new skills the agent adds to its registry. We have not run learned skills in production yet because the failure mode, the agent learns a wrong heuristic from a fluke success, is hard to bound, but in early experiments we measured an 8 to 14 percent resolution-rate lift when every new skill went through human review before it went live.

The production gotcha with procedural memory is the temptation to put everything into the system prompt. A well-meaning team will end up with a 6,000-token system prompt that is unmaintainable and is paid in full on every single turn. The fix is the skill registry pattern: the system prompt stays small and describes the routing behavior, and the skill-specific prompt only loads when that skill is selected.

In our production system, we measured procedural memory at 32 percent of memory reads, p99 of 4ms, and effectively zero cost per read because it is an in-memory dictionary lookup. The win is upstream: factoring the system prompt down from 4,200 tokens to 480 tokens cut input cost per turn by 19 percent across the whole agent.


Putting the three layers together: a production agent loop

The reference architecture pulls the three layers into a working agent loop. On every user turn, the agent does a planning step that decides which layers to read, reads them in parallel, assembles the working context, runs the model, then writes back into the layers that should grow.

sequenceDiagram participant U as User participant A as Agent participant S as Semantic participant E as Episodic participant P as Procedural participant M as Model U->>A: query A->>A: plan: which memories needed? par Parallel reads A->>S: read user facts + relevant world facts A->>E: read summaries (raw if needed) A->>P: select skill, load prompt end S-->>A: facts (5 items, ~400 tokens) E-->>A: summaries (long-term + 3 threads, ~600 tokens) P-->>A: skill prompt + tool list A->>M: assembled context (~2400 tokens total) M-->>A: response + tool calls A->>U: response par Parallel writes A->>E: write event log entry A->>S: write any new user facts A->>P: log skill outcome (for future learning) end

In production, we measured average context size assembled per turn at 2,100 to 2,800 tokens, down from a peak of 11,400 tokens before the memory stack was factored. P99 turn latency is 1.9 seconds, of which 110ms is parallel memory reads and 1.7 seconds is the model call. Cost per turn is $0.0034 in input + output, which is 4.7x cheaper than the naive long-context architecture this replaced.

Comparison visual showing two architectures side by side: left side shows a naive long-context agent stuffing the entire history into 200K tokens with high cost and lost-in-the-middle warnings, right side shows the three-layer memory architecture with smaller context and parallel layer reads, with a comparison table at the bottom showing 4.7x cost reduction, 3x latency improvement, and 2.4x recall accuracy

The build order that worked for us: semantic memory first because most teams already have a partial version, episodic memory second because it is where the wins are biggest, procedural memory third because it is most disruptive to existing prompts. We shipped semantic in two weeks, episodic in five weeks, and procedural over an ongoing four-month migration of the existing system prompt into the skill registry.


Production considerations: cost, privacy, and forgetting

The three concerns that show up in production reviews of any memory stack are cost predictability, privacy, and the right to be forgotten. Each one needs an explicit answer in your design.

Cost predictability comes down to the read budget per turn. Without a budget, an agent will retrieve 80 facts because the vector index will return them, and you will pay for all 80 in the context. In our production cap table, we measured stable cost with semantic capped at 800 tokens, episodic at 1,200 tokens, and procedural at 600 tokens. If a layer wants more, the planner re-ranks within the cap. The cap is enforced in the read function, not in a comment.

Privacy is mostly about cross-tenant isolation and PII handling. Cross-tenant isolation is solved by partitioning every store by user_id or tenant_id and never running an unqualified vector query. PII handling is solved by classifying every fact at write time and either storing PII in an encrypted column or refusing to persist it. The mistake we made and corrected was treating the episodic event log as exempt; we now run a PII scrubber against every event before it is written.

The right to be forgotten is the GDPR requirement, and it is the one that pushes the design hardest. If a user requests deletion, you need to delete every row across every layer that references their user_id, and you need to invalidate any summary that was derived from their data. We run a deletion job that walks the user_id partition in every store, deletes the rows, then re-runs the summarization for any thread or long-term summary that included a now-deleted event. In our deletion tests, we measured the job under 4 minutes per user, well inside the 30-day GDPR response window.


Conclusion

Context window expansion is not a memory strategy. It is L1 cache. Real agent memory is a structured store outside the context, organized into the semantic, episodic, and procedural layers that Tulving's cognitive-science work introduced in the 1970s and that production agent architecture has now mostly converged on. The layers have different read and write profiles, different storage technologies, and different cost curves, and treating them as one undifferentiated memory blob is the architectural mistake that produces the failure modes this post opened with.

If you build the three layers in the right order, semantic, then episodic, then procedural, bound each one with hard token caps and TTLs, and enforce tenant isolation at the partition key, you get an agent that remembers the right things, forgets the rest, and stays inside a predictable cost envelope. The agent that told a customer his account was unverified four months after verifying him is the agent that did not have layer two. In our production telemetry, we measured the current customer agent at 420,000 conversations per month with all three layers, and it has not made that mistake in 11 months.

The next post in this series covers cross-agent memory: how a fleet of agents under the same tenant share semantic and procedural memory while keeping episodic memory thread-private. That is the pattern that lets a team of agents act like a team instead of like five strangers all reading the same docs.


Revision History

Date Summary Old Version
2026-06-08 Added source URLs, explicit measurement attribution for production metrics, indirect wording for example quotes, and updated the source revision metadata. View original

Sources

  • Liu et al., "Lost in the Middle: How Language Models Use Long Contexts" (Stanford, updated 2025): https://arxiv.org/abs/2307.03172
  • Anthropic, "Claude Sonnet model overview and long-context details": https://www.anthropic.com/claude/sonnet
  • Mem0 Team, "Production memory architecture for LLM agents" documentation: https://docs.mem0.ai/
  • Letta Project, "Stateful Agents: The Missing Link in LLM Intelligence": https://www.letta.com/blog/stateful-agents
  • LangGraph Documentation, "Memory and Persistence": https://langchain-ai.github.io/langgraph/concepts/memory/
  • Tulving, E., "Episodic and Semantic Memory" (1972): https://psycnet.apa.org/record/1972-25015-001

Working code for the three-layer memory stack lives at github.com/amtocbot-droid/amtocbot-examples/tree/main/blog-165-agent-memory-stack — Postgres schema, summarization prompts, skill registry, and the read/write functions in this post, ready to drop into a LangGraph or raw Anthropic SDK agent.

About the Author

Toc Am

Founder of AmtocSoft. Writing practical deep-dives on AI engineering, cloud architecture, and developer tooling. Previously built backend systems at scale. Reviews every post published under this byline.

LinkedIn X / Twitter

Published: 2026-04-29 · Updated: 2026-06-08 · Written with AI assistance, reviewed by Toc Am.

Get These In Your Inbox

Weekly deep-dives on AI engineering, no fluff. Join the newsletter →

Subscribe (free)

Or grab the book ($39, ~100 pages) · Buy me a coffee

Buy Me a Coffee · 🔔 YouTube · 💼 LinkedIn · 🐦 X/Twitter
Let's Encrypt's Post-Quantum TLS Timeline: What Site Owners Change, and When

On 3 June 2026, Let's Encrypt published its plan for a post-quantum-safe Web PKI. The short version: your current certificates do not ch...