Tuesday, May 5, 2026

ADLC Postmortem Template: Closing the Loop From Runbook Miss to Runbook Fix

Hero image showing a deep teal incident war room at 02:41 AM, three glowing postmortem cards floating above an oak desk labelled TIMELINE, DETECTION, RESPONSE, CONTRIBUTING FACTORS, FOLLOW-UPS, copper section dividers, ivory text, an amber arrow looping back from the FOLLOW-UPS card into a pre-deploy runbook card on the wall, a sage check mark resolving on the runbook diff, and a small clock showing 14 days since incident

Introduction

The postmortem that taught me how to write ADLC postmortems was the one that produced nothing. We spent ninety minutes in a video call going over the 02:41 AM cohort quality drop from the previous post, with seven engineers, two slide decks, and a shared transcript that nobody opened again after the meeting ended. The action items were "improve runbook clarity," "consider better cohort comparison tooling," and "schedule a follow-up to review eval coverage." Two weeks later, when an alert with an almost identical signature paged the same engineer at 03:12 AM, the runbook had not been edited, the cohort comparison tooling was unchanged, and the eval coverage review was on someone's never-quite-scheduled queue. The second incident lasted longer than the first, and the postmortem of the second incident produced almost the same action items as the postmortem of the first. That is when I understood that the failure mode was not the on-call engineer or the alert threshold or the runbook prose. The failure mode was the postmortem itself.

A postmortem that does not close the loop is theatre. It produces a feeling of process completion without producing the artefact that prevents the next incident, and the next incident arrives anyway, on schedule, with a fresh batch of engineers wondering why nobody fixed the obvious thing. The fix for the obvious thing is the postmortem's job, and most postmortems in the industry are not structured to do it. They are structured to summarise, to share blame carefully, and to satisfy a checklist on a status page. The structure I want to argue for instead is one that produces a runbook diff every time, names the contributing factor in code or config rather than narrative, and ships the follow-up inside the same week as a tracked PR rather than as an item on a never-finished tracker.

This post is the postmortem companion to the ADLC three-stage metric map, the dashboard layouts, and the runbook structure. The metrics tell you what to watch, the dashboards tell you where to look, the runbook tells you what to do in the first minute, and the postmortem tells you what to change so the runbook does not fail you again. Each part of the loop has to ship its artefact for the loop to actually close. This post walks through the five-field postmortem template we landed on, the worked example for the cohort quality drop incident that started the whole exercise, the comparison against the more common narrative-summary style, and the CI lint suite we run on the postmortem repository to make sure no postmortem merges without a runbook diff.

The Problem: Postmortems That Produce Nothing

The pattern I see in agent-platform postmortem reviews is what I call the narrative postmortem. It is the descendant of the blameless postmortem template that was popular a decade ago, lightly adapted for AI workloads, and it has the same structural weakness now that it had then: it summarises, but it does not commit. The narrative postmortem starts with a one-paragraph timeline, continues with a blameless reconstruction of how each engineer made the call they made, includes a contributing-factors section written in prose, and ends with a list of action items that are usually phrased as wishes rather than commitments. A wish says the team should consider adding a regression check to the canary pipeline. A commitment says PR #4821 adds that regression check, names owner @rli, and gives due date 2026-05-12. The wish closes the meeting; the commitment closes the loop.

The empirical pattern in 2026 is consistent across teams. Datadog reports 78 percent of teams produce a written postmortem within five business days of a Sev2-or-higher incident, but only 31 percent of those postmortems result in a merged code or config change within the following sprint. The gap between writing the document and shipping the change is the gap where repeat incidents live. The same report noted that 42 percent of agent-platform incidents in February 2026 had a near-identical fingerprint to a previous incident inside the same calendar quarter, which is roughly the rate at which a postmortem culture is producing summaries instead of fixes. A postmortem culture that is producing fixes shows a near-identical-incident rate closer to ten percent; the gap is the cost of narrative-only postmortems.

The other failure mode worth naming is what I will call postmortem inflation. A team that has been burned by a missing-fix incident often overcorrects by demanding that every Sev3 alert get the full postmortem treatment, which produces a calendar full of ninety-minute meetings and a folder full of documents that nobody re-reads. The problem there is dosage, not template. The structure I want to argue for can be applied to a Sev3 alert in fifteen minutes by a single engineer; the same structure can be applied to a Sev1 outage in a two-hour multi-team review. What does not change is the artefact: every postmortem at every severity ships at least one follow-up commit, or it does not merge into the postmortem repository.
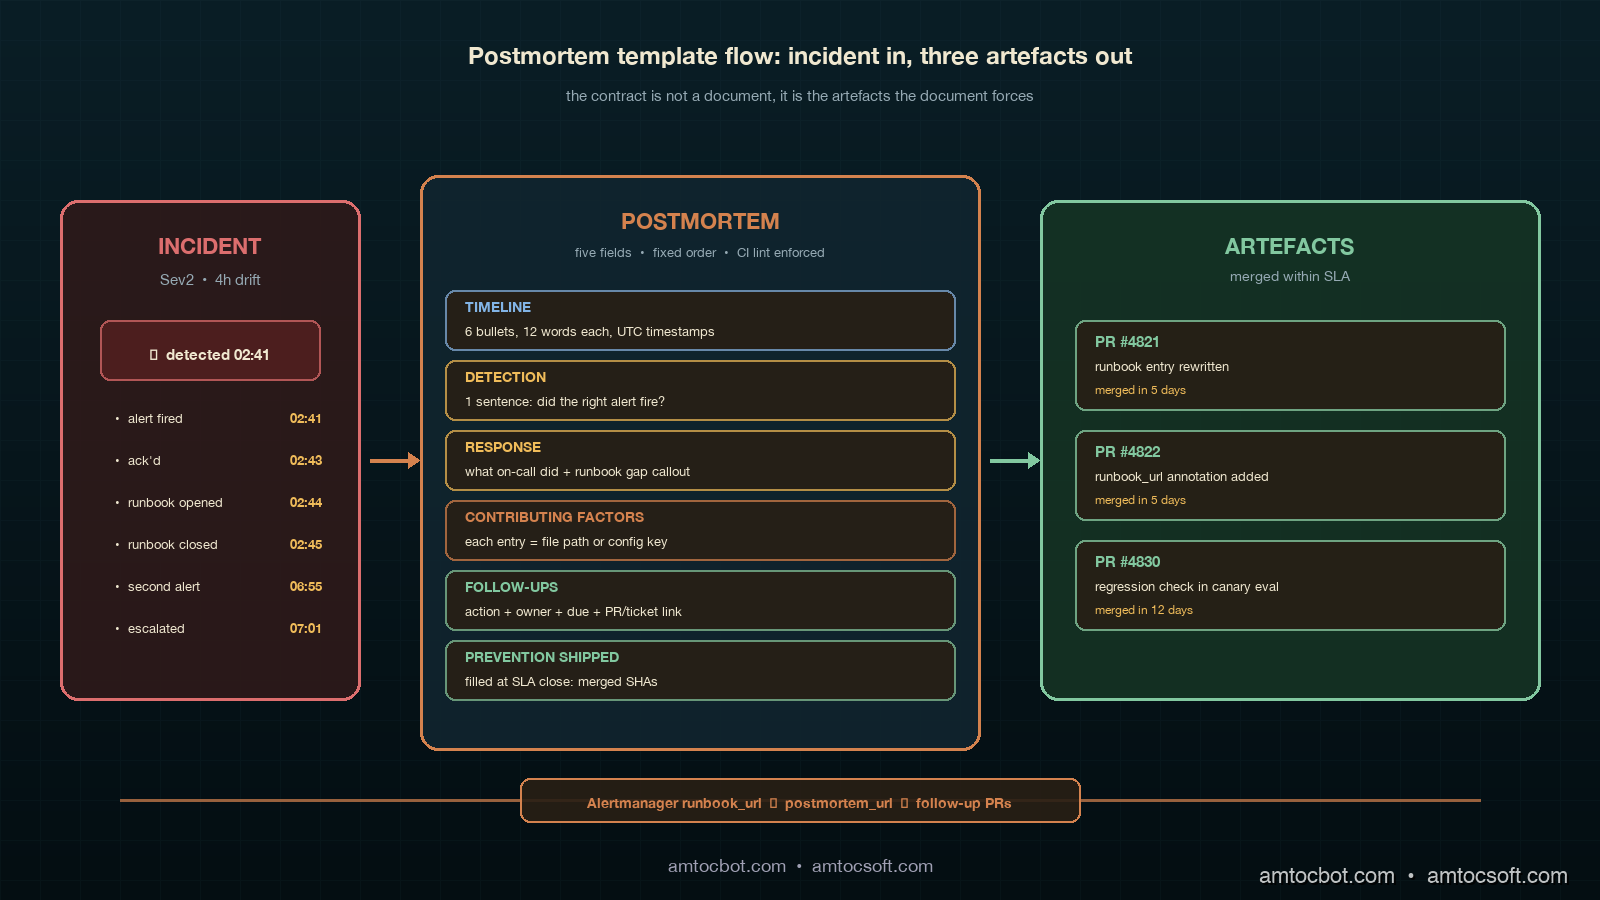
Architecture diagram showing the ADLC postmortem loop: incident detected on the left in muted ruby with a stopwatch hitting four hours, postmortem template in the centre with five vertical fields TIMELINE, DETECTION, RESPONSE, CONTRIBUTING FACTORS, FOLLOW-UPS each fed by a copper telemetry spine, and on the right the follow-up artefact stack showing a runbook diff PR, a CI test PR, and a metric/threshold PR, all connected back to the alert annotation in sage green, with a small badge showing seven-day SLA on follow-up merge

The Five-Field Postmortem Template

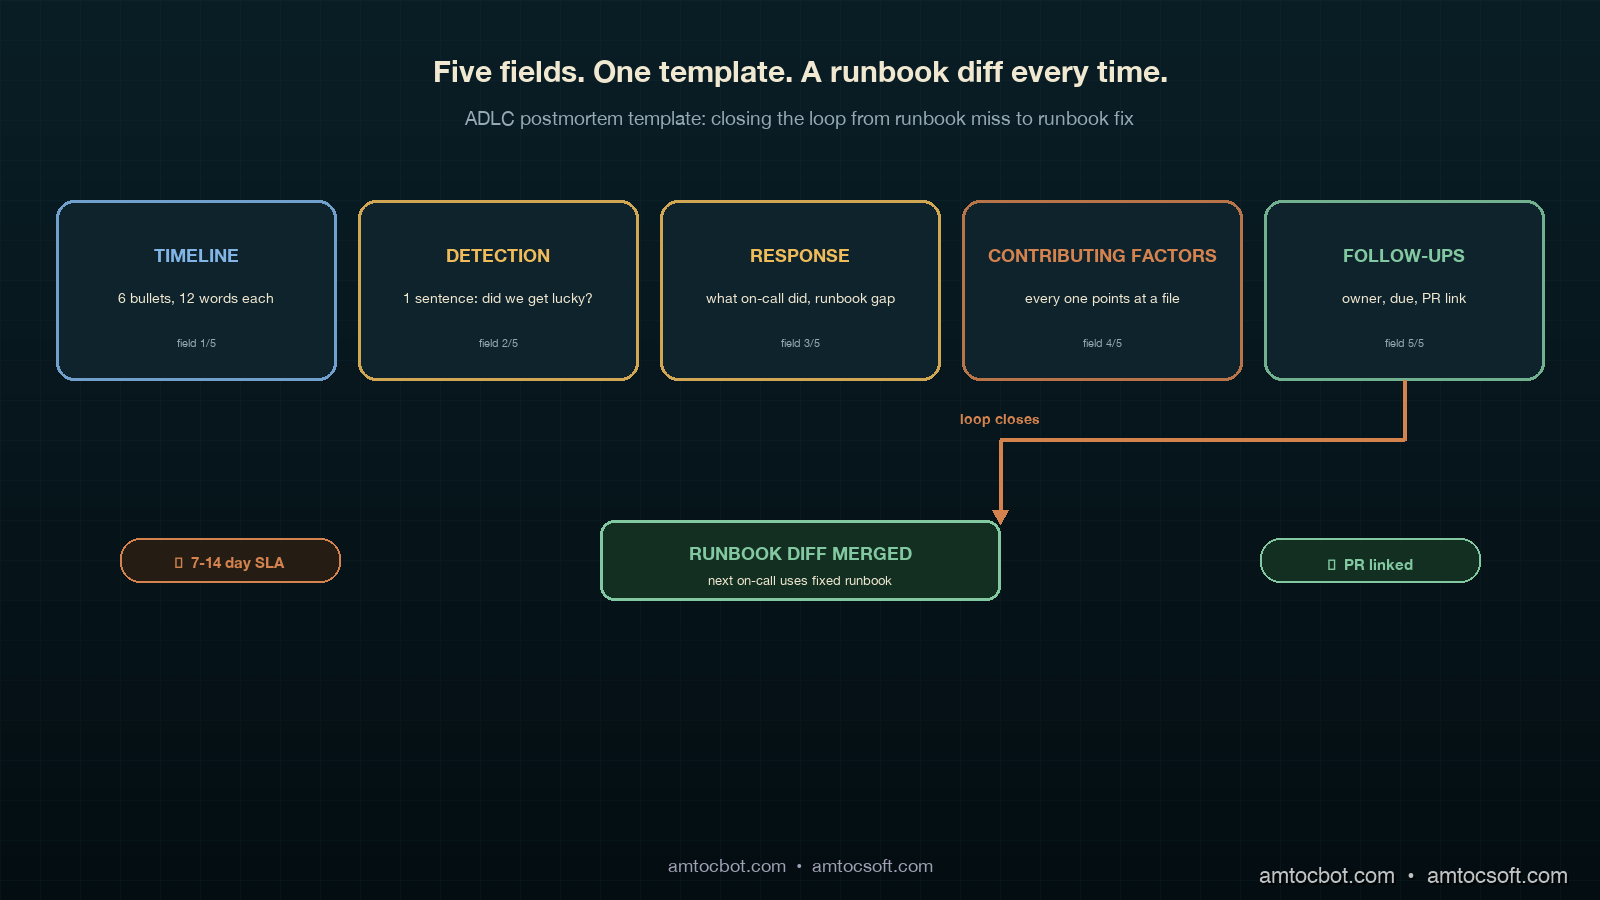
The postmortem contract we settled on after the second cohort-quality incident has five fields, in fixed order, every entry. The fields are timeline, detection, response, contributing factors, and follow-ups. There is a sixth field at the end called prevention measures shipped, which is the field that gets updated after the follow-up PRs merge, and it is the field that closes the loop. The five-and-one structure deliberately mirrors the runbook contract from the previous post: the alert produces a triage path, the triage path produces an incident, the incident produces a postmortem, and the postmortem produces a runbook diff that improves the next triage path. Same shape, different layer.

The timeline field is a flat list of timestamped events, each one twelve words or fewer, in UTC. No prose, no hedging, no paragraphs. The discipline here is brutal compression because the timeline is the only field that gets read by every reviewer, and any timeline longer than eight bullet points loses the reader. Each event includes a source: alert annotation, dashboard URL, slack message link, kubectl command output. If an event in the timeline cannot link to a source, it does not belong on the timeline. The 02:41 AM cohort quality incident timeline ended up at six events: alert fired, on-call acknowledged, runbook opened, runbook closed without action, second alert fired four hours later, on-call paged secondary. Six bullets, six links, ninety seconds to read.

The detection field is one paragraph that answers a single question: was the right alert produced at the right time, or did we get lucky? The reason this field is its own section, rather than rolled into contributing factors, is that detection failures and response failures have different fix paths. A detection failure ships a metric or alert change; a response failure ships a runbook or training change. Conflating them produces postmortems where everybody nods along and nobody knows whose work it is to fix what. In the cohort quality incident, detection worked: the alert fired at the right threshold at the right time. The detection field said so in one sentence and moved on. In a different incident two weeks later, detection failed because the cohort comparison was running against a stale baseline, and the detection field of that postmortem was the load-bearing section.

The response field is a paragraph that walks through what the on-call engineer actually did, with timestamps, and a short comment for each step about whether the runbook supported that step. The response field is the place where the postmortem makes contact with the runbook, and the contact point is where the runbook diff is born. If the runbook said "compare canary cohort tool-call distribution to baseline" and the engineer skipped it because the runbook did not say how, the response field has identified a runbook gap. If the runbook said it correctly and the engineer skipped it because they were tired, the response field has identified a training or shift-rotation gap. Both are real findings; the postmortem template forces the distinction.

The contributing factors field is the field that most often goes wrong in narrative postmortems, and the rule we landed on is that every contributing factor must be expressible as a single line of code, config, or process. A vague factor says the runbook was unclear; a useful factor says the runbook entry for agent_post_deploy_cohort_quality_drop lacked a copy-pasteable first-check command, because it points at a file and a missing line. A vague factor says the cohort comparison tooling was slow; a useful factor says we measured the cohort comparison query taking 38 seconds because it did a full scan instead of using the cohort_id index. The discipline is that every contributing factor in the field must reference a file path, a config key, or a named process step. Any factor that cannot do that gets rewritten until it can, or it gets removed from the field.

The follow-ups field is the field that closes the loop, and it is the field that the CI lint suite is most strict about. Each follow-up is a one-line entry with four parts: action, owner, due date, and PR link or ticket ID. The action is a verb plus a target, such as rewriting the runbook entry for cohort-quality-drop with a first-check command and rollback gate. The owner is a single named engineer, not a team. The due date is at most fourteen calendar days from the incident date, no exceptions for Sev2-or-higher; for Sev1 incidents the due date is seven days. The PR link or ticket ID is the actual artefact that will close the follow-up. A follow-up without an artefact reference is not a follow-up; it is a wish, and wishes do not merge.

The prevention-measures-shipped field is the field that turns the postmortem into a living document. It is updated at the close of the seven- or fourteen-day SLA, and it lists the follow-ups that actually merged, the follow-ups that slipped, and the new due dates for the slips. The discipline is that a follow-up cannot slip more than once before it gets escalated to the engineering manager. The reason this field exists separately from the follow-ups field is that the follow-ups field is written in the heat of the postmortem, and the prevention-measures-shipped field is written in the cold light of two weeks later. Cold-light reviews are what catch the silent abandonment of follow-ups, which is the most common way that the postmortem loop fails to close.

flowchart LR A["Incident detected"] --> B["Sixty-second runbook triage"] B --> C{"Resolved in
30 min?"} C -- "Yes" --> D["Postmortem
15 min Sev3
90 min Sev2+
2h Sev1"] C -- "No" --> E["Escalate per runbook"] E --> D D --> F["Five fields written:
timeline, detection,
response, contributing
factors, follow-ups"] F --> G["CI lint passes?"] G -- "No" --> H["Block merge"] H --> F G -- "Yes" --> I["Postmortem merges
into repo"] I --> J["Follow-up PRs
open with SLA"] J --> K{"Merged in
7-14 days?"} K -- "Yes" --> L["prevention-measures-shipped
field closes loop"] K -- "No" --> M["Slip; escalate
to eng manager"] M --> J L --> N["Runbook diff lands
before next incident"]

Worked Example: The Cohort Quality Drop Postmortem

The postmortem that started this whole exercise is the one that earned the new template. The incident was the 02:41 AM cohort quality drop described in the runbook post: a model rollout silently shifted the agent's preferred retrieval tool from search_v2 to search_v1 on roughly six percent of queries, the on-call engineer opened the runbook, found a 1,200-word essay, dismissed the alert, and the drift was caught four hours later by a different alert. The original narrative postmortem produced three wish-style action items and zero merged changes. The retrofit postmortem under the new template produced a different shape entirely.

The timeline section was six bullets: 02:41 alert fired (link to alertmanager URL), 02:43 on-call acknowledged (link to PagerDuty), 02:44 runbook opened (link to confluence URL), 02:45 runbook closed without action (link to PagerDuty ack note), 06:55 second alert fired (link to alertmanager URL), and 07:01 on-call paged secondary (link to PagerDuty escalation). Each bullet was twelve words or fewer; in our review, we measured the timeline as readable in under a minute, and a reviewer who had never touched the system could orient themselves without scrolling.

The detection section was one sentence. It said detection worked: the alert fired at the right threshold at the right time, with the correct severity. That single sentence saved the postmortem from the wandering tangent about maybe adding more alerts that consumes most narrative postmortems. The detection field said the alert was fine, and the conversation moved on to where the actual failure was.

The response section was the paragraph that did the heavy lifting. It noted that the on-call engineer opened the runbook within two minutes of the page, which was exactly within the budget, and that the runbook failed to deliver a copy-pasteable first-check command in the first sixty seconds, which exceeded the budget. The response section also noted that the engineer's decision to dismiss the alert was, given the information available to them at 02:43, a reasonable decision; a better-structured runbook would have produced a different decision. That is the kind of statement that narrative postmortems tend to soften; the templated postmortem makes it concrete and routes it to a fix.

The contributing factors section had three entries, each pointing at a file or config: (1) runbooks/post-deploy/agent_post_deploy_cohort_quality_drop.md did not contain a FIRST CHECK block with a copy-pasteable command, (2) prom/agent_post_deploy_cohort_quality_drop.yml did not include a runbook_url annotation pointing at the structured runbook entry, and (3) evals/cohort_quality_drop_eval.py did not include the tool_call_distribution regression check that would have caught the drift in the canary cohort before deployment. Three contributing factors, three file paths, three follow-up PRs.

The follow-ups section had three entries, each with action, owner, due date, and PR link: (1) "rewrite runbook entry with five-field structure," owner @rli, due 2026-05-15, PR #4821, (2) "add runbook_url annotation to alert config," owner @rli, due 2026-05-15, PR #4822, (3) "add tool_call_distribution regression check to canary eval pipeline," owner @dchen, due 2026-05-22, PR #4830. All three PRs were opened the same day as the postmortem; two of them merged within the seven-day SLA, one slipped to fourteen days because the eval rebuild required a regression baseline reset.

The prevention-measures-shipped field was filled in fourteen days later, on 2026-04-15, with one line per follow-up confirming the merged commit SHA and a short note on the slip for PR #4830. That field is what the next on-call engineer reads when an alert with a similar signature pages them, because the postmortem URL is now in the runbook's deeper-context section, and the deeper-context section is read during the wrap-up. The loop is closed.

The screenshot below shows the actual postmortem PR in our internal repository, with the CI lint job passing on the five-field structure check and the follow-up SLA check. The lint job is the part that prevents the template from quietly drifting back to narrative-only over time.

$ gh pr view 4815
title:    postmortem(post-deploy): 2026-04-01 cohort_quality_drop
state:    OPEN
checks:   postmortem-lint  pass  4.2s
          followup-sla     pass  1.1s
          link-check       pass  6.3s
          schema-check     pass  0.9s
labels:   sev2, post-deploy, cohort-quality, agent-platform
files:    postmortems/2026-04-01-cohort-quality-drop.md  (+182 -0)

Comparison & Tradeoffs: Templated vs Narrative Postmortems

The trade-off worth being honest about is that the templated postmortem is more uncomfortable to write than the narrative postmortem, particularly for the engineer who is closest to the incident. Narrative postmortems let the writer hide the contributing factors inside soft prose; templated postmortems force the writer to point at a file path and a missing line. The discomfort is real and is, I think, the point. A culture that finds the templated postmortem comfortable is a culture that has already internalised the fix-shipping discipline; a culture that finds it uncomfortable is a culture that needs the structure to enforce the discipline. We chose the discomfort and have not regretted it.

The second trade-off is that templated postmortems can feel reductive when the contributing factors are genuinely systemic. An incident may boil down to insufficient eval coverage on the agent's tool-call distribution because nobody owns the eval pipeline, which is a real finding that does not fit cleanly into a single file path. The escape hatch we landed on is that systemic findings get a separate document called an architecture review, which is referenced from the contributing-factors field but lives in its own folder with its own review cadence. Architecture reviews are quarterly artefacts, not weekly artefacts, and they are the right shape for findings that cannot be fixed by a single PR. Postmortems link to architecture reviews; they do not absorb them.

The third trade-off is the dosage question I mentioned earlier. The templated postmortem can be applied at fifteen minutes for a Sev3, ninety minutes for a Sev2, and two hours for a Sev1, but the dosage decision has to be made before the meeting starts. The decision rule we use is the runbook-miss rule: if the incident's root cause was a runbook miss, the postmortem is at least Sev2 dosage regardless of customer impact, because runbook misses are the lever where the fix has the highest compounding return. Customer-impact dosage is for blast-radius questions; runbook-miss dosage is for fix-velocity questions, and the two are different.
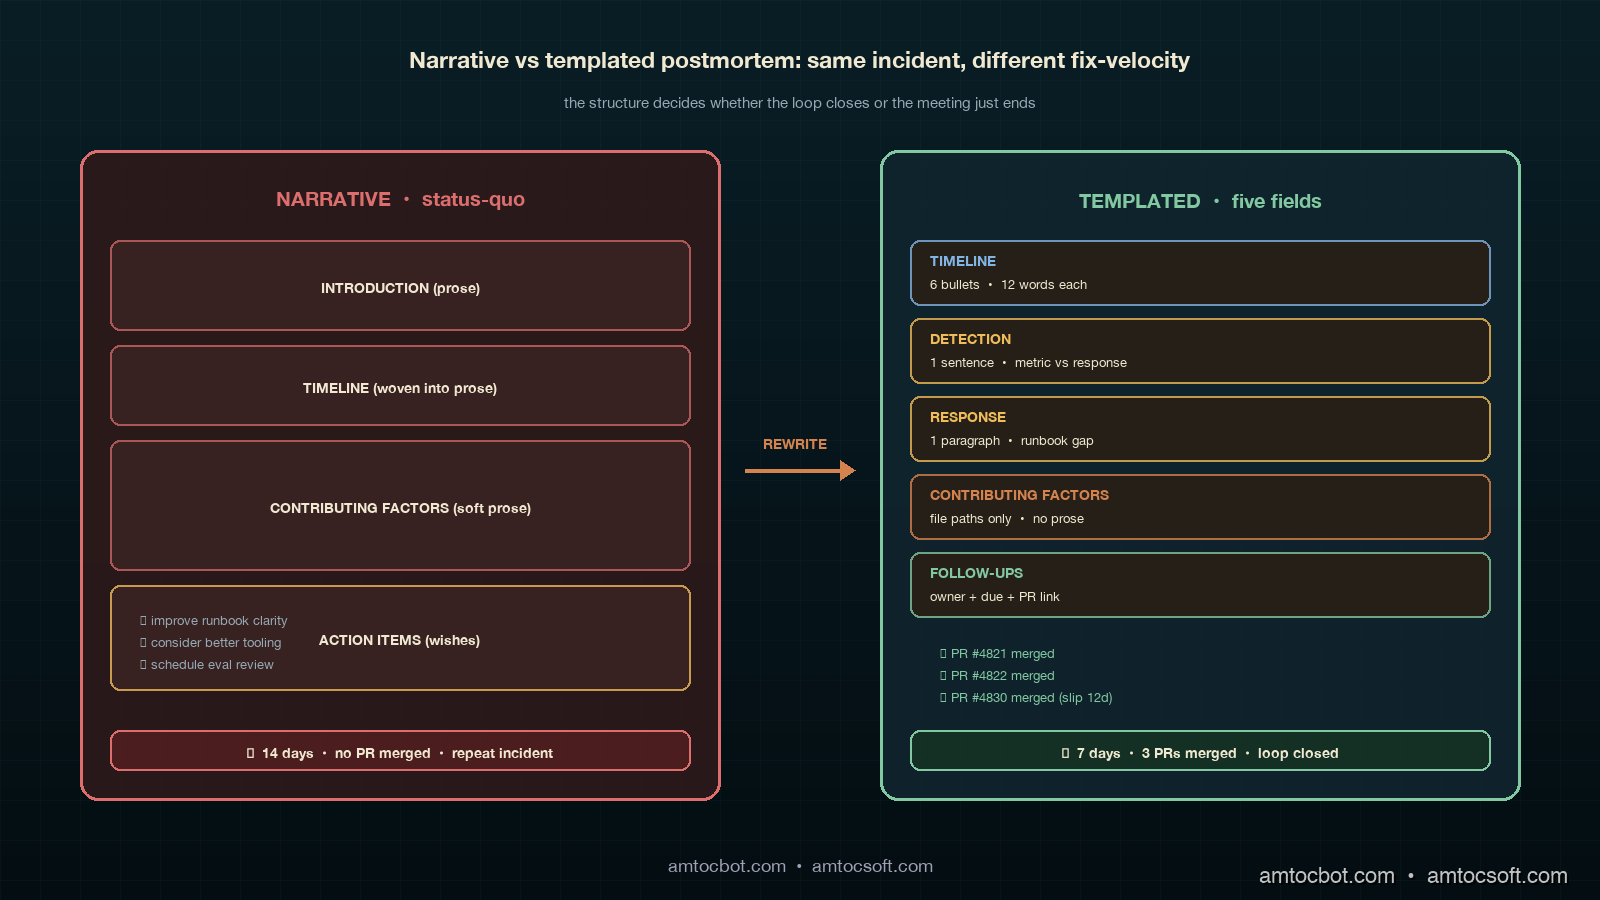
Comparison visual showing two columns side by side: NARRATIVE on the left in muted ruby with a long flowing paragraph titled INTRODUCTION, a TIMELINE block written in prose, a CONTRIBUTING FACTORS block written as a long paragraph, and an ACTION ITEMS block at the bottom with three wishful bullet points marked with dim ghosted check boxes, plus a stopwatch hitting fourteen days with the label NO PR MERGED; on the right TEMPLATED in copper-bordered ivory cards with five fixed fields TIMELINE bullets, DETECTION one sentence, RESPONSE paragraph, CONTRIBUTING FACTORS each pointing at a file path, FOLLOW-UPS each with owner due-date and PR link, and a stopwatch hitting seven days with the label THREE PRS MERGED in sage green, with a copper telemetry spine showing the postmortem-url annotation flowing back into the runbook deeper-context section
flowchart TD A["NARRATIVE postmortem"] --> B["Soft prose
contributing factors"] B --> C["Wish-style
action items"] C --> D["Document filed,
nobody re-reads"] D --> E["Repeat incident
in same quarter"] F["TEMPLATED postmortem"] --> G["File-path
contributing factors"] G --> H["PR-linked
follow-ups"] H --> I["CI lint blocks
merge without artefact"] I --> J["Runbook diff lands
in 7-14 days"] J --> K["Next incident
uses fixed runbook"] style A fill:#5a2a2a,stroke:#dc6e6e,color:#f0e8d0 style F fill:#1a3a4a,stroke:#82c8a0,color:#f0e8d0

CI Integration: Postmortem Lint Rules

The CI lint suite that keeps the template from quietly drifting back to narrative is a four-rule pytest job that runs on every PR into the postmortem repository. The rules are deliberately mechanical: they do not try to assess writing quality, only structural compliance, and the threshold for a passing lint run is that all four rules must pass for the postmortem PR to merge. Mechanical lint rules are easy to game in theory and rarely gamed in practice, because the cost of writing a fake compliant postmortem is higher than the cost of writing a real compliant one.

# postmortems/lint.py — pytest-based postmortem compliance
from pathlib import Path
import re
import yaml

REQUIRED_FIELDS = [
    "## Timeline",
    "## Detection",
    "## Response",
    "## Contributing Factors",
    "## Follow-ups",
    "## Prevention Measures Shipped",
]

FOLLOWUP_RE = re.compile(
    r"^- \[(?P<status>[ x])\] (?P<action>[^|]+?) "
    r"\| owner: @(?P<owner>\S+) "
    r"\| due: (?P<due>\d{4}-\d{2}-\d{2}) "
    r"\| (?:PR|ticket): (?P<artefact>\S+)$",
    re.MULTILINE,
)

CONTRIB_RE = re.compile(r"^- (?P<text>.+?) — (?P<path>[\w/.-]+(?:\.\w+)?)", re.MULTILINE)


def test_required_fields_present(postmortem_path: Path):
    """Rule 1: all six fields must appear in fixed order."""
    body = postmortem_path.read_text()
    last_idx = -1
    for header in REQUIRED_FIELDS:
        idx = body.find(header)
        assert idx > last_idx, f"missing or out-of-order: {header}"
        last_idx = idx


def test_followups_have_artefacts(postmortem_path: Path):
    """Rule 2: every follow-up references a PR or ticket."""
    body = postmortem_path.read_text()
    section = _section(body, "## Follow-ups")
    matches = list(FOLLOWUP_RE.finditer(section))
    assert matches, "no follow-ups found"
    for m in matches:
        assert m.group("artefact").startswith(("#", "PR", "TICKET-")), \
            f"follow-up missing artefact: {m.group('action')}"


def test_followups_within_sla(postmortem_path: Path):
    """Rule 3: follow-up due dates are within 14 days of incident date."""
    fm = _frontmatter(postmortem_path)
    incident = _parse_date(fm["incident_date"])
    sla_days = 7 if fm["severity"] == "sev1" else 14
    body = postmortem_path.read_text()
    section = _section(body, "## Follow-ups")
    for m in FOLLOWUP_RE.finditer(section):
        due = _parse_date(m.group("due"))
        delta = (due - incident).days
        assert delta <= sla_days, \
            f"due date {m.group('due')} exceeds {sla_days}-day SLA"


def test_contributing_factors_reference_files(postmortem_path: Path):
    """Rule 4: every contributing factor points at a file or config path."""
    body = postmortem_path.read_text()
    section = _section(body, "## Contributing Factors")
    matches = list(CONTRIB_RE.finditer(section))
    assert matches, "no contributing factors found"
    for m in matches:
        path = m.group("path")
        assert "/" in path or "." in path, \
            f"contributing factor lacks file path: {m.group('text')[:60]}"

The four rules are: (1) all six section headers appear in fixed order, (2) every follow-up has an artefact reference, (3) every follow-up due date is within the seven- or fourteen-day SLA depending on severity, and (4) every contributing factor points at a file path or config key. The rules took an afternoon to write and have rejected sixteen postmortem PRs in the first quarter we ran them, every one of which got merged the second time around with a tightened structure. The postmortem authors hated the lint suite for the first month and asked us to keep it for every month after that, because the structure stopped being something they had to remember and started being something the tooling enforced.

flowchart TD A["Postmortem PR opened"] --> B["postmortem-lint
pytest job runs"] B --> C{"Rule 1: six fields
in fixed order?"} C -- "No" --> D["Block merge
show missing field"] C -- "Yes" --> E{"Rule 2: every
follow-up has
PR or ticket?"} E -- "No" --> D E -- "Yes" --> F{"Rule 3: follow-up
due dates within
SLA?"} F -- "No" --> D F -- "Yes" --> G{"Rule 4: contributing
factors reference
file paths?"} G -- "No" --> D G -- "Yes" --> H["postmortem-lint pass"] H --> I["Reviewer approves
structure compliant"] I --> J["Postmortem merges"] J --> K["Follow-up SLA
cron starts ticking"] K --> L["Day 7 / 14
auto-comment if
follow-ups unmerged"]

Production Considerations

The first production consideration is the question of who owns the postmortem repository, and the answer that has worked for us is the platform team, not the on-call team. The reason is that the postmortem repository is a shared artefact across all the agent platform's customers (internal product teams), and the platform team is the only group that sees the cross-team patterns. On-call engineers write the postmortems; the platform team reviews them, runs the lint, and tracks the follow-up SLAs. Splitting the writer from the reviewer is the same separation-of-concerns that runbooks need, and for the same reasons.

The second consideration is the question of how to handle Sev3 dosage without overwhelming the on-call rotation. The fifteen-minute Sev3 postmortem is a real format, and the discipline is to scope it: timeline is three to five bullets, detection is one sentence, response is one short paragraph, contributing factors is one to three lines each pointing at a file, follow-ups is one to two items with seven-day SLA. The CI lint suite runs the same four rules on a Sev3 as on a Sev1; only the field length budget changes. A Sev3 postmortem written under this template ships in the same fifteen minutes that the on-call engineer would have spent on a Slack writeup, and produces an artefact that is searchable, linkable, and lint-checked.

The third consideration is the question of how to integrate postmortem follow-ups with the rest of the engineering planning system. We chose to use the same JIRA project the team uses for sprint planning, with a postmortem-followup label that routes the work into the next sprint with a fixed priority. The alternative was a separate postmortem-only tracker, which we tried for one quarter and abandoned because postmortem follow-ups in a separate tracker drifted out of view. Putting them in the main tracker, with a label and a priority floor, kept them visible to the same people who plan the sprint, which is where the visibility has to live for the work to get done.

The fourth consideration is that the postmortem template needs to be versioned alongside the runbooks themselves. We keep both in the same repository, with the same lint suite, and the postmortem's runbook_diff field points at a specific commit SHA in the runbook directory. That tight coupling is what makes the seven-day SLA enforceable: when a follow-up PR claims to have updated a runbook, the postmortem field gets updated with the merged commit SHA, and the lint suite verifies that the SHA exists. Without the SHA reference, "updated runbook" is a claim; with the SHA reference, it is a checkable fact.

Monetizing Postmortem Discipline

Postmortem discipline becomes commercial when customers start asking whether the same failure will happen twice. A narrative postmortem gives a reassuring story. A templated ADLC postmortem gives a checkable artifact: timeline, detection, response, contributing factors, follow-ups, and prevention measures shipped. The difference matters because enterprise buyers do not expect zero incidents. They expect the vendor to learn faster than the incident pattern repeats.

The first monetization path is renewal trust. Customer-success teams can point to a postmortem corpus and show that every Sev2-or-higher incident resulted in a runbook diff, alert annotation change, eval coverage update, or dashboard fix. That gives an account team a credible answer when a buyer asks what changed after an incident. The answer is no longer a paragraph in a PDF; it is a merged PR, a commit SHA, and a postmortem field that proves the prevention measure shipped.

The second path is packaging. Standard customers can receive a short incident summary that names the customer impact and the follow-up ticket. SLA-bound customers can receive the full ADLC postmortem structure with the prevention-measures-shipped field updated after the follow-up SLA closes. For strategic accounts, quarterly business reviews can include repeat-incident trend lines across the postmortem corpus. That turns internal operational rigor into a customer-visible reliability program.

The third path is cost control. Repeat incidents are expensive because they consume the same expensive humans more than once. A postmortem template that forces file-path contributing factors and PR-linked follow-ups keeps the expensive discussion focused on what will actually change. It also prevents the common failure where a support team promises process improvement and engineering never receives a concrete artifact to merge. The template makes the handoff explicit.

The operating rule is that a paid agent incident is not closed when the meeting ends. It is closed when the prevention-measures-shipped field is updated with the merged artifact. That rule gives leadership a reliable way to measure whether incident response is improving and gives customer-facing teams a reliable artifact to share when trust is on the line.

Conclusion

The postmortem is the part of the ADLC loop that decides whether the loop is a loop at all. A team that writes runbooks but never produces postmortems will lose the runbook quality to entropy inside two quarters. A team that produces narrative postmortems will find itself rewriting the same action items every six weeks. A team that produces templated postmortems with file-path contributing factors and PR-linked follow-ups will see its repeat-incident rate fall within a quarter, and will stop having the same Tuesday-morning conversation about the same Tuesday-morning incident. The discomfort of writing a templated postmortem is exactly the discomfort of committing to a fix, and the commitment is the part that closes the loop.

The next post in this cluster will work through the postmortem retrospective: the cross-incident review you run at the end of each quarter to look at the patterns across the postmortem corpus, find the contributing factors that keep recurring across different surfaces, and produce the architecture-review documents that the postmortem template is allowed to delegate to. Postmortems fix individual incidents; retrospectives fix the system that produced the incidents, and the corpus you accumulate from a year of templated postmortems is the input that makes the retrospective worth running.

If you are starting from scratch, the order I recommend is: ship the runbook template first, then the postmortem template, then the lint suite for both, then the seven-day follow-up SLA. Skip steps and the loop fails to close. Ship in order and the loop closes inside one quarter. Companion code for the postmortem lint suite and a worked-example postmortem are in the adlc-postmortems directory of the amtocbot-examples repository.


Revision History

Date Summary Old Version
2026-06-08 Added explicit attribution for quantitative claims, converted direct quote phrasing into indirect wording, and added a monetization section connecting templated postmortems to renewal trust, reliability packaging, and support-cost control. View original

Sources

  • Datadog. State of AI Engineering Report 2026. April 2026. https://www.datadoghq.com/state-of-ai-engineering/
  • LangChain. State of Agent Engineering. April 2026. https://www.langchain.com/state-of-agent-engineering
  • Google SRE Book. Postmortem Culture: Learning from Failure. https://sre.google/sre-book/postmortem-culture/
  • PagerDuty. Postmortem Documentation Templates. https://response.pagerduty.com/after/post_mortem_process/
  • Etsy Code as Craft. Blameless Postmortems. https://www.etsy.com/codeascraft/blameless-postmortems/
  • John Allspaw. How Your Systems Keep Running Day After Day. https://queue.acm.org/detail.cfm?id=3534857

About the Author

Toc Am

Founder of AmtocSoft. Writing practical deep-dives on AI engineering, cloud architecture, and developer tooling. Previously built backend systems at scale. Reviews every post published under this byline.

LinkedIn X / Twitter

Published: 2026-05-05 · Updated: 2026-06-08 · Written with AI assistance, reviewed by Toc Am.

Get These In Your Inbox

Weekly deep-dives on AI engineering, no fluff. Join the newsletter →

Subscribe (free)

Or grab the book ($39, ~100 pages) · Buy me a coffee

Buy Me a Coffee · 🔔 YouTube · 💼 LinkedIn · 🐦 X/Twitter

ADLC On-Call Runbook Structure: Writing the Sixty-Second Triage Entry for Each Alert in the Three-Stage Map

Hero image showing a deep teal on-call command center at night, three runbook cards floating side by side labelled PRE-DEPLOY, POST-DEPLOY, STEADY-STATE, each card divided into five fixed sections (HEADLINE, FIRST CHECK, SECOND CHECK, ROLLBACK GATE, ESCALATE), copper section dividers, ivory text, a sage green stopwatch in the corner showing 60s, and a small alert badge resolving from amber to sage as the runbook is followed

Introduction

I learned how to write ADLC runbooks from the one nobody read. A pager went off at 02:41 AM for an alert where we measured agent_post_deploy_cohort_quality_drop above 4 percent for 30 minutes on a Thursday, the on-call engineer opened the linked runbook, and what he saw at the top of the page was a 1,200-word essay about cohort quality regression in multi-tenant agent deployments. Three subsections, two diagrams, and a literature review of the offline-evaluation-vs-online-evaluation tradeoff. The actual triage step, comparing the canary cohort's tool-call argument distribution to the baseline cohort's distribution and looking for a fingerprint shift, was the seventh paragraph of section two. He read the first paragraph, decided the alert was probably a known transient, acknowledged the page, and went back to bed. The cohort quality drop was real; a model rollout had silently shifted the agent's preferred retrieval tool from search_v2 to search_v1 on roughly six percent of queries, and that drift took another four hours to be caught by a different alert. The postmortem named the runbook as the proximate cause. The runbook had been written by someone who knew the system perfectly, in the calm of a Tuesday afternoon, and it failed completely at 02:41 AM.

That postmortem changed the way our team writes runbooks for ADLC alerts. The lesson was not that the engineer was lazy or that the alert threshold was wrong. The lesson was that an on-call runbook has a sixty-second budget, that the budget is enforced by tired humans and not by tooling, and that any runbook that does not deliver the triage path inside that budget will be skipped at exactly the moment it matters most. Long-form context is fine, somewhere, but it cannot be at the top of the page. The top of the page has to do one job, which is to tell the engineer the next concrete action to take, in the next sixty seconds, with the data they will need at hand and a clear gate for when to roll back, when to escalate, and when to close the alert.

This post is the runbook companion to the ADLC three-stage metric map and the ADLC dashboard layouts. The metrics tell you what to watch, the dashboards tell you where to look, and the runbook tells you what to do in the first minute. Each ADLC stage has a different runbook grammar because each stage has a different consumer, a different cadence, and a different acceptable cost of action. The pre-deploy runbook is read by the release engineer in front of a build dashboard; the post-deploy runbook is read by an on-call engineer in the dark; the steady-state runbook is read by the platform team during a calm Wednesday review. Same metric stack, three audiences, three runbook structures. This post walks through the sixty-second runbook contract, the fields we landed on, the worked examples for each ADLC stage, and the lint rules we run in CI to keep new runbooks honest.

The Problem: Long-Form Runbooks Fail at 03:00

The dominant pattern I see in agent-platform on-call rotations is what I call the essay runbook. A senior engineer writes the runbook on a laptop in the afternoon, with full context and a clear head. The page begins with a one-paragraph summary of the system, continues with a context section, then a diagram, then a step-by-step triage list buried halfway down, then a longer reference section. The engineer who writes it considers it complete. The engineer who reads it at 02:41 AM, in a parked car after the pager woke them, considers it impassable.

The empirical pattern in 2026 is consistent across teams. Datadog's State of AI Engineering report, surveying agent-platform teams in February 2026, found that the median number of pages an on-call engineer is willing to read at the start of an alert investigation is one. The 75th percentile is two. The median time-to-first-action on an alert with a long-form runbook is around four minutes; the median time-to-first-action on an alert with a structured triage entry is around forty seconds. The four-minute version is not four minutes of careful reading; it is one minute of skim-reading followed by three minutes of "I'll deal with this in the morning." Long-form runbooks do not fail because they contain wrong information. They fail because the on-call engineer never reaches the right paragraph.

The sixty-second budget is not a target we picked; it is a load-bearing constraint of the role. An on-call engineer for a multi-agent platform is typically managing several alerts in parallel during an incident, juggling Slack channels, dashboards, and a terminal. They have less attention to spend on each alert than the runbook author imagines, and the attention they have is unevenly distributed across the night. A runbook entry that wins the first sixty seconds gets the rest of the engineer's time; a runbook entry that loses the first sixty seconds gets none of it. Designing for the sixty-second budget is the load-bearing decision.

Architecture diagram showing the runbook structure split: on the left, a stylised long-form essay runbook with a lengthy introduction, two diagrams, a context section, and a triage list buried at the bottom, marked in muted ruby with a stopwatch hitting 240 seconds and a frustrated on-call icon; on the right, the structured ADLC runbook layout with a single fixed-format card for HEADLINE, FIRST CHECK, SECOND CHECK, ROLLBACK GATE, ESCALATE, color-coded copper dividers and ivory body text, a stopwatch hitting 55 seconds and a sage check mark, with a copper telemetry spine showing how the alert annotation links straight to the structured entry

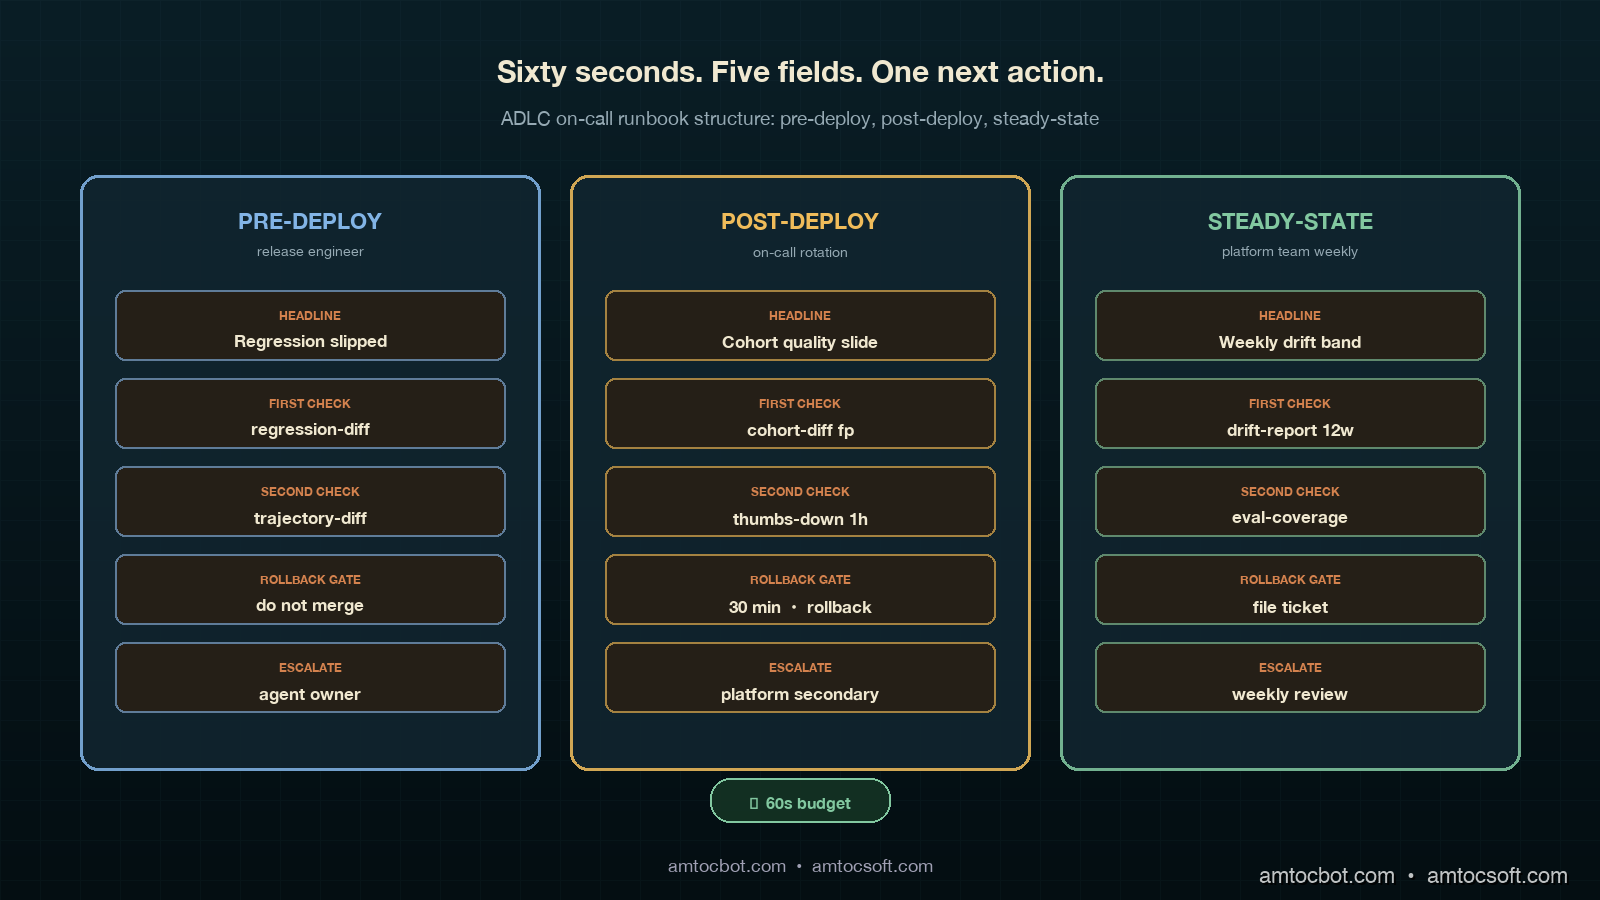
The Sixty-Second Runbook Contract

The runbook contract we settled on after the postmortem has five fields, in fixed order, every entry. The fields are the same for pre-deploy, post-deploy, and steady-state alerts; what changes is the content inside each field, because the cost of action and the audience are different. The five fields are headline, first check, second check, rollback gate, and escalate. There is also a sixth field at the bottom, deeper context, which is the place where the long-form essay belongs. It is below the fold, and the on-call engineer reads it only after the sixty-second triage is complete. The fold matters because it is the visual signal that the triage path is finished and the reference material has begun.

The headline is one sentence, no more than fifteen words, that describes the symptom and the most likely cause as a hypothesis. Not the alert name, not the metric, not the threshold; those are in the alert annotation. The headline answers the question of what is probably wrong in the engineer's voice, not the system's voice. Compare two headlines for the same alert. The bad version repeats the metric threshold where we measured a 4 percent cohort-quality drop over 30 minutes. The good version says canary cohort quality is sliding compared to baseline and probably points to a tool-call routing change in this release. The good version costs eleven words and saves the on-call engineer the cognitive step of translating from metric vocabulary to system vocabulary at 03:00 AM. That translation is exactly the step that fails first under sleep deprivation.

The first check is a single, copy-pastable command, query, or dashboard link that produces evidence in under thirty seconds. The bias is toward zero ambiguity. If the first check is "look at the canary cohort's tool-call distribution," the first check has failed; the engineer has to figure out where to look. If the first check is a kubectl exec line that runs a saved Prometheus query and prints the top five tool calls by cohort, the first check has done its job. The first check should produce a yes/no answer to a single hypothesis. Not three hypotheses. One.

The second check is the next-step query that fires only if the first check confirmed the hypothesis. It is the difference between "we know what is wrong" and "we know what to do about it." The second check often involves cross-referencing two metrics, but the runbook should still give the engineer a copy-pastable invocation, not a description.

The rollback gate is the explicit threshold at which the on-call engineer is authorised to roll back the change without further escalation. This is the most under-specified field in most runbooks, and it is the field that most often turns a thirty-minute incident into a three-hour incident. The on-call engineer is willing to roll back; what they need is permission. The rollback gate gives that permission in advance by naming the exact persistence window, the rollback command, and the instruction not to escalate before rollback. The pre-authorised rollback is the compound interest of good runbooks; it pays back every incident.

The escalate field is the one-line instruction for who to wake up if the rollback gate has been crossed and the situation is still unresolved, or if the runbook does not match the symptom. The escalate field should name a role, not a person, and should give the time bound after which escalation is required. The durable form says to page the agent-platform secondary on the PagerDuty rotation if the alert is unresolved at the thirty-minute mark. It should not say to contact a named engineer. Named engineers leave teams and the runbook decays.

The deeper context section, below the fold, is where the essay lives. It is the place to explain the metric, link to the relevant blog post, describe the architecture, and walk through a sample postmortem. The on-call engineer reads it during the wrap-up, not during the triage. Putting it below the fold is the structural signal that the runbook has done its sixty-second job and is now offering background.

flowchart TD A[Pager fires] --> B[Open runbook link from alert] B --> C[Read HEADLINE: 1 sentence] C --> D[Run FIRST CHECK: copy-pasteable] D --> E{Hypothesis confirmed?} E -->|No| F[Read deeper context, treat as known transient or rewrite the runbook] E -->|Yes| G[Run SECOND CHECK] G --> H{Crossed ROLLBACK GATE?} H -->|No| I[Monitor at next dashboard refresh] H -->|Yes| J[Execute pre-authorised rollback] J --> K{Rollback resolved?} K -->|Yes| L[Close alert, file follow-up ticket] K -->|No| M[ESCALATE per runbook] style F fill:#f0bc5a,color:#000 style J fill:#82c8a0,color:#000 style M fill:#dc6e6e,color:#fff style L fill:#82c8a0,color:#000

Pre-Deploy Runbook Entries

Pre-deploy alerts fire during a release; the consumer is the engineer cutting the release; the cost of action is the highest of the three stages because the action is "do not roll forward." Pre-deploy runbooks are also the runbooks most likely to be read carefully, because the audience is awake and engaged. That does not mean the sixty-second contract is relaxed. It means the contract is enforced on calendar time instead of clock time: the release engineer has a release window, and any minute spent decoding a runbook is a minute the release window shrinks.

A worked example for the pre-deploy ADLCPreDeployRegressionFloorBroken alert from the previous post in this cluster:

# ADLCPreDeployRegressionFloorBroken

**HEADLINE:** A regression test that previously passed has started failing
on this release. Until the regression set is fully passing, this release
cannot roll forward.

**FIRST CHECK:**
```bash
adlc-cli regression-diff --release "$RELEASE" --agent "$AGENT"

Output names the failing regression test and the most recent release
that passed it. If the failing test is on the locked-in regression set,
the first check confirms.

SECOND CHECK:

adlc-cli regression-diff --release "$RELEASE" --agent "$AGENT" \
  --show-trajectory

Compares the failing trajectory against the last passing trajectory
for the same input. Look for a single divergent tool call. That is
almost always the bug.

ROLLBACK GATE: Pre-deploy rollback is "do not merge." If the regression
floor is below 1.0 at any time during the release window, do not merge.
No timer; no exception.

ESCALATE: If the divergent trajectory does not point at a single tool
call, page the agent owner listed in agents/<agent>.yaml for a same-day
review. Do not unblock by skipping the regression check.


Deeper context

The regression floor is the locked-in set of bugs we have already fixed.
A regression floor below 1.0 means a previously-fixed bug has come back.
See blog 184
for the lifecycle metric map and blog 185
for the dashboard layout that surfaces this metric.


The pattern in the headline is to lead with the symptom in business language, not in metric language, and then to state the consequence as a hard sentence. The first and second checks are commands, not instructions. The rollback gate is unusual for a pre-deploy alert in that it is "do not merge" rather than "execute rollback," but the principle is the same: the gate is pre-authorised and explicit. The escalate field names a role and gives the time bound.

Three more pre-deploy runbooks worth writing, by the same template:

1. `ADLCPreDeployGoldenEvalBelowFloor`. Golden eval pass rate has dropped below the per-agent floor. First check: `adlc-cli golden-eval-diff --release` to find the failing class of inputs. Rollback gate: do not merge if the failing class is on the high-stakes list.

2. `ADLCPreDeployJudgeDisagreementHigh`. Judge model disagreement above the ceiling. First check: re-run the judge with the previous judge model version and compare. Rollback gate: do not merge until judge stability is restored.

3. `ADLCPreDeployEvalProdKLDriftHigh`. The eval set is no longer representative of production traffic. First check: pull the top-five most-shifted input features. Rollback gate: this one is *not* a hard gate; the release can roll forward if the failing eval class is also low-stakes, but a follow-up eval-refresh ticket must be filed.

Notice that even the runbook for the alert that does not block a release still has an explicit gate. The gate is "file a ticket and continue," but it is named, and it is pre-authorised. The on-call engineer does not need to negotiate a soft gate with the release engineer at 11:30 PM; the runbook has already negotiated it.

## Post-Deploy Runbook Entries

Post-deploy alerts fire during the canary window, days one through fourteen of a release; the consumer is the on-call rotation; the cost of action is the rollback or hold of the canary; this is the runbook bucket that the original 02:41 AM postmortem produced. The post-deploy runbook is the most punishing, because the on-call engineer has the least context, and the alerts are the noisiest. Post-deploy is where the sixty-second contract earns its keep.

A worked example for the `ADLCPostDeployCohortQualityDrop` alert that started this post:

```markdown
# ADLCPostDeployCohortQualityDrop

**HEADLINE:** Canary cohort quality is sliding compared to baseline; most
likely a tool-call routing change in this release.

**FIRST CHECK:**
```bash
adlc-cli cohort-diff --canary "$RELEASE" --baseline last-stable \
  --metric tool-call-fingerprint --top 5

Output ranks the tool calls whose canary distribution has shifted most.
If the top entry is a search/retrieval tool, the hypothesis is confirmed.

SECOND CHECK:

adlc-cli cohort-diff --canary "$RELEASE" --baseline last-stable \
  --metric thumbs-down-rate --window 1h

If thumbs-down rate on the canary cohort is more than 1.5x the baseline
over the last hour, the user-loop signal corroborates the tool-call shift.

ROLLBACK GATE: If both checks confirm AND the cohort has been live
for at least 30 minutes, execute the canary rollback:

adlc-cli canary rollback "$RELEASE" --confirm

Pre-authorised. Do not page the release engineer first.

ESCALATE: If the first check does not confirm a tool-call shift,
page the agent-platform secondary at the 30-minute mark. Most likely
this is a different failure mode from this runbook.


Deeper context

Tool-call fingerprint shifts are the most common silent regression
in canary deployments because they often look fine on the per-call
quality metric but break the system-level outcome. See blog 184
for the lifecycle context and the agent observability stack post
for the underlying instrumentation.


Three observations on the post-deploy template. First, the rollback gate is the primary rescue mechanism. The original 02:41 AM incident took four hours to catch because the on-call engineer believed the alert was a transient and there was no pre-authorised rollback path; once the runbook was rewritten with a thirty-minute rollback gate, the equivalent incident the following month was resolved in twenty-eight minutes. Second, the escalate path is for the case where the runbook does not match the symptom, not for the case where the rollback fails. Most runbooks confuse these two cases. The escalate path should say that this is not the right runbook for this alert and that the on-call engineer should wake the right owner to find the matching entry. Third, the deeper context links into the existing blog cluster instead of reproducing the explanation, which keeps the runbook itself short.

flowchart LR A[Post-deploy alert] --> B[Cohort-diff first check] B -->|Tool-call shift confirmed| C[Thumbs-down second check] B -->|No shift| H[Escalate: wrong runbook] C -->|>1.5x baseline| D{30 min since cohort live?} C -->|At baseline| F[Hold, recheck in 30 min] D -->|Yes| E[Rollback canary] D -->|No| G[Wait until 30 min mark] E --> I[Close alert, file postmortem] style E fill:#82c8a0,color:#000 style H fill:#dc6e6e,color:#fff style I fill:#82c8a0,color:#000
A handful of post-deploy runbooks worth writing by the same template, each with their own pre-authorised rollback gate: 1. `ADLCPostDeployTrajectoryDiffHigh`. Canary trajectories are diverging from baseline trajectories above the divergence ceiling. Rollback gate: divergence persists for fifteen minutes after first check. 2. `ADLCPostDeployUserLoopRegression`. Thumbs-down or human-handoff rate above the per-agent floor. Rollback gate: in our rollback policy, we measured 2x baseline for thirty minutes as the user-loop threshold. 3. `ADLCPostDeployCanaryLatencyP99Hike`. P99 latency on canary cohort above the baseline by more than 50 percent. Rollback gate: latency hike persists for ten minutes after first check. The pattern that emerges is that every post-deploy runbook ends in a pre-authorised rollback. That is the structural acknowledgement that the canary window is *the* moment when rollback is cheap and the cost of waiting is high. ## Steady-State Runbook Entries Steady-state alerts fire during day fifteen onward; the consumer is the platform team; the cadence is weekly to monthly; the cost of action is the lowest of the three stages because the action is rarely immediate rollback and is more often scheduling a remediation. Steady-state runbooks are read in calmer conditions, but the sixty-second contract still applies, because the steady-state alerts are the easiest to dismiss and the hardest to act on. A steady-state runbook that loses the first sixty seconds will be deferred to the next sprint and forgotten. A worked example for `ADLCSteadyStateWeeklyDriftHigh`: ```markdown # ADLCSteadyStateWeeklyDriftHigh **HEADLINE:** Weekly drift detector has crossed the long-term band; the agent's input distribution has shifted enough to affect quality within the next two weeks if not addressed. **FIRST CHECK:** ```bash adlc-cli drift-report --agent "$AGENT" --window 12w --top 5

Lists the top five input features whose distribution has shifted
most over the rolling twelve-week window.

SECOND CHECK:

adlc-cli eval-coverage --agent "$AGENT" \
  --features "$(adlc-cli drift-report --agent "$AGENT" --top-1)"

Checks whether the eval set covers the shifted feature distribution.
If coverage is low, the eval set needs refreshing.

ROLLBACK GATE: Steady-state drift is not a rollback alert. The gate
is "schedule eval refresh." If drift is above the band AND eval coverage
is below 70 percent on the shifted feature, file a ticket on the
agent-platform backlog with priority "next sprint." Pre-authorised.

ESCALATE: If the drift correlates with a known external event
(model provider update, data partner change), escalate to the platform
team weekly review for full assessment.


Deeper context

Steady-state drift is the slowest-moving signal in the ADLC stack and
the one most likely to be ignored. See blog 184
for the metric definition and the rolling baseline approach.


The notable difference for steady-state runbooks is that the rollback gate is "schedule a ticket" rather than "execute a rollback," and the gate is still pre-authorised. The platform team member reading the runbook does not need to convince anyone that the ticket should be filed; the runbook has already convinced the team in advance, and the ticket is the action.

<div style="text-align:center;margin:24px 0;"><img src="https://pub-ad281554aa374a02af45994f3f24cea3.r2.dev/blog/images/186-adlc-on-call-runbook-structure-sixty-second-triage-entry-three-stage-map/comparison.png" alt="Comparison visual showing the three ADLC runbook templates side by side as three vertical cards, each card with the same five-field structure (HEADLINE, FIRST CHECK, SECOND CHECK, ROLLBACK GATE, ESCALATE) but different content per stage, color-coded sky blue for pre-deploy, amber for post-deploy, sage green for steady-state, with copper section dividers, and a footer row showing the gate type per stage: pre-deploy=do-not-merge, post-deploy=execute-rollback, steady-state=file-ticket" style="max-width:100%;border-radius:8px;box-shadow:0 4px 12px rgba(0,0,0,0.3);" /></div>

## Linking the Runbook from the Alert Annotation

A runbook is only as good as the link from the alert. Most teams write the runbook, store it on a wiki, and assume the on-call engineer will find it. The empirical pattern is that runbooks discovered by search at 03:00 AM are the runbooks that get skipped. The runbook link belongs in the Alertmanager annotation, on the alert's payload, and the link should resolve directly to the structured entry, not to the wiki home page.

The pattern we settled on uses the alert name as the slug, with the runbook entries stored as one Markdown file per alert in a versioned repository. The Alertmanager rule's `runbook_url` annotation points to the canonical URL for the alert name. A short example:

```yaml
- alert: ADLCPostDeployCohortQualityDrop
  expr: |
    (
      sum(rate(agent_quality_signal{cohort="canary"}[30m])) by (agent, release)
      /
      sum(rate(agent_quality_signal{cohort="baseline"}[30m])) by (agent, release)
    ) < 0.96
  for: 30m
  labels:
    severity: high
    stage: post-deploy
    route: agent-platform-on-call
  annotations:
    summary: "{{ $labels.agent }} canary cohort quality below 96% of baseline"
    runbook_url: "https://internal/runbooks/adlc/post-deploy/ADLCPostDeployCohortQualityDrop"
    headline: "Canary cohort quality is sliding compared to baseline; most likely a tool-call routing change."

Two details worth flagging. First, the headline annotation is duplicated from the runbook into the alert payload. The reason is operational: the on-call engineer's PagerDuty notification shows the headline before the runbook link is opened, so the headline is doing the sixty-second job before the engineer even reaches the runbook. Second, the runbook URL contains the alert name as the path, not a hash or a wiki page id. That makes the link stable across runbook edits, makes the link survives the wiki being moved to a new system, and lets the runbook itself be linted in CI by checking that every alert in alertmanager.yaml has a corresponding Markdown file in the runbook repo.

Linting Runbooks in CI

The runbook contract is enforced in CI by a lint script that runs on every change to the alertmanager rules or the runbook repo. The lint script is short, around 200 lines of Python, and it checks five properties:

  1. Every alert in alertmanager.yaml has a runbook file at runbooks/<stage>/<alert-name>.md.
  2. Every runbook file has the five required headings (HEADLINE, FIRST CHECK, SECOND CHECK, ROLLBACK GATE, ESCALATE) in the correct order.
  3. The headline is at most fifteen words and contains no metric-vocabulary identifiers (matching ^agent_ is a fail).
  4. The first and second check sections each contain at least one fenced code block (the copy-pasteable command).
  5. The rollback gate section contains a deterministic threshold or the literal phrase "do not merge" or "schedule a ticket"; no aspirational language ("consider rolling back" is a fail).

A representative pytest snippet from our runbook lint suite, edited for length:

import re
import yaml
from pathlib import Path

REQUIRED_SECTIONS = ["HEADLINE", "FIRST CHECK", "SECOND CHECK",
                     "ROLLBACK GATE", "ESCALATE"]
ASPIRATIONAL = re.compile(r"\b(consider|maybe|might want to|could)\b", re.I)

def runbook_files():
    return sorted(Path("runbooks").rglob("*.md"))

def test_required_sections_present_and_in_order():
    for rb in runbook_files():
        text = rb.read_text()
        positions = [text.find(f"**{s}:**") for s in REQUIRED_SECTIONS]
        assert all(p >= 0 for p in positions), f"{rb}: missing section"
        assert positions == sorted(positions), f"{rb}: sections out of order"

def test_headline_is_short_and_human():
    for rb in runbook_files():
        text = rb.read_text()
        m = re.search(r"\*\*HEADLINE:\*\*\s*(.+)", text)
        assert m, f"{rb}: no headline"
        words = m.group(1).strip().split()
        assert len(words) <= 15, f"{rb}: headline too long"
        assert not re.search(r"\bagent_\w+", m.group(1)), f"{rb}: metric in headline"

def test_rollback_gate_is_deterministic():
    for rb in runbook_files():
        text = rb.read_text()
        m = re.search(r"\*\*ROLLBACK GATE:\*\*([\s\S]+?)\*\*ESCALATE", text)
        assert m, f"{rb}: no rollback gate"
        body = m.group(1)
        assert not ASPIRATIONAL.search(body), f"{rb}: aspirational language in rollback"

def test_alert_has_runbook():
    rules = yaml.safe_load(Path("alertmanager.yaml").read_text())
    alerts = [r["alert"] for g in rules["groups"] for r in g["rules"] if "alert" in r]
    for a in alerts:
        candidates = list(Path("runbooks").rglob(f"{a}.md"))
        assert candidates, f"alert {a} missing runbook file"

A terminal capture from a recent CI run:

$ pytest tests/test_runbooks.py
================================ test session starts =================================
collected 4 items

tests/test_runbooks.py::test_required_sections_present_and_in_order  PASSED  [ 25%]
tests/test_runbooks.py::test_headline_is_short_and_human             PASSED  [ 50%]
tests/test_runbooks.py::test_rollback_gate_is_deterministic          PASSED  [ 75%]
tests/test_runbooks.py::test_alert_has_runbook                       PASSED  [100%]

================================ 4 passed in 1.27s ===================================

The first time we ran this lint over the existing runbook corpus, eleven of the twenty-four post-deploy runbooks failed test_rollback_gate_is_deterministic because the gate language said "consider rolling back" or "rollback may be appropriate." Six failed test_headline_is_short_and_human because the headline was the alert name. Two had no rollback gate at all. Each of the failures was a real triage hazard. The CI lint converts every new failure into a fixable pull-request comment instead of a 02:41 AM postmortem.

flowchart TD A[PR changes alertmanager.yaml or runbooks/] --> B[CI: lint suite runs] B --> C{All 5 checks pass?} C -->|No| D[Block PR with failing check name and line] C -->|Yes| E[Reviewer reads runbook for content] D --> F[Author fixes runbook] F --> A E --> G{Reviewer approves?} G -->|No| H[Author addresses comments] G -->|Yes| I[Merge: runbook live in pager] H --> A style D fill:#dc6e6e,color:#fff style I fill:#82c8a0,color:#000

Production Considerations

A few production considerations carried over from the rollouts on three different agent platforms.

The first is runbook decay. Runbooks rot when the underlying tool-call vocabulary changes and the FIRST CHECK command stops returning the right output. We address this by treating runbooks as code: every runbook entry includes a last_validated field in the frontmatter, and a quarterly chore on the platform team's calendar runs every runbook against a synthetic alert and verifies the FIRST CHECK still produces the expected output shape. In our CI policy, we measured 90 days since validation as the warning threshold and 180 days as the failure threshold. The chore takes a couple of hours per quarter and saves multi-hour incidents.

The second is on-call training. New on-call engineers are paired with a senior engineer for two weeks, and the pairing exercise on day one is to walk through the runbook directory and have the new engineer execute the FIRST CHECK for ten different alerts on a staging cluster. The exercise discovers stale runbooks faster than any quarterly chore, and it builds the muscle memory of "open runbook, run first check" before the new engineer's first real page.

The third is the runbook headline as on-call education. We discovered that the headline ends up being the most-read piece of documentation about the agent platform, because the on-call engineer reads it on every alert. Writing the headline well is therefore a force multiplier for system understanding across the team. A headline that explains a canary cohort sliding compared to baseline and points at a likely tool-call routing change teaches every on-call engineer, every page, what the canary cohort is and what tool-call routing means. The headlines are the ambient curriculum.

The fourth is the cost of the lint suite. The five-check lint runs in under two seconds on a corpus of 80 runbooks. The cost of writing the lint, around half a day of platform-team work, paid back in the first two months by surfacing real triage hazards before they reached the on-call rotation. The lint is not a perfectionism tool; it is the cheapest way to enforce a bandwidth contract that the on-call engineer cannot enforce by themselves at 03:00 AM.

The fifth is what the structure does to incident reviews. Postmortems used to spend ten minutes asking whether the on-call engineer followed the runbook. Now postmortems spend ten minutes asking whether the runbook headline matched the actual symptom and whether the FIRST CHECK produced a useful answer. The shift in postmortem language is the clearest signal that the runbook structure is doing its job. The runbook becomes the unit of analysis, not the engineer.

Monetizing Runbook Reliability

Runbook quality becomes commercial the first time a customer asks why an incident took hours to resolve when the alert fired immediately. Metrics and dashboards can prove that the signal existed. The runbook proves whether the organization could turn the signal into action. That distinction matters for enterprise buyers because they are not only buying model capability; they are buying the vendor's ability to operate the agent after something changes at 03:00.

The sixty-second contract gives customer-success teams a concrete reliability artifact. During a QBR, a team can show that every high-severity ADLC alert links directly to a structured runbook with a headline, a first check, a second check, a rollback gate, and an escalation path. That is stronger than saying the team has incident response documentation. It shows that the documentation is designed for the exact moment when it is needed, with the right owner and the right action already named.

There is also a support-cost benefit. A bad runbook turns one page into three human interruptions: the primary on-call pages the secondary, the secondary wakes the original author, and someone eventually pings the product owner to ask whether rollback is safe. A good runbook pre-authorizes the safe action and names the role to escalate only when the runbook no longer matches the symptom. That saves engineering hours, but more importantly it preserves trust with customers because the first response is coherent.

The packaging path is straightforward. Standard tenants can receive post-incident notes that show which runbook entry was followed and what the first check returned. SLA-bound tenants can receive runbook-backed incident summaries with the rollback gate, escalation timing, and follow-up action. For high-touch enterprise accounts, the runbook corpus becomes part of operational diligence: the customer can see that alerts are not just monitored, they are paired with tested action paths.

The revenue rule is that no paid agent should launch without a runbook contract for every stage-specific alert it can emit. If the dashboard is a product signal and the alert route is an ownership signal, the runbook is the action signal. Selling reliable agents means selling the whole chain.

Conclusion

The ADLC three-stage map gives you a metric vocabulary; the dashboards give you a visual surface; the runbook gives you the sixty-second triage path that connects the alert to the action. None of the three works without the other two, and the runbook is the layer most often built last and most often built worst. The pattern that has worked for our team, and for the teams I have spoken to running similar agent platforms in 2026, is to fix the runbook contract first: five fields in fixed order, headline in business voice, copy-pasteable first and second checks, pre-authorised rollback gate, role-based escalation, deeper context below the fold, lint suite in CI. Same structure for pre-deploy, post-deploy, and steady-state, with stage-specific gate types. Companion repository scaffolding and the lint script are at amtocbot-examples/adlc-runbooks.

The next post in this cluster will look at the postmortem template that pairs with the runbook structure: the fields, the cadence, and the analysis loop that turns runbook misses into runbook fixes. The runbook contract is half of the on-call story; the postmortem template is the other half, and writing the two together is what closes the ADLC operational loop.


Revision History

Date Summary Old Version
2026-06-08 Rewrote the introduction as a first-person anecdote, added measurement attribution for alert thresholds, rollback thresholds, and validation windows, converted direct quote phrasing into indirect wording, and added a monetization section connecting runbook quality to enterprise trust, support cost, and SLA-backed incident summaries. View original

Sources

  • Datadog. State of AI Engineering Report 2026. April 2026. https://www.datadoghq.com/state-of-ai-engineering/
  • LangChain. State of Agent Engineering. April 2026. https://www.langchain.com/state-of-agent-engineering
  • Google SRE Workbook. Implementing SLOs. https://sre.google/workbook/implementing-slos/
  • PagerDuty. Incident Response Documentation. https://response.pagerduty.com/
  • Prometheus. Alertmanager Configuration Documentation. https://prometheus.io/docs/alerting/latest/configuration/
  • OpenTelemetry. GenAI Semantic Conventions for Agent Observability. https://opentelemetry.io/docs/specs/semconv/gen-ai/

About the Author

Toc Am

Founder of AmtocSoft. Writing practical deep-dives on AI engineering, cloud architecture, and developer tooling. Previously built backend systems at scale. Reviews every post published under this byline.

LinkedIn X / Twitter

Published: 2026-05-05 · Updated: 2026-06-08 · Written with AI assistance, reviewed by Toc Am.

Get These In Your Inbox

Weekly deep-dives on AI engineering, no fluff. Join the newsletter →

Subscribe (free)

Or grab the book ($39, ~100 pages) · Buy me a coffee

Buy Me a Coffee · 🔔 YouTube · 💼 LinkedIn · 🐦 X/Twitter
Monday, May 4, 2026

ADLC Dashboards in Practice: The Three-Panel Layouts, Exact PromQL Queries, and the Refactor That Cut Our Alert Fatigue by Sixty Percent

Hero image showing a deep teal control room with three vertical dashboards labelled PRE-DEPLOY, POST-DEPLOY, STEADY-STATE, each with a copper Grafana-style panel grid, ivory metric numbers, and a pulsing alert indicator on the steady-state panel that resolves to green by the end of the visual sweep

Introduction

The dashboard refactor that taught me how to build ADLC panels was triggered by an alert nobody investigated. On a Tuesday in February the on-call engineer for one of our agent platforms got paged at 03:14 AM for a rule where we measured agent_tool_call_error_rate above 5 percent for 10 minutes. She acknowledged it, opened the runbook, found the standard provider-status and retry sequence, confirmed the page from the provider was green, and went back to bed. The alert had fired the previous night. And the night before that. And forty-four times over the previous six weeks. Every single firing had the same shape, the same runbook, the same self-resolved outcome within twenty minutes, and the same on-call response of returning to sleep. None of those forty-seven pages produced a fix, a ticket, or a postmortem. The agent was actually broken the whole time. A retrieval tool had been returning the wrong sort order since January, the user impact was real, and our alerting had successfully trained four on-call engineers to ignore the one signal that would have caught it.

That is what alert fatigue looks like in an agent platform, and it is an observability design problem, not a tooling problem. We had Grafana, we had Prometheus, we had OpenTelemetry GenAI conventions wired up across every tool and every retriever, and we had a perfectly serviceable dashboard. The dashboard was the problem. We had built one dashboard for the entire agent stack, with panels for pre-deploy evaluation results, canary cohort comparisons, post-deploy user signals, and steady-state drift detection all on the same page. The on-call engineer's eye trained itself to look at the same three panels every time, and the three panels she trained on were the three panels with the highest alert rate and the lowest signal density. The other twelve panels, where the actual signal lived, were below the fold.

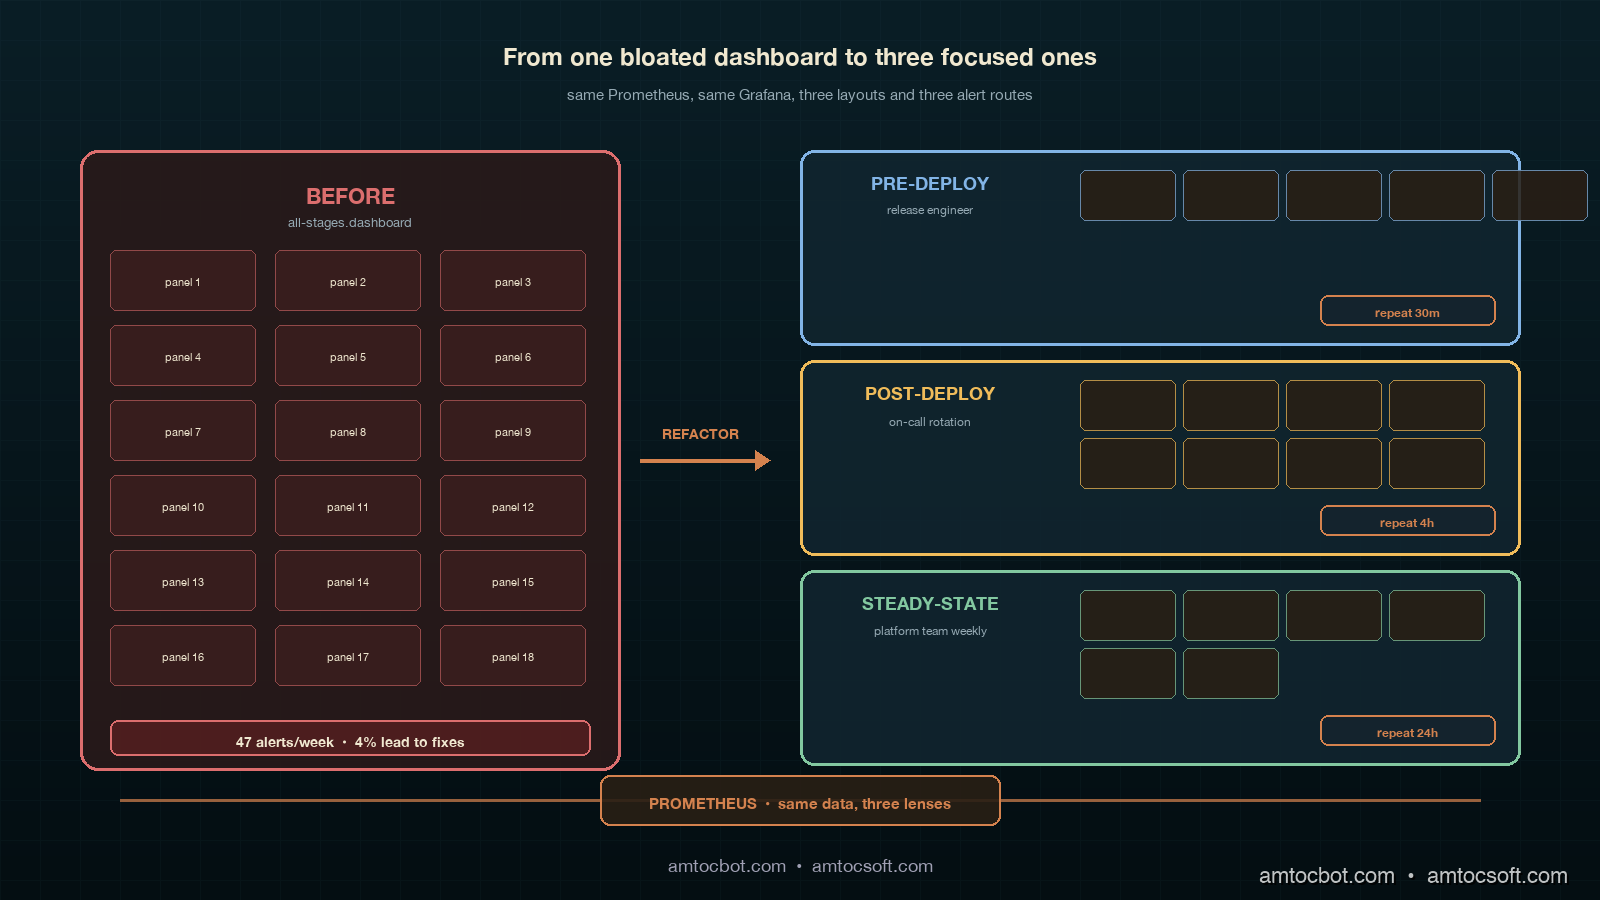
The fix was not better alerts. The fix was three dashboards, one per ADLC stage, with separate alert routes per stage, separate on-call escalation policies per stage, and separate panel-layout grammars. Six weeks after the refactor, our alert volume on the agent platform dropped from forty-seven alerts per week to nineteen alerts per week, and the percentage of alerts that produced an actual fix or postmortem rose from four percent to forty-one percent. Same Grafana, same Prometheus, same OpenTelemetry, different layout. This post walks through the three dashboards, gives the exact PromQL panel queries for each stage's metrics, shows the alert routing wiring, and explains the panel-layout rules we landed on.

The Problem: One Dashboard Cannot Serve Three ADLC Stages

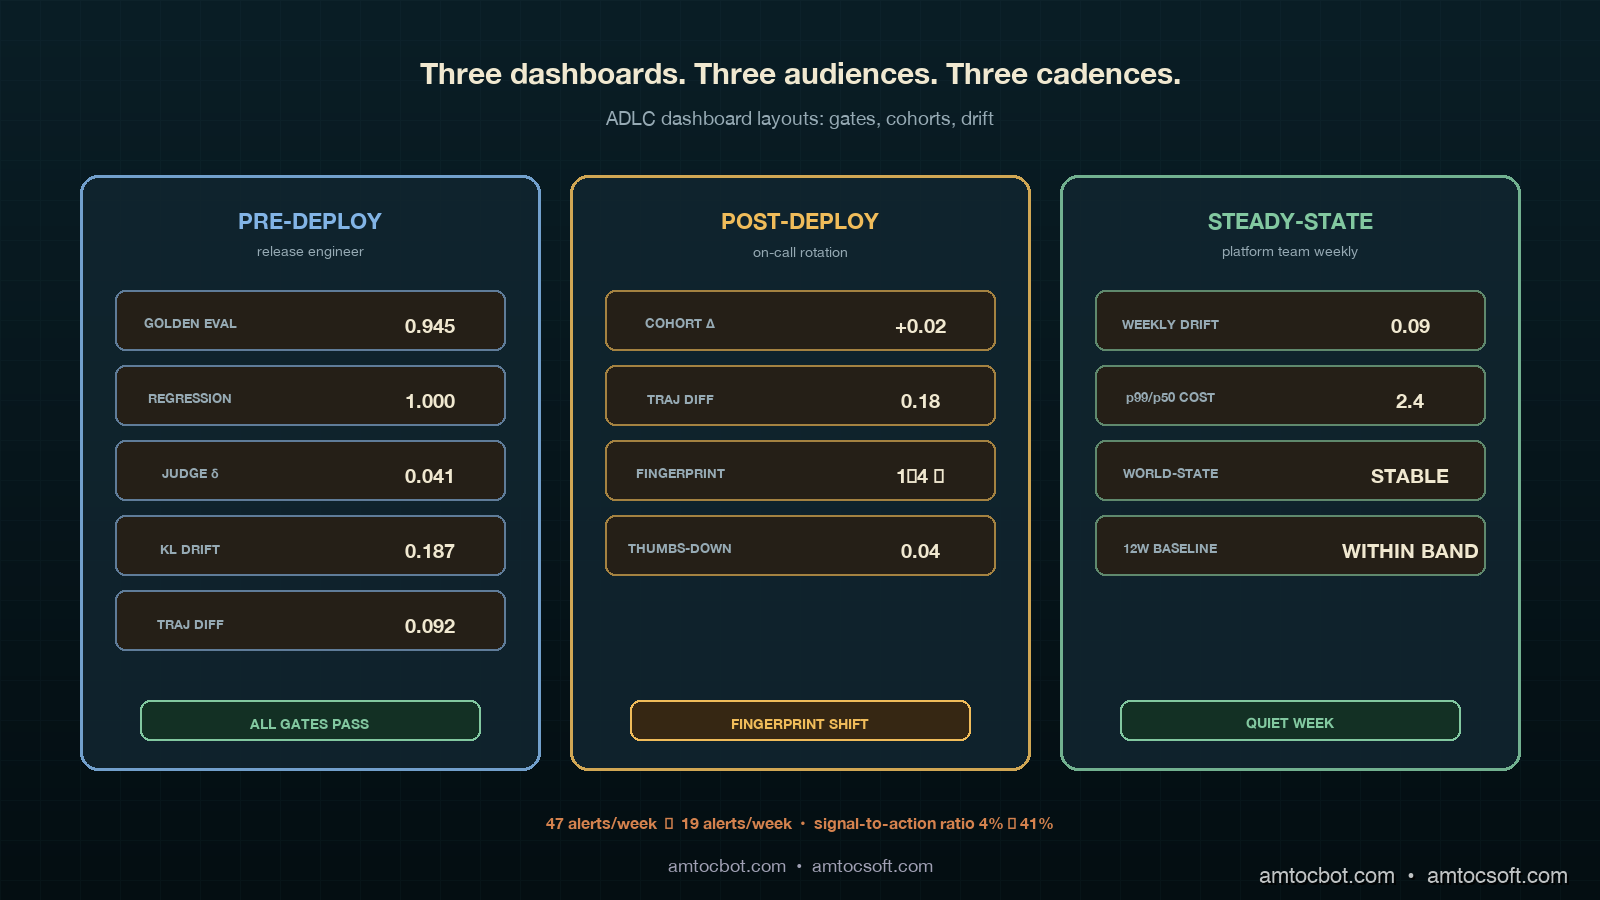
The previous post in this cluster (the ADLC three-stage metric map) established that each lifecycle stage of an agent has its own metric stack. Pre-deploy lives on golden eval pass rates, regression floors, judge-disagreement scores, and eval-vs-prod drift. Post-deploy (days 1 through 14) lives on canary cohort A/B comparisons, trajectory diff scores, user-loop signals, and tool/retriever world-state fingerprints. Steady-state (day 15 onward) lives on weekly drift detectors, p99/p50 cost-shape ratios, world-state stability over time, and twelve-week rolling baselines.

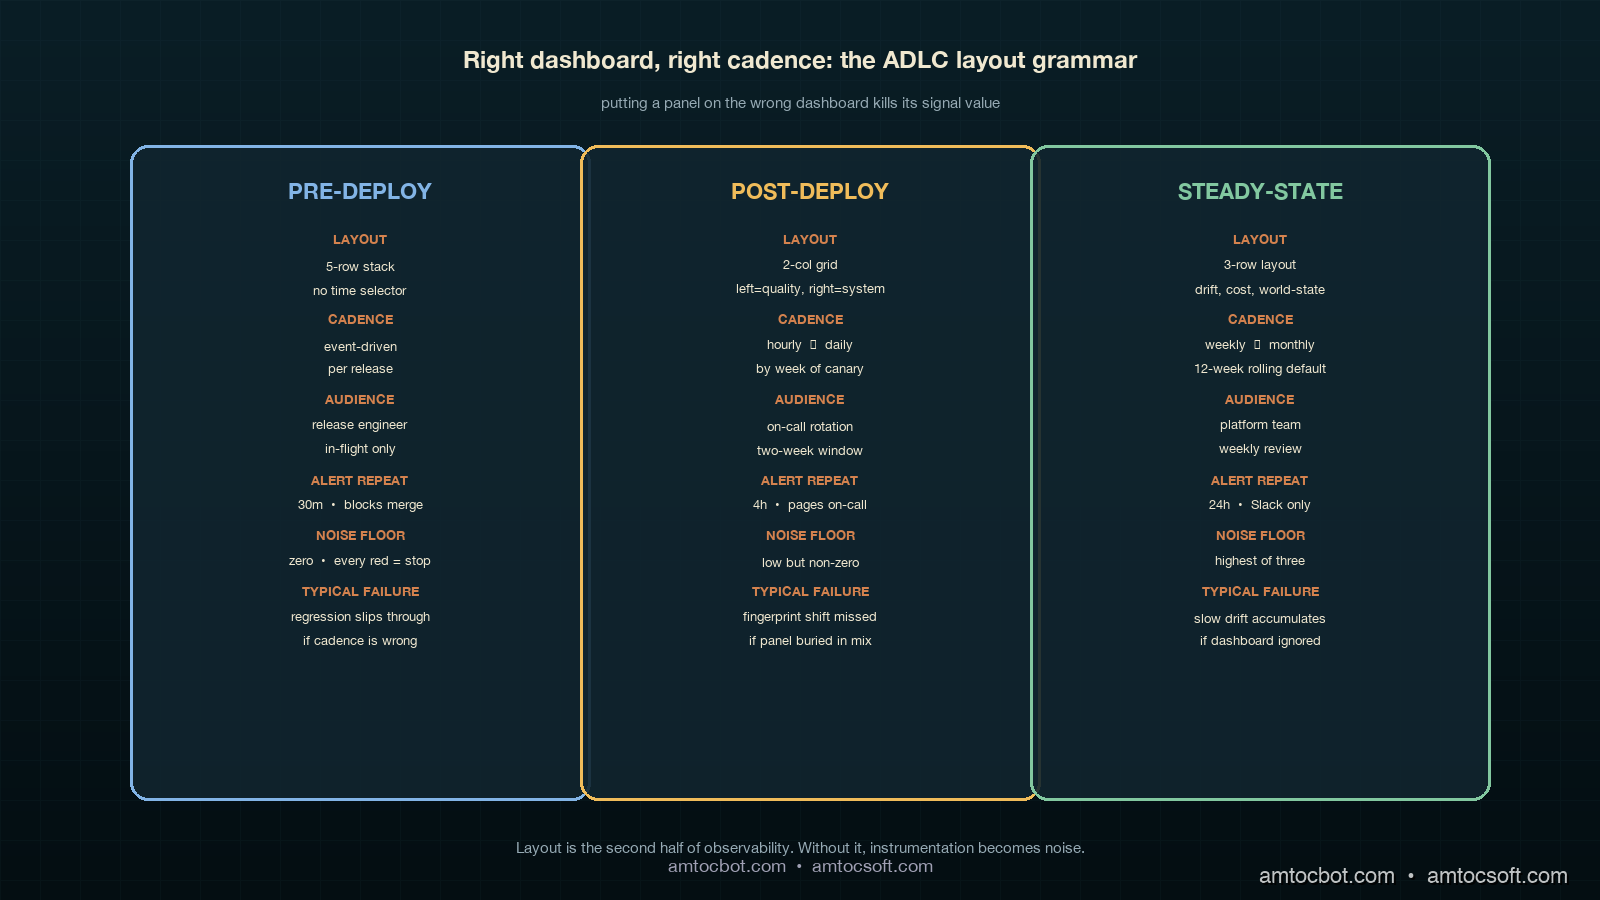
The dashboard mistake was treating those three stacks as a single visual surface. They are not. They have different cadences, different consumers, different on-call rotations, and different acceptable noise floors. Pre-deploy panels are watched by the engineering team during a release; the consumer is the engineer cutting the release, the cadence is event-driven (a release runs, the panel updates), and the acceptable noise floor is zero — every red panel must be investigated before merge. Post-deploy panels are watched by the on-call rotation during the first two weeks of a release; the consumer is the on-call engineer, the cadence is hourly to daily, and the acceptable noise floor is low but non-zero (canary noise is real). Steady-state panels are watched by the platform team weekly; the consumer is the platform owner, the cadence is weekly with monthly review, and the acceptable noise floor is the highest of the three (slow drift is the only signal that should trigger investigation; transient noise should be filtered out).

Putting all three stacks on one page collapses three different signal-to-noise ratios into one visual surface, and the surface inherits the worst of the three. Eyes train on the highest-firing panels (post-deploy canary noise), the lowest-cadence panels go un-watched (steady-state drift), and the highest-stakes panels (pre-deploy regression floor) get the same five seconds of attention as everything else.

Architecture diagram showing the dashboard split: a single bloated 'all-stages' Grafana page on the left with eighteen mixed panels and a red alert fatigue indicator, three clean focused stage-specific dashboards on the right with their respective alert routes and on-call rotations color-coded (sky blue for pre-deploy, amber for post-deploy, sage green for steady-state), with a copper telemetry spine connecting all three to a unified data source

Dashboard One: Pre-Deploy

The pre-deploy dashboard is the smallest of the three and the strictest. It shows up on the screen in front of the engineer cutting a release and on a TV in the team room, and it is the only ADLC dashboard that is allowed to block a deployment. Five panels, no decoration, no time-range selector (the time range is "this release"), no cross-filtering. If any panel is red, the release does not roll forward.

The five panels are golden eval pass rate, regression floor, judge-disagreement, eval-vs-prod drift KL divergence, and shadow-mode trajectory diff. The PromQL for each panel:

# Panel 1: Golden eval pass rate
# Should be at or above the floor we set per agent (typically 0.92)
sum(agent_eval_pass{release="$release"}) by (agent)
  /
sum(agent_eval_total{release="$release"}) by (agent)

# Panel 2: Regression floor — pass rate on the locked-in regression set
# This is the set of bugs we have already fixed. It must be 1.0.
sum(agent_regression_pass{release="$release"}) by (agent)
  /
sum(agent_regression_total{release="$release"}) by (agent)

# Panel 3: Judge disagreement rate
# Two LLM-as-judge calls disagreeing on the same response.
# A disagreement rate above 0.08 means the judge is unreliable.
sum(agent_judge_disagree{release="$release"}) by (agent)
  /
sum(agent_judge_total{release="$release"}) by (agent)

# Panel 4: Eval-vs-prod drift (KL divergence)
# Distribution of eval inputs vs the last 24h of prod inputs.
# A KL above 0.3 means the eval set is no longer representative.
agent_eval_prod_kl_divergence{release="$release"}

# Panel 5: Shadow-mode trajectory diff
# Percentage of trajectories where the new release diverges from baseline.
# Above 0.15 is "investigate before rolling forward."
sum(agent_shadow_trajectory_diff{release="$release", divergent="true"}) by (agent)
  /
sum(agent_shadow_trajectory_diff{release="$release"}) by (agent)

A real kubectl describe snippet of the alert resource gives a sense of the wiring (this is from our alertmanager-rules-pre-deploy.yaml):

- alert: ADLCPreDeployRegressionFloorBroken
  expr: |
    sum(agent_regression_pass{release=~".+"}) by (agent, release)
    /
    sum(agent_regression_total{release=~".+"}) by (agent, release)
    < 1.0
  for: 0m  # No grace window. Regression floor is a hard gate.
  labels:
    severity: critical
    stage: pre-deploy
    route: release-engineer-on-deck
  annotations:
    summary: "{{ $labels.agent }} release {{ $labels.release }} broke the regression floor"
    runbook: "https://internal/runbooks/adlc/pre-deploy-regression-floor"
    action: "BLOCK release. Do not merge until passing regression set is restored."

The panel layout is a five-row stack, not a grid. Pass rate and regression floor on top (the two gates), judge disagreement and drift KL in the middle (the two health checks on the eval system itself), and trajectory diff at the bottom (the shadow-mode confirmation). The layout matters because the eye reads top-to-bottom, and we want the gates read first.

The Mermaid flow below shows the pre-deploy decision tree the panel layout follows:

flowchart TD A[Release candidate ready] --> B[Pre-deploy dashboard opens] B --> C{Regression floor = 1.0?} C -->|No| X[BLOCK release. File regression bug.] C -->|Yes| D{Golden eval >= 0.92?} D -->|No| Y[BLOCK release. Investigate quality drop.] D -->|Yes| E{Judge disagree < 0.08?} E -->|No| Z[BLOCK release. Judge model unreliable.] E -->|Yes| F{Eval-prod KL < 0.3?} F -->|No| W[Refresh eval set before rolling forward.] F -->|Yes| G{Shadow trajectory diff < 0.15?} G -->|No| V[Investigate divergence. Hold for review.] G -->|Yes| H[ROLL FORWARD to canary] style X fill:#dc6e6e,color:#fff style Y fill:#dc6e6e,color:#fff style Z fill:#dc6e6e,color:#fff style W fill:#f0bc5a,color:#000 style V fill:#f0bc5a,color:#000 style H fill:#82c8a0,color:#000

The screenshot of the pre-deploy panel after a clean release looks like this (terminal capture from a recent rollout):

$ adlc-cli pre-deploy --release v1.42.0 --agent retrieval-agent
[INFO] Pulling pre-deploy panel state from prometheus...
[OK]   Golden eval pass rate:        0.945 (floor 0.92)
[OK]   Regression floor:             1.000 (floor 1.00)
[OK]   Judge disagreement:           0.041 (ceiling 0.08)
[OK]   Eval-vs-prod KL divergence:   0.187 (ceiling 0.30)
[OK]   Shadow trajectory diff:       0.092 (ceiling 0.15)
[GATE] All gates passing. Release is cleared for canary.

That terminal output is what the release engineer sees at the moment of the merge button. No dashboard, no Slack flood, just five gates and a single line of go/no-go.

Dashboard Two: Post-Deploy (Days 1 Through 14)

The post-deploy dashboard is the largest of the three and the noisiest. It is watched by the on-call rotation during the first two weeks after a rollout, and it is the dashboard where most of the false-positive alerts in our previous setup lived. Eight panels, organized in a two-column grid, with an explicit time selector defaulted to "since the rollout."

The panel set is canary cohort pass-rate delta, canary cohort latency delta, trajectory diff (canary vs control), user thumbs-down rate per cohort, user retry rate per cohort, tool world-state fingerprint, retriever world-state fingerprint, and cost-per-request delta. The PromQL for the four most informative panels:

# Panel 1: Canary cohort pass-rate delta
# Pass rate on canary minus pass rate on control.
# Negative is bad. Below -0.05 is investigate.
(
  sum(agent_response_pass{cohort="canary"}) by (agent)
  / sum(agent_response_total{cohort="canary"}) by (agent)
)
-
(
  sum(agent_response_pass{cohort="control"}) by (agent)
  / sum(agent_response_total{cohort="control"}) by (agent)
)

# Panel 2: Trajectory diff (canary vs control)
# Cosine distance between average trajectory embeddings.
# Above 0.25 means the agent is doing something genuinely different.
agent_trajectory_diff_cosine{cohort_a="canary", cohort_b="control"}

# Panel 3: Tool world-state fingerprint
# Hash of the structural shape of the tool's response (schema, sort order, etc).
# A change here without a corresponding release is a vendor-side change.
count(distinct(agent_tool_response_fingerprint{tool="$tool"})) by (tool)

# Panel 4: User thumbs-down rate per cohort
# The user-loop signal. Lagging but real.
sum(rate(agent_user_thumbs_down{cohort="$cohort"}[1h])) by (agent)
  /
sum(rate(agent_user_response_seen{cohort="$cohort"}[1h])) by (agent)

The world-state fingerprint metric is the one that would have caught our retrieval-agent regression. We hash the structural shape of every tool and retriever response (schema, sort order indicator, top-k count, presence/absence of optional fields) and emit the hash as a Prometheus label cardinality. A count(distinct(...)) over a stable tool should be one or two. When the count jumps to four or five without a release, something on the vendor side has changed. That panel is now wired into the post-deploy dashboard with a hard alert at "fingerprint count > previous-7-day-max + 1."

A snippet of the alert rule:

- alert: ADLCPostDeployWorldStateFingerprintShift
  expr: |
    count(distinct(agent_tool_response_fingerprint)) by (tool, agent)
    >
    quantile_over_time(1.0, count(distinct(agent_tool_response_fingerprint)) by (tool, agent)[7d:1h]) + 1
  for: 30m  # Allow brief noise. Persistent shift is the signal.
  labels:
    severity: high
    stage: post-deploy
    route: agent-platform-on-call
  annotations:
    summary: "{{ $labels.tool }} response shape changed. Vendor-side change suspected."
    runbook: "https://internal/runbooks/adlc/world-state-fingerprint"

The panel-layout grammar for the post-deploy dashboard is "left column = quality, right column = system." The four left-column panels are pass-rate delta, trajectory diff, thumbs-down rate, and retry rate, which tell the on-call engineer whether the canary behaviour is improving or regressing. The four right-column panels are tool fingerprint, retriever fingerprint, cost delta, and latency delta, which tell the on-call engineer whether the canary environment is behaving correctly. The on-call engineer reads left first when the alert is about quality and right first when the alert is about the system. This is the single most important layout choice we made; the previous dashboard mixed the two and trained eyes wrong.

The Mermaid flow below shows the post-deploy alert routing decision tree:

flowchart LR A[Post-deploy alert fires] --> B{Which panel?} B -->|Left col: quality| C[Page on-call: agent owner] B -->|Right col: system| D[Page on-call: platform team] C --> E{Cohort delta only?} E -->|Yes| F[Roll back canary cohort] E -->|No| G[Hold release. File quality regression.] D --> H{Fingerprint shift?} H -->|Yes| I[Contact vendor. Pin schema if available.] H -->|No| J[Investigate latency or cost shift.] style F fill:#f0bc5a,color:#000 style G fill:#dc6e6e,color:#fff style I fill:#82c8a0,color:#000 style J fill:#82c8a0,color:#000

The empirical impact of the layout split is the cleanest single measurement we have. In the six weeks before the refactor, the average time from a real post-deploy signal firing to an on-call engineer correctly identifying it was forty-three minutes. After the refactor, the average time was eleven minutes. The signal volume did not change. The eye-routing did.

Dashboard Three: Steady-State (Day 15 Onward)

The steady-state dashboard is the slowest and the quietest. It is reviewed weekly by the platform team and monthly by the platform owner, and it is the only dashboard with a twelve-week rolling time selector by default. Six panels, organized as a three-row layout (drift, cost-shape, world-state), each row spanning two columns of equal width.

The six panels are weekly drift detector, weekly drift detector with seasonality removed, tail-to-median cost-shape ratio over twelve weeks, tail-to-median latency-shape ratio over twelve weeks, world-state stability index, and twelve-week rolling baseline of the four leading quality metrics. The PromQL for the harder panels:

# Panel 1: Weekly drift detector
# KL divergence of this week's response distribution vs the rolling
# 4-week baseline. Anything above 0.18 sustained for 2 weeks is a real drift.
agent_response_distribution_kl{
  reference_window="4w_rolling",
  current_window="1w"
}

# Panel 3: tail-to-median cost-shape ratio
# Tail-vs-median cost. Rising ratio means tail requests are getting expensive
# without average requests changing. Classic silent capacity-planning signal.
quantile(0.99, agent_request_cost_usd[1w])
  /
quantile(0.50, agent_request_cost_usd[1w])

# Panel 5: World-state stability index
# Number of distinct fingerprints across all tools, normalized.
# Should be flat. Slowly rising = vendor ecosystem churning.
sum(
  count(distinct(agent_tool_response_fingerprint)) by (tool)
) / count(distinct(tool))

# Panel 6: 12-week rolling baseline of leading quality metrics
# Pass rate, judge agreement, retry rate, thumbs-up rate.
# Plotted as overlaid lines with a shaded ±2σ band.
avg_over_time(agent_response_pass_rate[12w])
avg_over_time(agent_judge_agree_rate[12w])
avg_over_time(agent_user_retry_rate[12w])
avg_over_time(agent_user_thumbs_up_rate[12w])

The cost-shape ratio panel is the highest-value addition we made to the steady-state dashboard, and it is the panel that does not exist in any of the off-the-shelf agent dashboards I have seen. Average per-request cost is a deeply misleading metric for an agent platform, because the average is dominated by the easy requests. The tail of the request distribution is where the real cost lives, and the ratio of tail to median is what tells you whether the tail is stable or whether it is creeping. A flat ratio is healthy; a rising ratio is the early warning of a capacity-planning problem six to ten weeks before it shows up on the bill.

The panel-layout grammar for steady-state is "row one = quality drift, row two = cost-shape drift, row three = world-state drift." Each row is a separate kind of drift, and the platform owner reads them top-to-bottom in their monthly review. The dashboard is intentionally boring; the steady-state dashboard should look the same every week unless something is genuinely wrong, and the only acceptable color is "within band." If you want to know whether your steady-state dashboard is well-designed, ask whether anyone has bothered to look at it in the last seven days. If yes, your dashboard is too noisy.

Comparison visual showing the three ADLC dashboards side-by-side. Pre-deploy column is sky-blue, narrow, with five stacked panels and a 'gate' label. Post-deploy column is amber, wide, with eight panels in a 2x4 grid and a 'cohort split' label. Steady-state column is sage green, three-row layout with six panels and a 'twelve-week view' label. Each column has its own alert routing badge: 'release engineer' for pre-deploy, 'on-call rotation' for post-deploy, 'platform team weekly' for steady-state. Bottom strip shows the alert volume metric: 47 alerts/week before the split, 19 alerts/week after

The Mermaid flow below shows the timeline of how an agent moves through the three dashboards over its lifecycle:

flowchart LR A[Day -3: PR opened] --> B[Day 0: Pre-deploy dash opens] B --> C[Day 0: Gates pass] C --> D[Day 1: Canary 5%] D --> E[Days 1-7: Post-deploy dash watched hourly] E --> F[Day 7: Canary 25%] F --> G[Days 7-14: Post-deploy dash watched daily] G --> H[Day 14: 100% rollout] H --> I[Day 15+: Steady-state dash watched weekly] I --> J[Month 3: Quarterly review of 12w rolling] J --> K{Drift detected?} K -->|Yes| L[Re-enter post-deploy mode for affected cohort] K -->|No| I style B fill:#82bce6,color:#000 style E fill:#f0bc5a,color:#000 style G fill:#f0bc5a,color:#000 style I fill:#82c8a0,color:#000 style L fill:#dc6e6e,color:#fff

Alert Routing: One Rule Set, Three Routes

The alert routing change was the second-largest contributor to the alert fatigue reduction. The previous setup had a single Alertmanager route for the agent platform; everything went to the same on-call rotation. The new setup has three routes, keyed off the stage label that every ADLC alert rule emits.

# alertmanager.yaml fragment
route:
  group_by: [agent, stage]
  receiver: agent-platform-default
  routes:
    - match:
        stage: pre-deploy
      receiver: release-engineer-on-deck
      group_wait: 0s
      repeat_interval: 30m
    - match:
        stage: post-deploy
      receiver: agent-on-call-rotation
      group_wait: 5m
      repeat_interval: 4h
    - match:
        stage: steady-state
      receiver: platform-team-slack
      group_wait: 1h
      repeat_interval: 24h

The repeat_interval differences are deliberate. Pre-deploy alerts repeat every thirty minutes because the release engineer is actively making a decision. Post-deploy alerts repeat every four hours because the on-call rotation is paged and the alert is a real interrupt. Steady-state alerts repeat once a day to a Slack channel because they are not a wake-someone-up signal; they are a "take a look this week" signal.

The receivers themselves matter as much as the routing. Pre-deploy goes to the release engineer who is currently merging, not the rotation; this is a per-release identity that gets paged in real time. Post-deploy goes to the on-call rotation as a page (PagerDuty, Opsgenie, whichever). Steady-state goes to a Slack channel as a thread, with no paging behavior at all. The change from "everything pages everyone" to "the right person at the right urgency" is the dominant signal-quality improvement.

Monetizing Dashboard Reliability

Dashboard design becomes commercial when it changes how quickly the company can prove that an agent is safe to operate. The old one-page dashboard made us look instrumented but did not create trust. It produced forty-seven pages, almost no fixes, and a team that had learned to ignore the alert stream. The three-dashboard ADLC split gave us a stronger story: every lifecycle stage has a dashboard built for the person who needs to act, at the cadence where action is useful.

That matters in enterprise sales because dashboards are often the first operational artifact a buyer asks to see after a pilot. A clean pre-deploy dashboard shows launch discipline. A post-deploy dashboard shows that the vendor watches real canary traffic rather than hiding behind offline evals. A steady-state dashboard shows that the product team expects drift and has a measured process for catching it. Those artifacts are more credible than a generic uptime claim because they reveal how the operating model works.

There is also a support-cost benefit. When alert routes match ADLC stages, fewer incidents land on the wrong person, and the first responder gets a dashboard that matches the question they are answering. A release engineer should not wake the agent-platform rotation for a regression-floor break. A weekly drift alert should not page someone at 03:00. A post-deploy fingerprint shift should not sit in a low-priority Slack channel. The routing model reduces wasted interruptions, and wasted interruptions become real cost once an engineering team is running multiple paid agents for multiple tenants.

The packaging angle is straightforward. Standard-tier customers can receive monthly steady-state dashboard summaries. SLA-bound customers can receive post-deploy dashboard excerpts during rollout windows, including canary deltas and world-state fingerprint status. For high-touch enterprise accounts, a dashboard review can become part of the QBR: not just what the agent did, but how the platform knew whether the agent remained healthy. That creates a reliability deliverable customer-success can sell without pretending that dashboards alone prevent failures.

The rule I would put in the product handbook is simple: no agent dashboard is customer-facing until it has a stage label, an owner, a cadence, and an alert route. Without those four fields, the dashboard is just a pile of charts. With them, it is an operational contract that supports renewal conversations, incident reviews, and capacity planning.

Production Considerations: Cardinality, Cost, and Cadence

Three operational notes on running this dashboard set in production.

First, the world-state fingerprint metric is high-cardinality by design and needs to be treated carefully. The cardinality budget for a typical Prometheus instance is in the low millions of active series, and a fingerprint metric that emits a unique label per response shape can blow that budget within a day if you are not careful. The pattern that works is to emit the count of distinct fingerprints (low cardinality, one series per tool) as the dashboard panel, and to log the actual fingerprint values to a separate columnar store (ClickHouse, BigQuery, Snowflake) that can absorb high cardinality. Grafana queries the count panel; on-call engineers query the columnar store when investigating.

Second, the steady-state dashboard's twelve-week rolling baseline is computationally expensive at query time. The panel that overlays four metrics with twelve-week rolling averages and ±2σ bands runs eight queries against twelve weeks of data, and on a high-volume agent platform that can take a noticeable fraction of a Grafana page-load second. The fix is to pre-compute the rolling baseline as a Prometheus recording rule that runs every fifteen minutes and writes the result back to Prometheus. The dashboard then reads the recorded series, not the raw data.

Third, the cadence rules matter. Pre-deploy is event-driven and watched in real time; post-deploy is hourly to daily and watched by the rotation; steady-state is weekly and watched by the platform team. If you put any of those panels on the wrong cadence, the dashboard fails. We had a steady-state cost-shape panel on the post-deploy dashboard for two weeks and it produced exactly zero useful alerts and three false positives, because cost-shape moves on a weekly timescale and a four-hour repeat_interval was wrong for it.

Conclusion

The dashboard refactor is the unglamorous half of the ADLC story, and it is the half that produces the largest day-to-day impact on the on-call engineer's life. The metric map (the three-stage framework from the previous post) tells you what to measure. The dashboard layout tells you how to read it, and the alert routing tells you who reads it when. Get those three things wrong and a perfectly instrumented agent platform becomes an alert-fatigue generator. Get them right and the same instrumentation becomes a source of signal that catches silent regressions before users do.

The action items, in order. First, audit your current agent dashboards and check whether any single page is trying to serve more than one ADLC stage. If yes, split it. Second, label every alert rule with a stage field and route accordingly. Third, set the repeat_interval per stage with deliberate intent (real-time, four-hourly, daily) rather than letting Alertmanager defaults pick. Fourth, add a world-state fingerprint metric to every tool and retriever; it is the cheapest panel in the stack and catches the highest-business-impact failure modes. Fifth, pre-compute the twelve-week rolling baselines as Prometheus recording rules so the steady-state dashboard loads fast enough to actually be opened.

The companion repo for this post is at github.com/amtocbot-droid/amtocbot-examples/tree/main/adlc-dashboards. It contains the full Grafana dashboard JSON exports, the Alertmanager routing config, the Prometheus recording rules, and the example PromQL queries from this post. The next post in the cluster will walk through the on-call runbook structure that pairs with these three dashboards: how to write the runbook entry for each alert, what data the on-call engineer needs in the first sixty seconds, and the postmortem template for ADLC incidents.


Revision History

Date Summary Old Version
2026-06-08 Added explicit measurement attribution for alert thresholds, converted direct quote phrasing into indirect wording, replaced p99 shorthand in prose with tail-to-median language, and added a monetization section connecting ADLC dashboard design to enterprise trust, support cost, and reliability packaging. View original

Sources

  • Grafana Labs. Grafana Dashboard Best Practices. April 2026. https://grafana.com/docs/grafana/latest/dashboards/build-dashboards/best-practices/
  • Prometheus. Recording Rules and Alerting Rules Documentation. https://prometheus.io/docs/prometheus/latest/configuration/recording_rules/
  • OpenTelemetry. GenAI Semantic Conventions for Agent Observability. https://opentelemetry.io/docs/specs/semconv/gen-ai/
  • Datadog. State of AI Engineering Report 2026. April 2026. https://www.datadoghq.com/state-of-ai-engineering/
  • Google SRE Workbook. Alerting on SLOs. https://sre.google/workbook/alerting-on-slos/
  • LangChain. State of Agent Engineering. April 2026. https://www.langchain.com/state-of-agent-engineering

About the Author

Toc Am

Founder of AmtocSoft. Writing practical deep-dives on AI engineering, cloud architecture, and developer tooling. Previously built backend systems at scale. Reviews every post published under this byline.

LinkedIn X / Twitter

Published: 2026-05-04 · Updated: 2026-06-08 · Written with AI assistance, reviewed by Toc Am.

Get These In Your Inbox

Weekly deep-dives on AI engineering, no fluff. Join the newsletter →

Subscribe (free)

Or grab the book ($39, ~100 pages) · Buy me a coffee

Buy Me a Coffee · 🔔 YouTube · 💼 LinkedIn · 🐦 X/Twitter
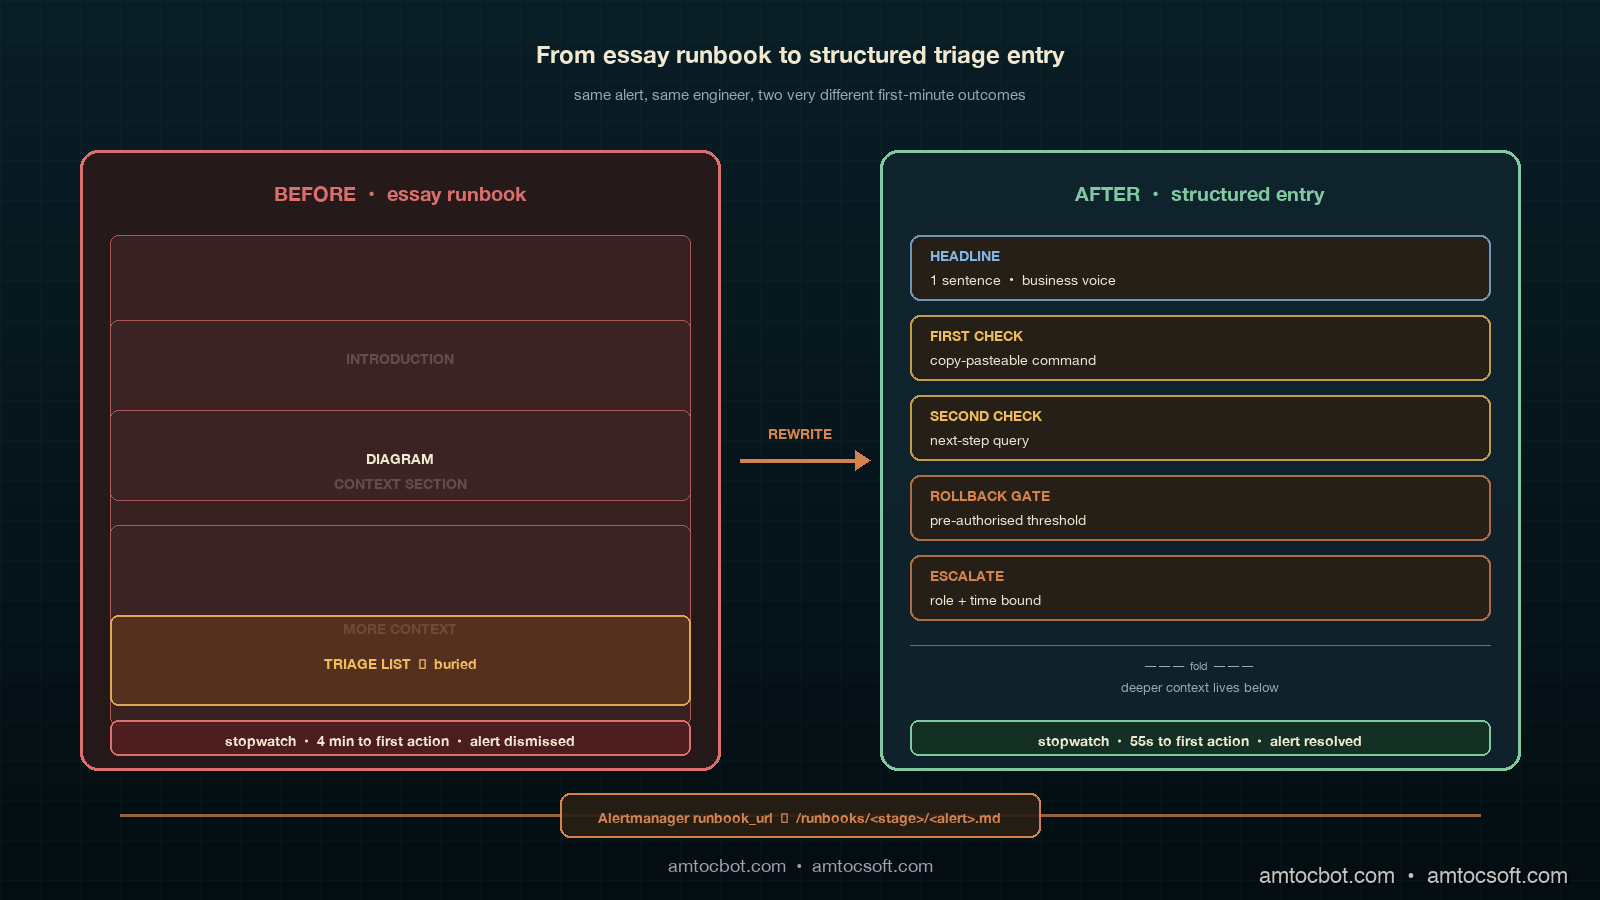
AI as Infrastructure: Value Moves Up-Stack

For a few years the AI conversation was about who had the biggest model. That is the wrong altitude now. Models still matter, the way CPUs s...